Pages and page groups
- How-to guide
- 7-min read
- Published May 13, 2021
Pages and page groups for web applications provide you with an extra layer of contextual information for your user actions and other RUM entities. You can use this additional context to enhance the finding, filtering, and aggregation of your end users' experience, performance information, and troubleshooting-relevant data.
- Use pages to analyze user actions on a single webpage across all user sessions.
- Use page groups to automatically group user actions that lead to technically similar or equal pages while not losing the details of individual instances.
In Dynatrace versions 1.213 and earlier, you had to configure user action naming rules to achieve a similar outcome.
Automatic grouping of pages and user actions
Let's have a look at our sample app EasyTravel, a travel-booking portal.
EasyTravel app
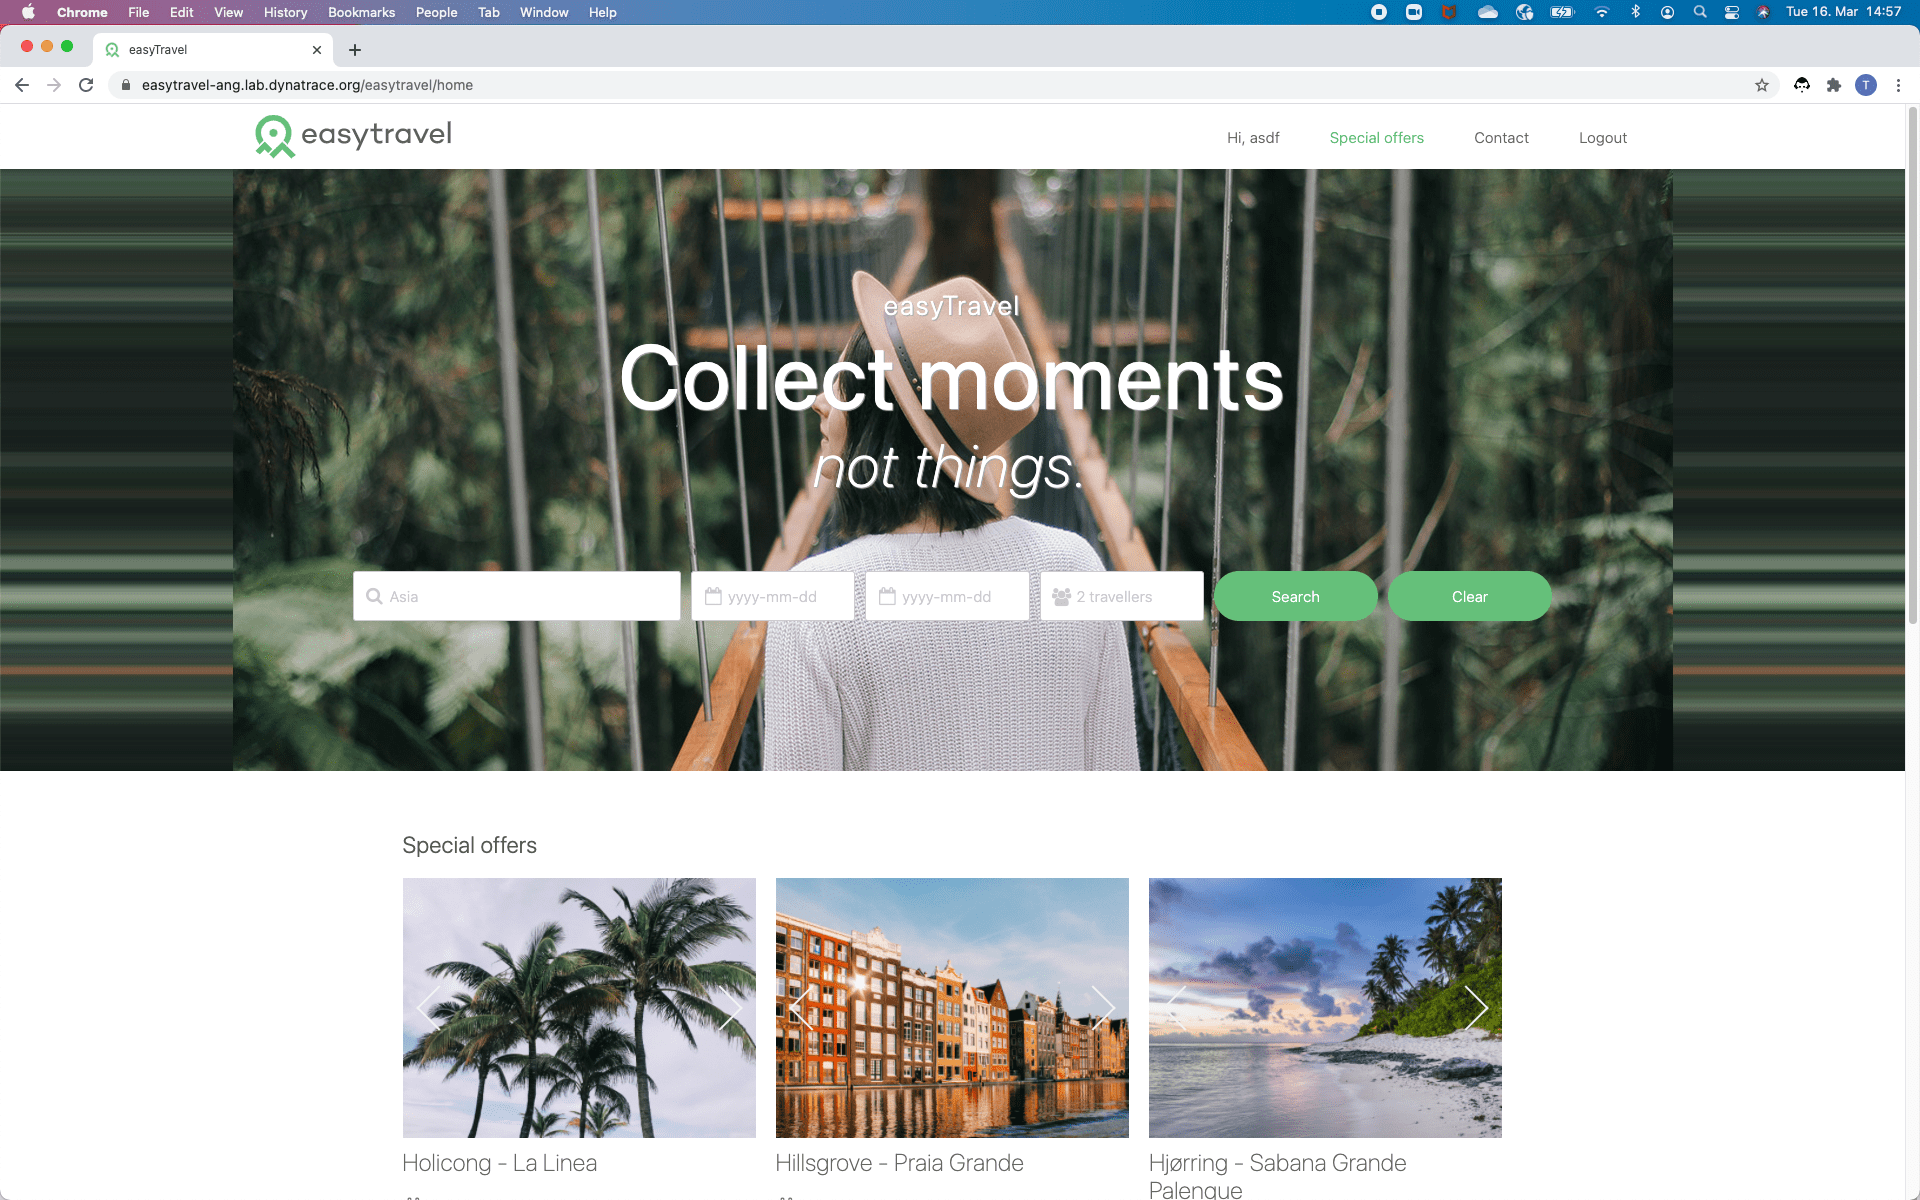
EasyTravel presents a number of journey offers.
- Each offer has its own details page.
- The details pages are identical technically; only the content differs. Example details pages would be
/easytravel/journeys/123456and/easytravel/journeys/654321. These pages differ only in the journey identifier.
Page groups
Let's evaluate the performance of this application. Instead of comparing journeys, it makes sense to start one level up and analyze the performance of groups of technically identical pages. This is where page groups come in. Page groups are based on the paths and IDs that Dynatrace automatically detects.
Here is the relationship between pages and page groups in this example:
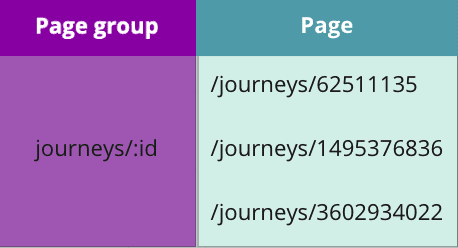
In general, page grouping works out of the box. Whenever you use Angular or Vue.js, Dynatrace automatically instruments your respective framework router, which then immediately provides you with developer-friendly, intuitive names and groups. If you use other frameworks, such as React, then Dynatrace uses intelligent cluster-side grouping based on path levels and automatic ID detection in the path of your page to group your web application pages.
User actions
A user action can:
- Trigger a page reload, such as when you select a navigation link on a server-side rendered page and cause a load action.
- Start a route change, such as when you trigger a soft navigation through an XHR action in a single-page application.
- Occur without a page reload or a route change, such as when you select a button that triggers an XHR action, which fetches new data and updates a chart, but you remain on the same page.
Load actions vs pages and page groups
Load actions
To group multiple load actions that represent page loads of similar or technically equal pages, you create a placeholder. Usually, you replace all IDs or session-specific details with a uniform URL string. Your placeholder is then included in a user action naming rule and applied to all related user actions. The final result is that individual user actions such as Loading of page /journeys/62511135 and Loading of page /journeys/61303030 are mapped to a common URL string: Loading of page /journeys/id.
While this allows you to look at aggregated performance data for a single page (for example, the EasyTravel journey details pages), you lose the details of individual pages (for example, the details of each specific journey).
Pages and page groups
With pages and page groups, you keep all of the individual details, so you can see and analyze your performance and troubleshooting information at the page level and the page-group level. The page name attribute preserves the individual detail, while the page group attribute can be used to look at aggregates.
However, in terms of performance analysis, pages don't replace load actions; they complement them since the underlying performance data is still drawn from the underlying load actions.
Define your own page grouping
If the automatic grouping doesn't cover all of your application's use cases, use the RUM JavaScript API to set your own page and page group names.
-
In your
index.jsfile, make a call todtrum.enableManualPageDetection(), which tells the RUM JavaScript to stop auto-detecting and auto-grouping your page change events. -
Use the
dtrum.setPage(newPage: APIPage) command to set your desired page name and group:dtrum.setPage ({name: "My page",group: "My page group"});
Access pages and page groups
To review monitoring data on pages and page groups, start with the application overview page. To get there, go to Web and select your application.
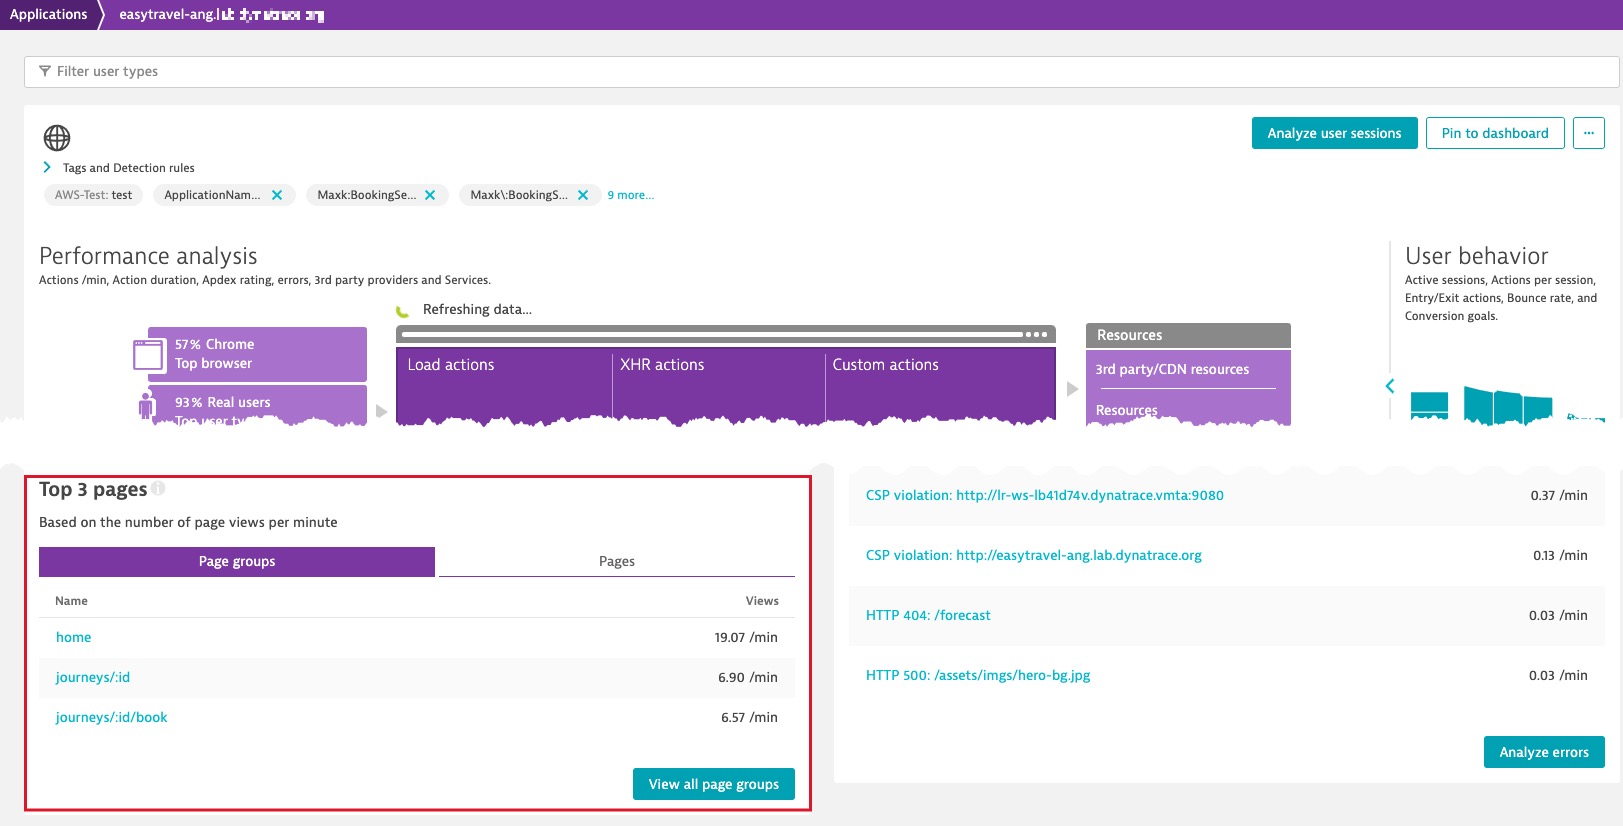
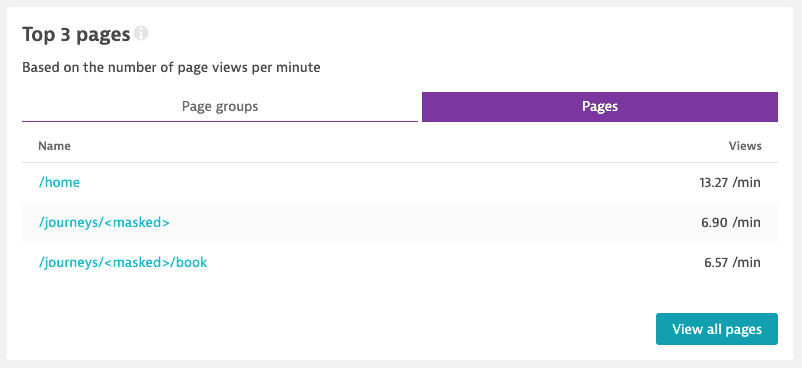
Page groups tab and Pages tabs
The application overview page displays the Top 3 pages section that includes the Page groups and Pages tabs. Choose a tab that displays the granularity you want.
The Page groups tab lists the top three page groups based on the number of page views per minute.
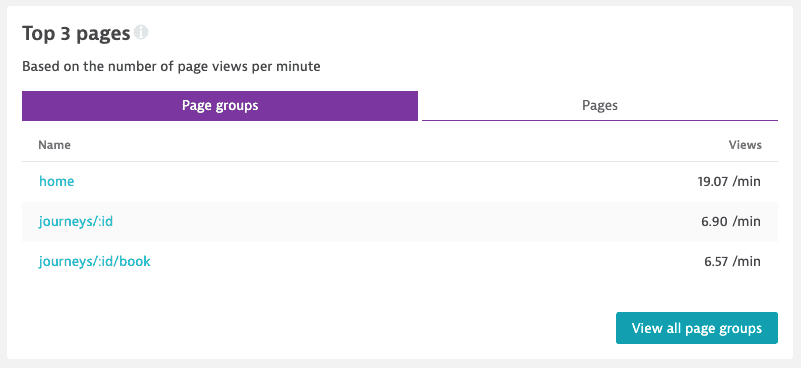
- Select a group to go to its overview page.
- Select View all page groups to display Multidimensional Analysis for all page groups.
Multidimensional analysis page
The Multidimensional analysis page offers a particularly useful overview of all pages or page groups.
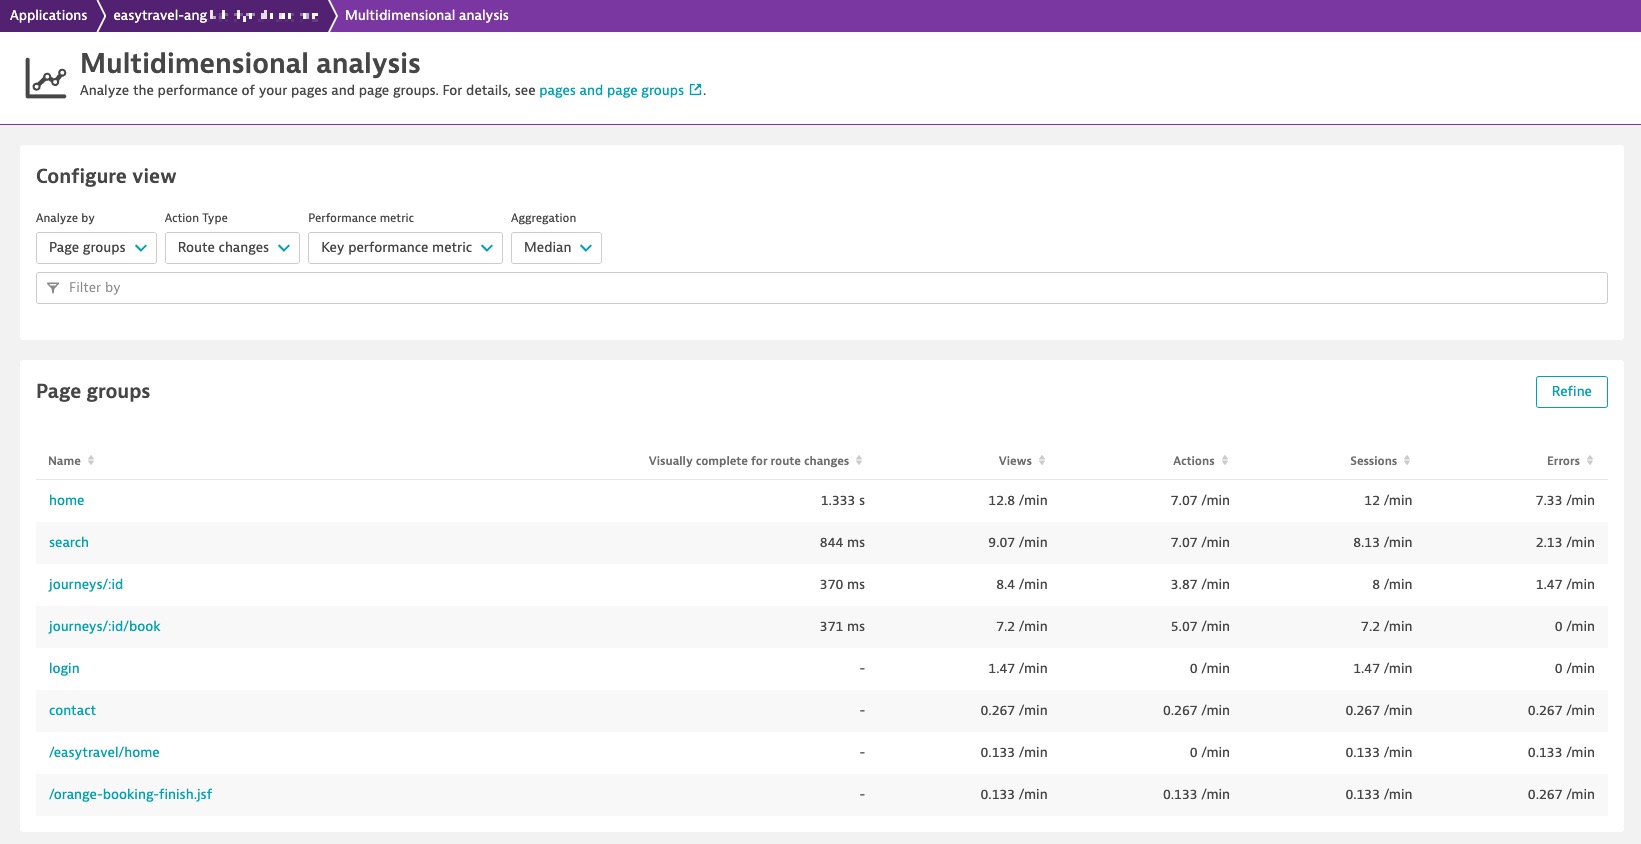
This page can help you find answers to the following questions:
- Which page groups or pages are the most viewed?
- Which are the most visited?
- Which are the busiest page groups or pages where lots of actions occur?
- Which contain the most errors?
- Which are slow on their initial page load?
- Which are slow on a route change?
Sessions display your detected page changes as an additional Page change event type, including page changes based on full page loads and route changes. Dynatrace User Sessions Query Language (USQL) allows you to query and count your Page change events.
Page group or page overview page
On the Multidimensional analysis page, select a page or page group to go to its overview page. In the screenshot below, you can see the overview page for the journeys/:id/book page group.
Page group overview page
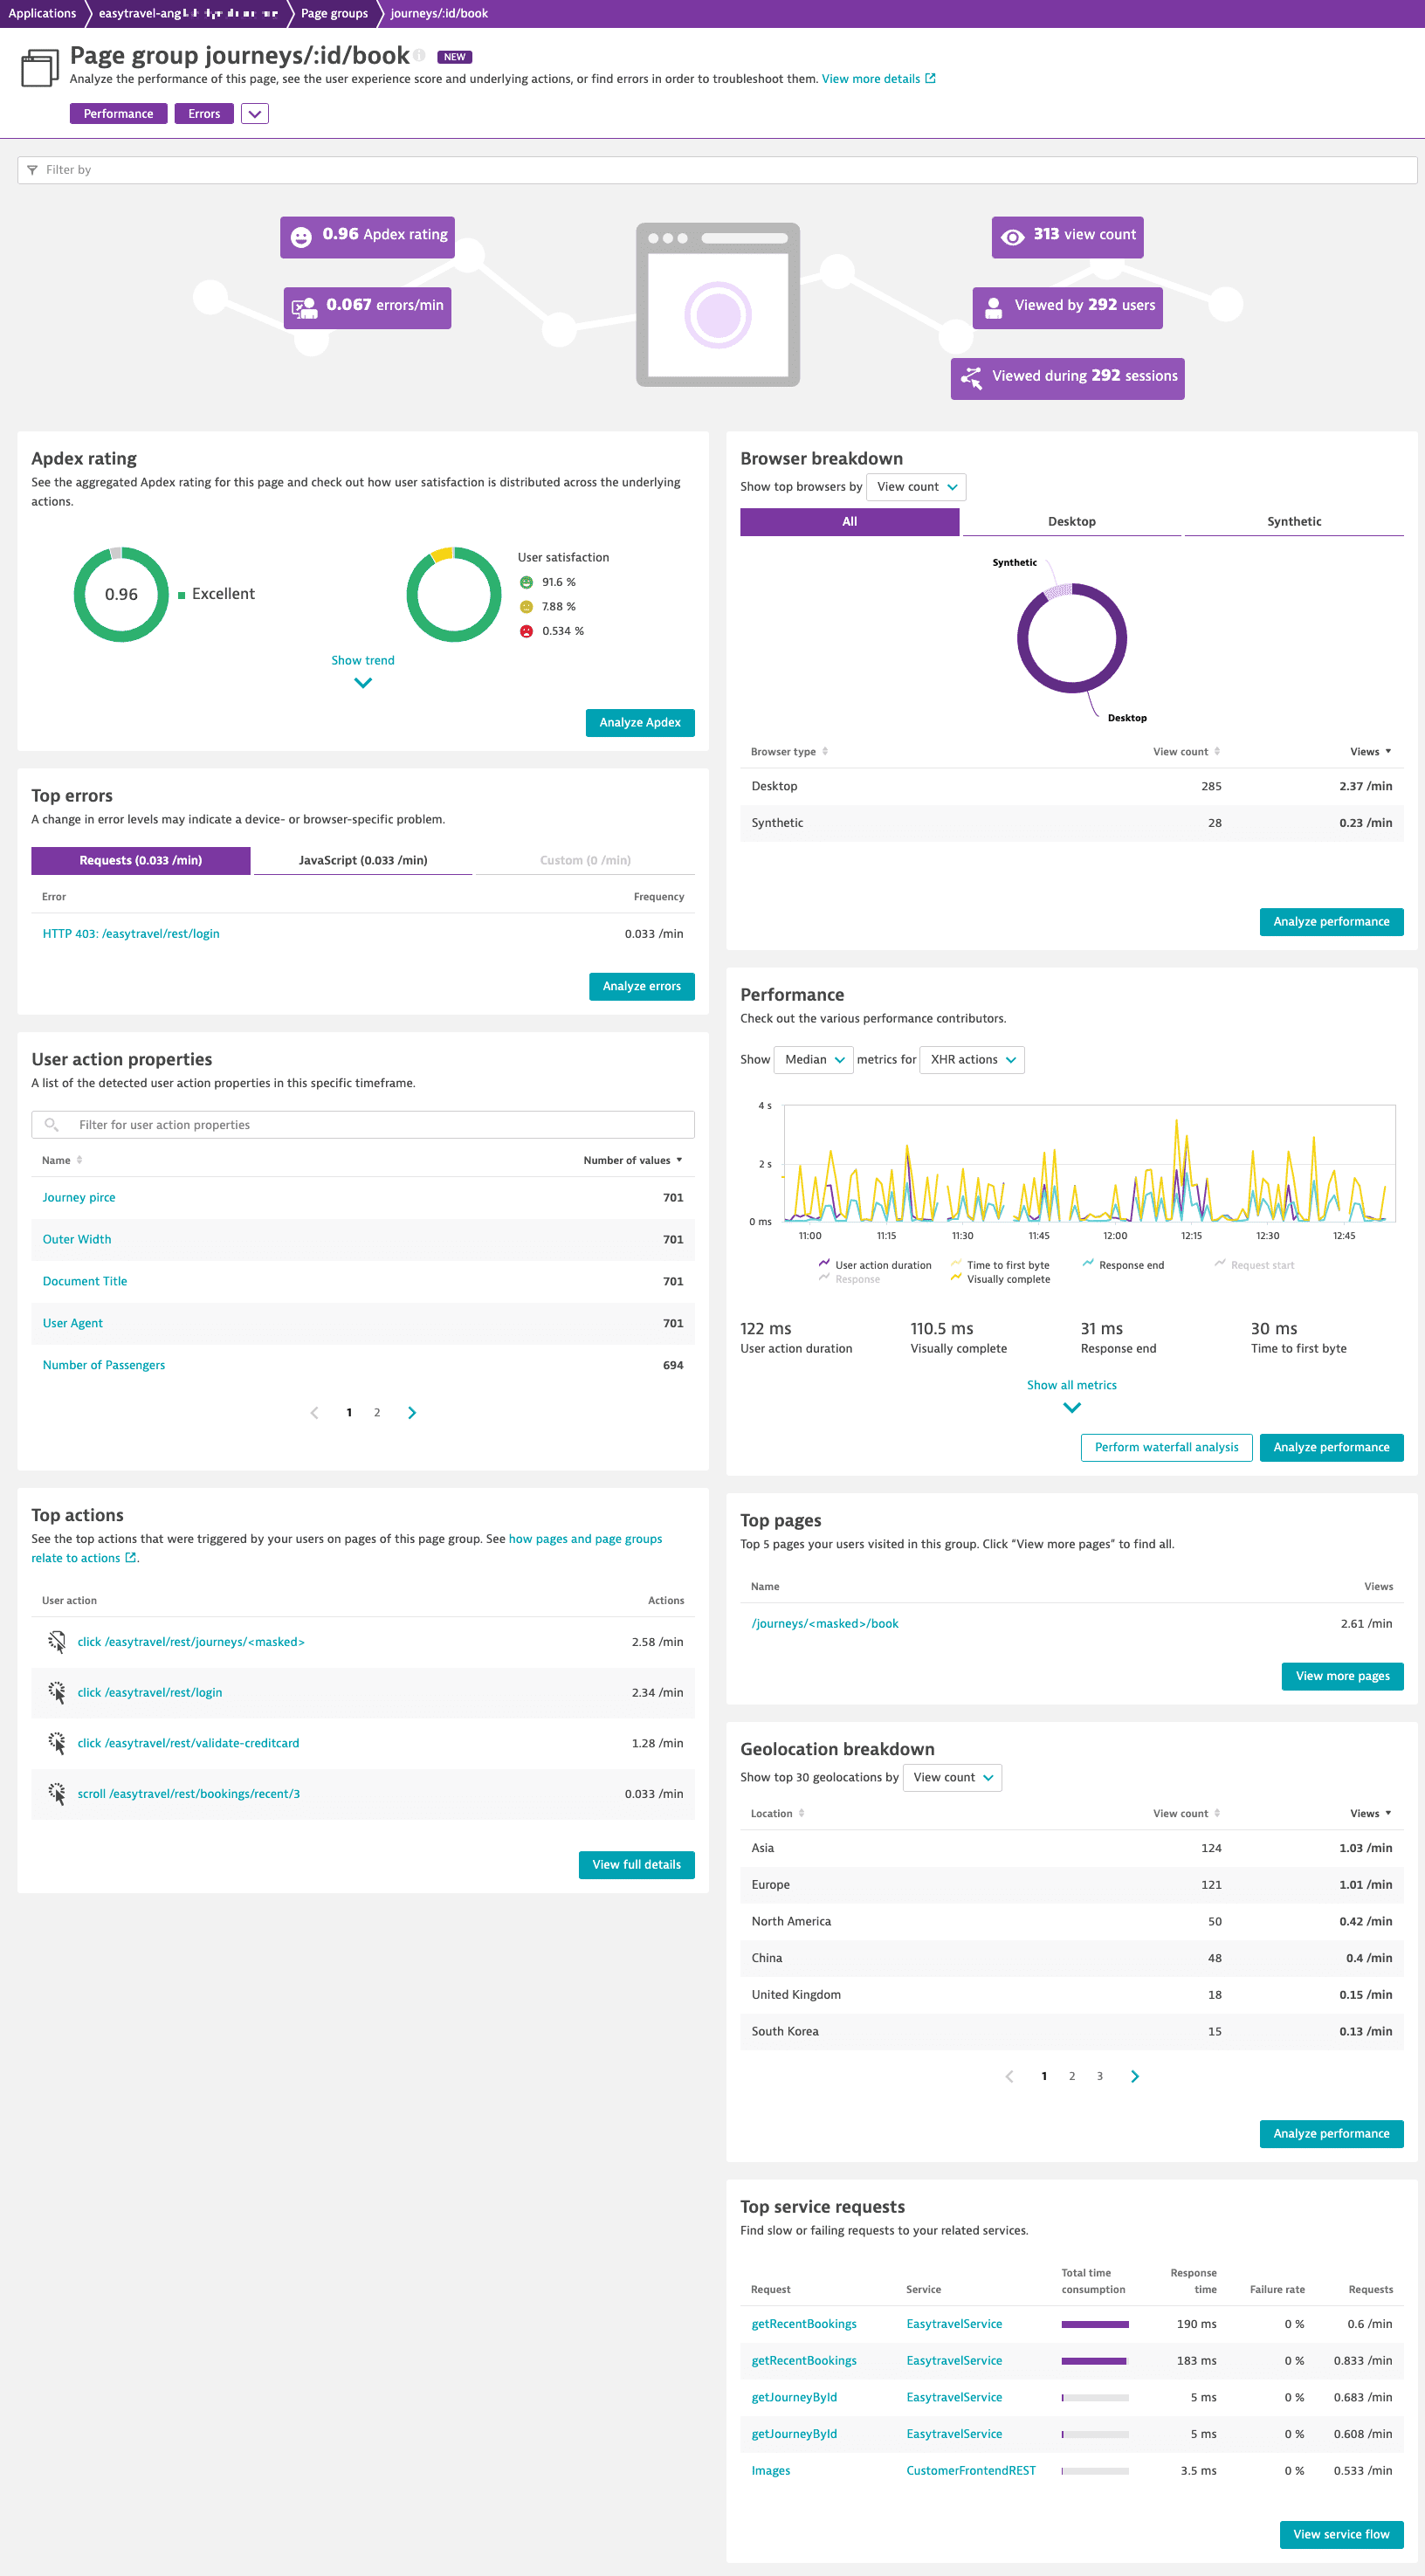
Chart page and page group performance
To chart the performance of a page or page group, create a calculated metric for the page or page group in the existing multidimensional analysis. You can then use Data Explorer to chart the metric on a dashboard of your choice.
To create a calculated metric for a page or page group
-
Go to Web.
-
Select the application to display its application overview page.
-
Under Impact of user actions on performance, select Analyze performance.
-
In the Detail analysis for selected timeframe section, select a performance metric, and then set a filter for a page name or a page group.
-
Select Create metric.
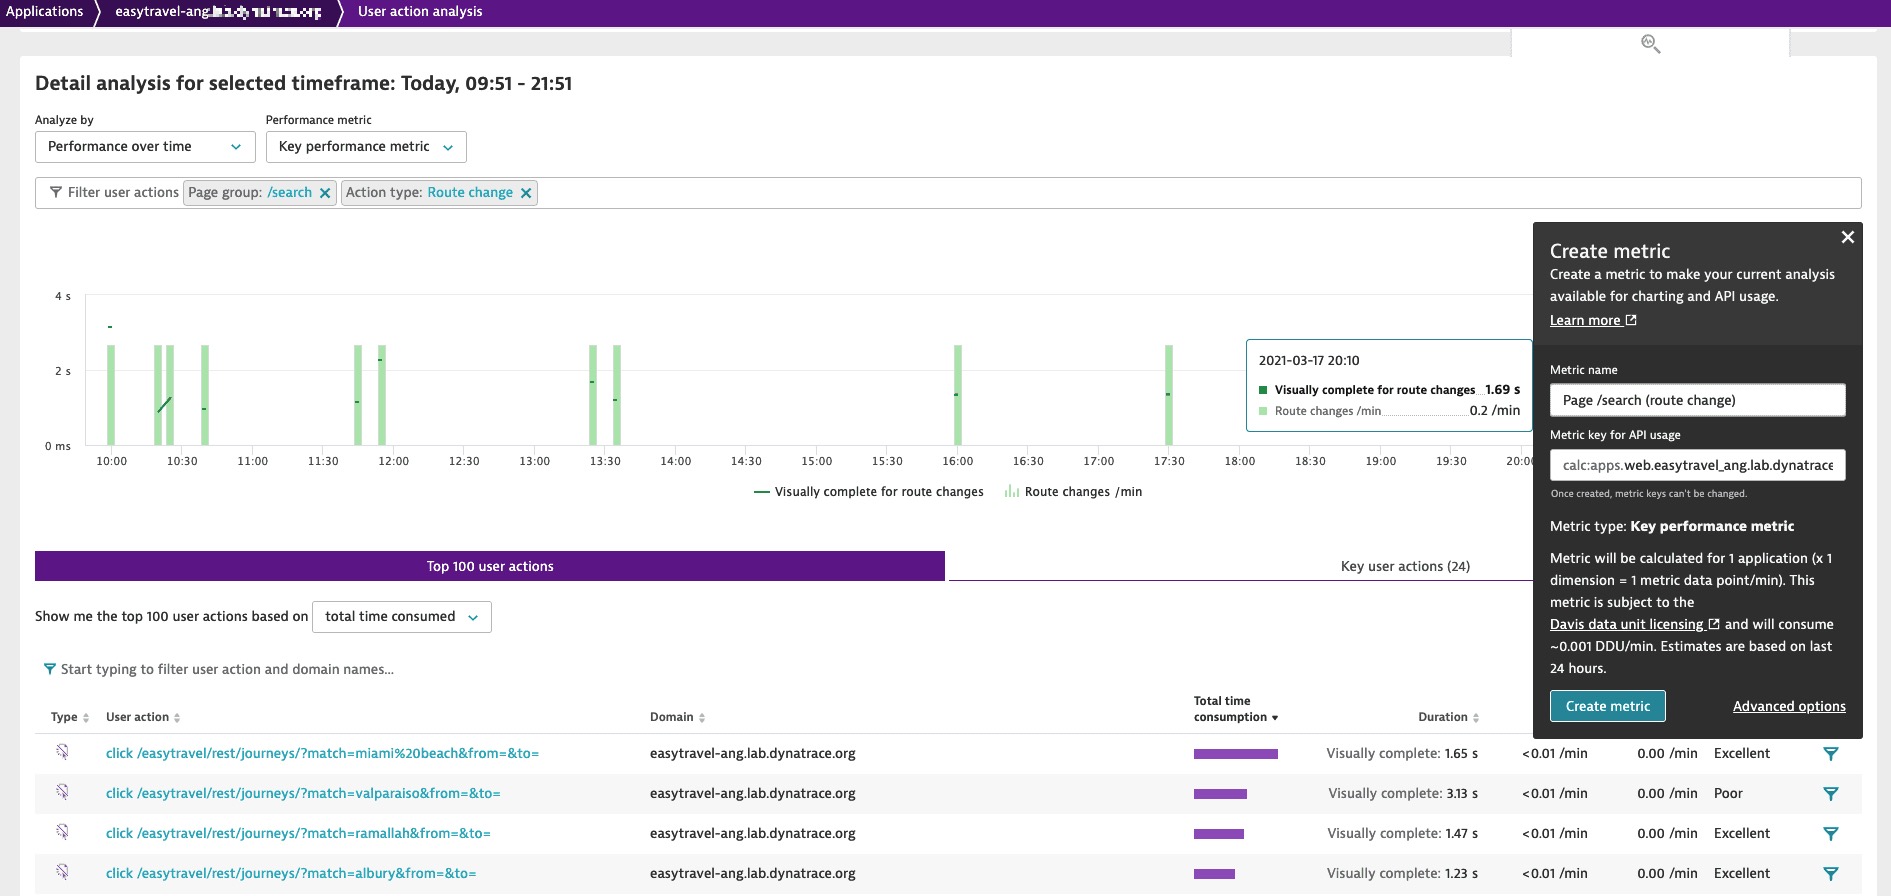
For details on creating and charting calculated metrics, see Create calculated metrics for web applications.
Analyze route changes
In single-page applications (SPAs) and progressive web applications (PWAs), end users don't necessarily trigger full page reloads when they navigate from one page to another.
Such web applications use a router component that fetches only the resources required to construct a new page asynchronously. Soft navigations (in other words, "in-page" navigations) are therefore also called "route changes" and reuse already loaded and rendered HTML structures. Dynatrace detects these soft navigations and marks them as route changes.
A route change in Dynatrace isn't technically a new user action type but rather a specific kind of XHR action. It's navigation in a single-page application without loading new documents; however, it might still look or feel like navigating to a new page.
To analyze route changes
- Go to Web.
- Select the application to display its application overview page.
- Under Top 3 pages, select View all page groups or View all pages.
- In the Action type dropdown list, select Route changes to set focus on route changes for individual page groups or pages.
- Select a page group or a page that you want to analyze.
- Under Performance, select Route changes from the dropdown list to get detailed information on performance.
- Select Perform waterfall analysis to analyze the underlying actions of the route change for this page. Here, you can put detailed performance and error information into context.
