View crash reports for custom applications
- How-to guide
- 1-min read
Reviewing and fixing crashes is vital to improving your application's user experience. Dynatrace captures crashes and their stack traces so that you can assess the criticality of a crash and identify the root cause of the issue. With the crash-analysis workflow, you can see the impact of crashes, identify the affected user groups, and quickly get to the root cause. By proactively resolving issues, you can ensure that your applications consistently meet your business goals.
When working with a client-server setup, some crashes have their root cause on the server side. Dynatrace uses PurePath® technology and OneAgent® to correlate user actions with web requests, thereby giving you complete visibility, from individual user actions to the specific server-side database statements that contribute to crashes.
To view the basic information on crashes for your application
- Go to Frontend.
- Select the application you want to analyze.
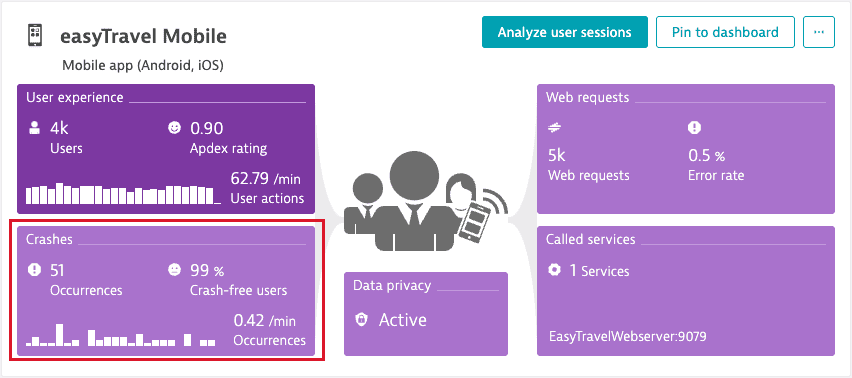
- From the application overview page, select the Crashes & Errors tile.
The Crashes & Errors tile shows the number of crash occurrences, percentage of crash-free users, and crash rate for the currently selected timeframe. The Crashes by version chart displays the total number of crashes by version for the currently selected timeframe.
To access crash reports for your application
- From your application overview page, select the Crashes & Errors tile.
- Under the Crashes by version chart, select Analyze crashes. The Crash analysis page opens.
Crash analysis page
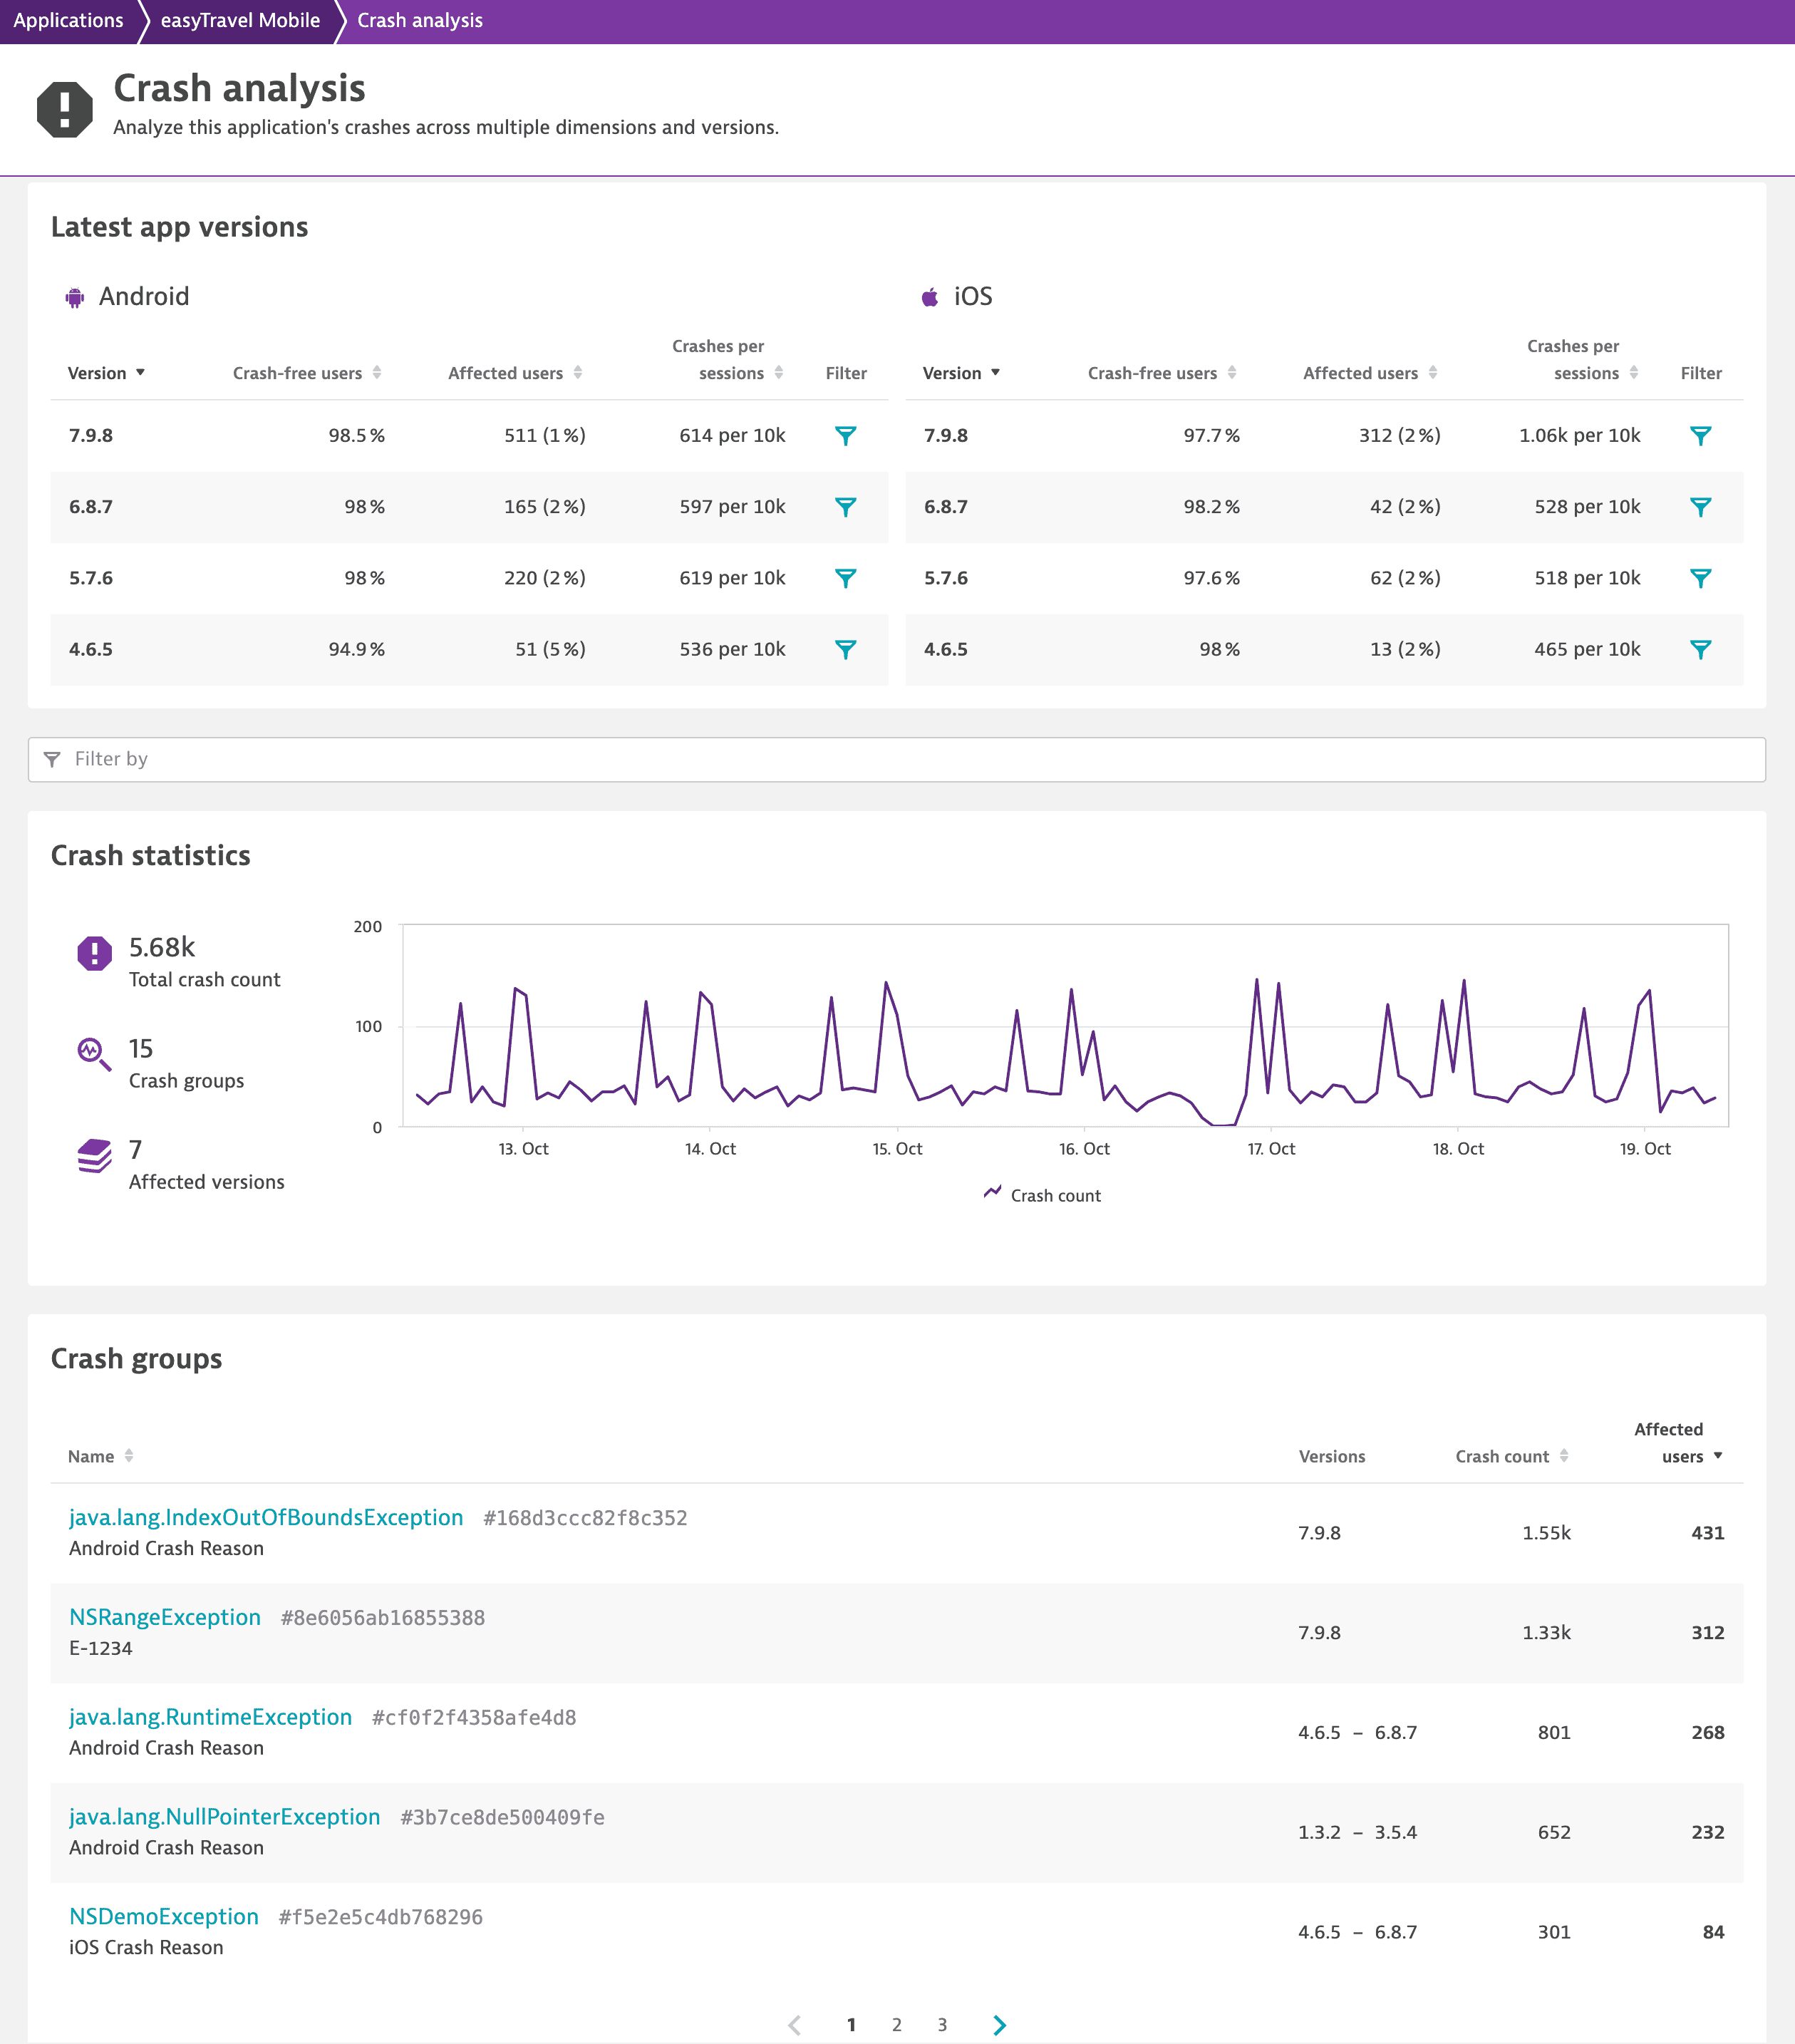
The Crash analysis page gives you an overview of all crash groups that occurred during the selected timeframe and allows you to focus on a range of properties and dimensions that might be specific to the crash pattern. Therefore, you can analyze crashes based on the operating system version, application version, user region, session duration, connectivity type, and other dimensions.
Latest app versions
The Latest app versions section provides crash information for four latest app versions. For each app version, you can check the percentage of crash-free users, number of affected users, and number of crashes per certain number of sessions.
Crash statistics
In the Crash statistics section, you can check the total crash count, number of crash groups, and number of affected versions for the currently selected timeframe. In the Latest app versions section, select Filter ![]() next to the version you're interested in to get this information for a particular version.
next to the version you're interested in to get this information for a particular version.
You can also use other filters, such as Connection type, Country, or Manufacturer.
Crash groups
Dynatrace groups crashes by similarity of the stack trace and occurrence in the source code. This usually also works across different versions of your application so that you can easily find out if a crash is still present in the latest release.
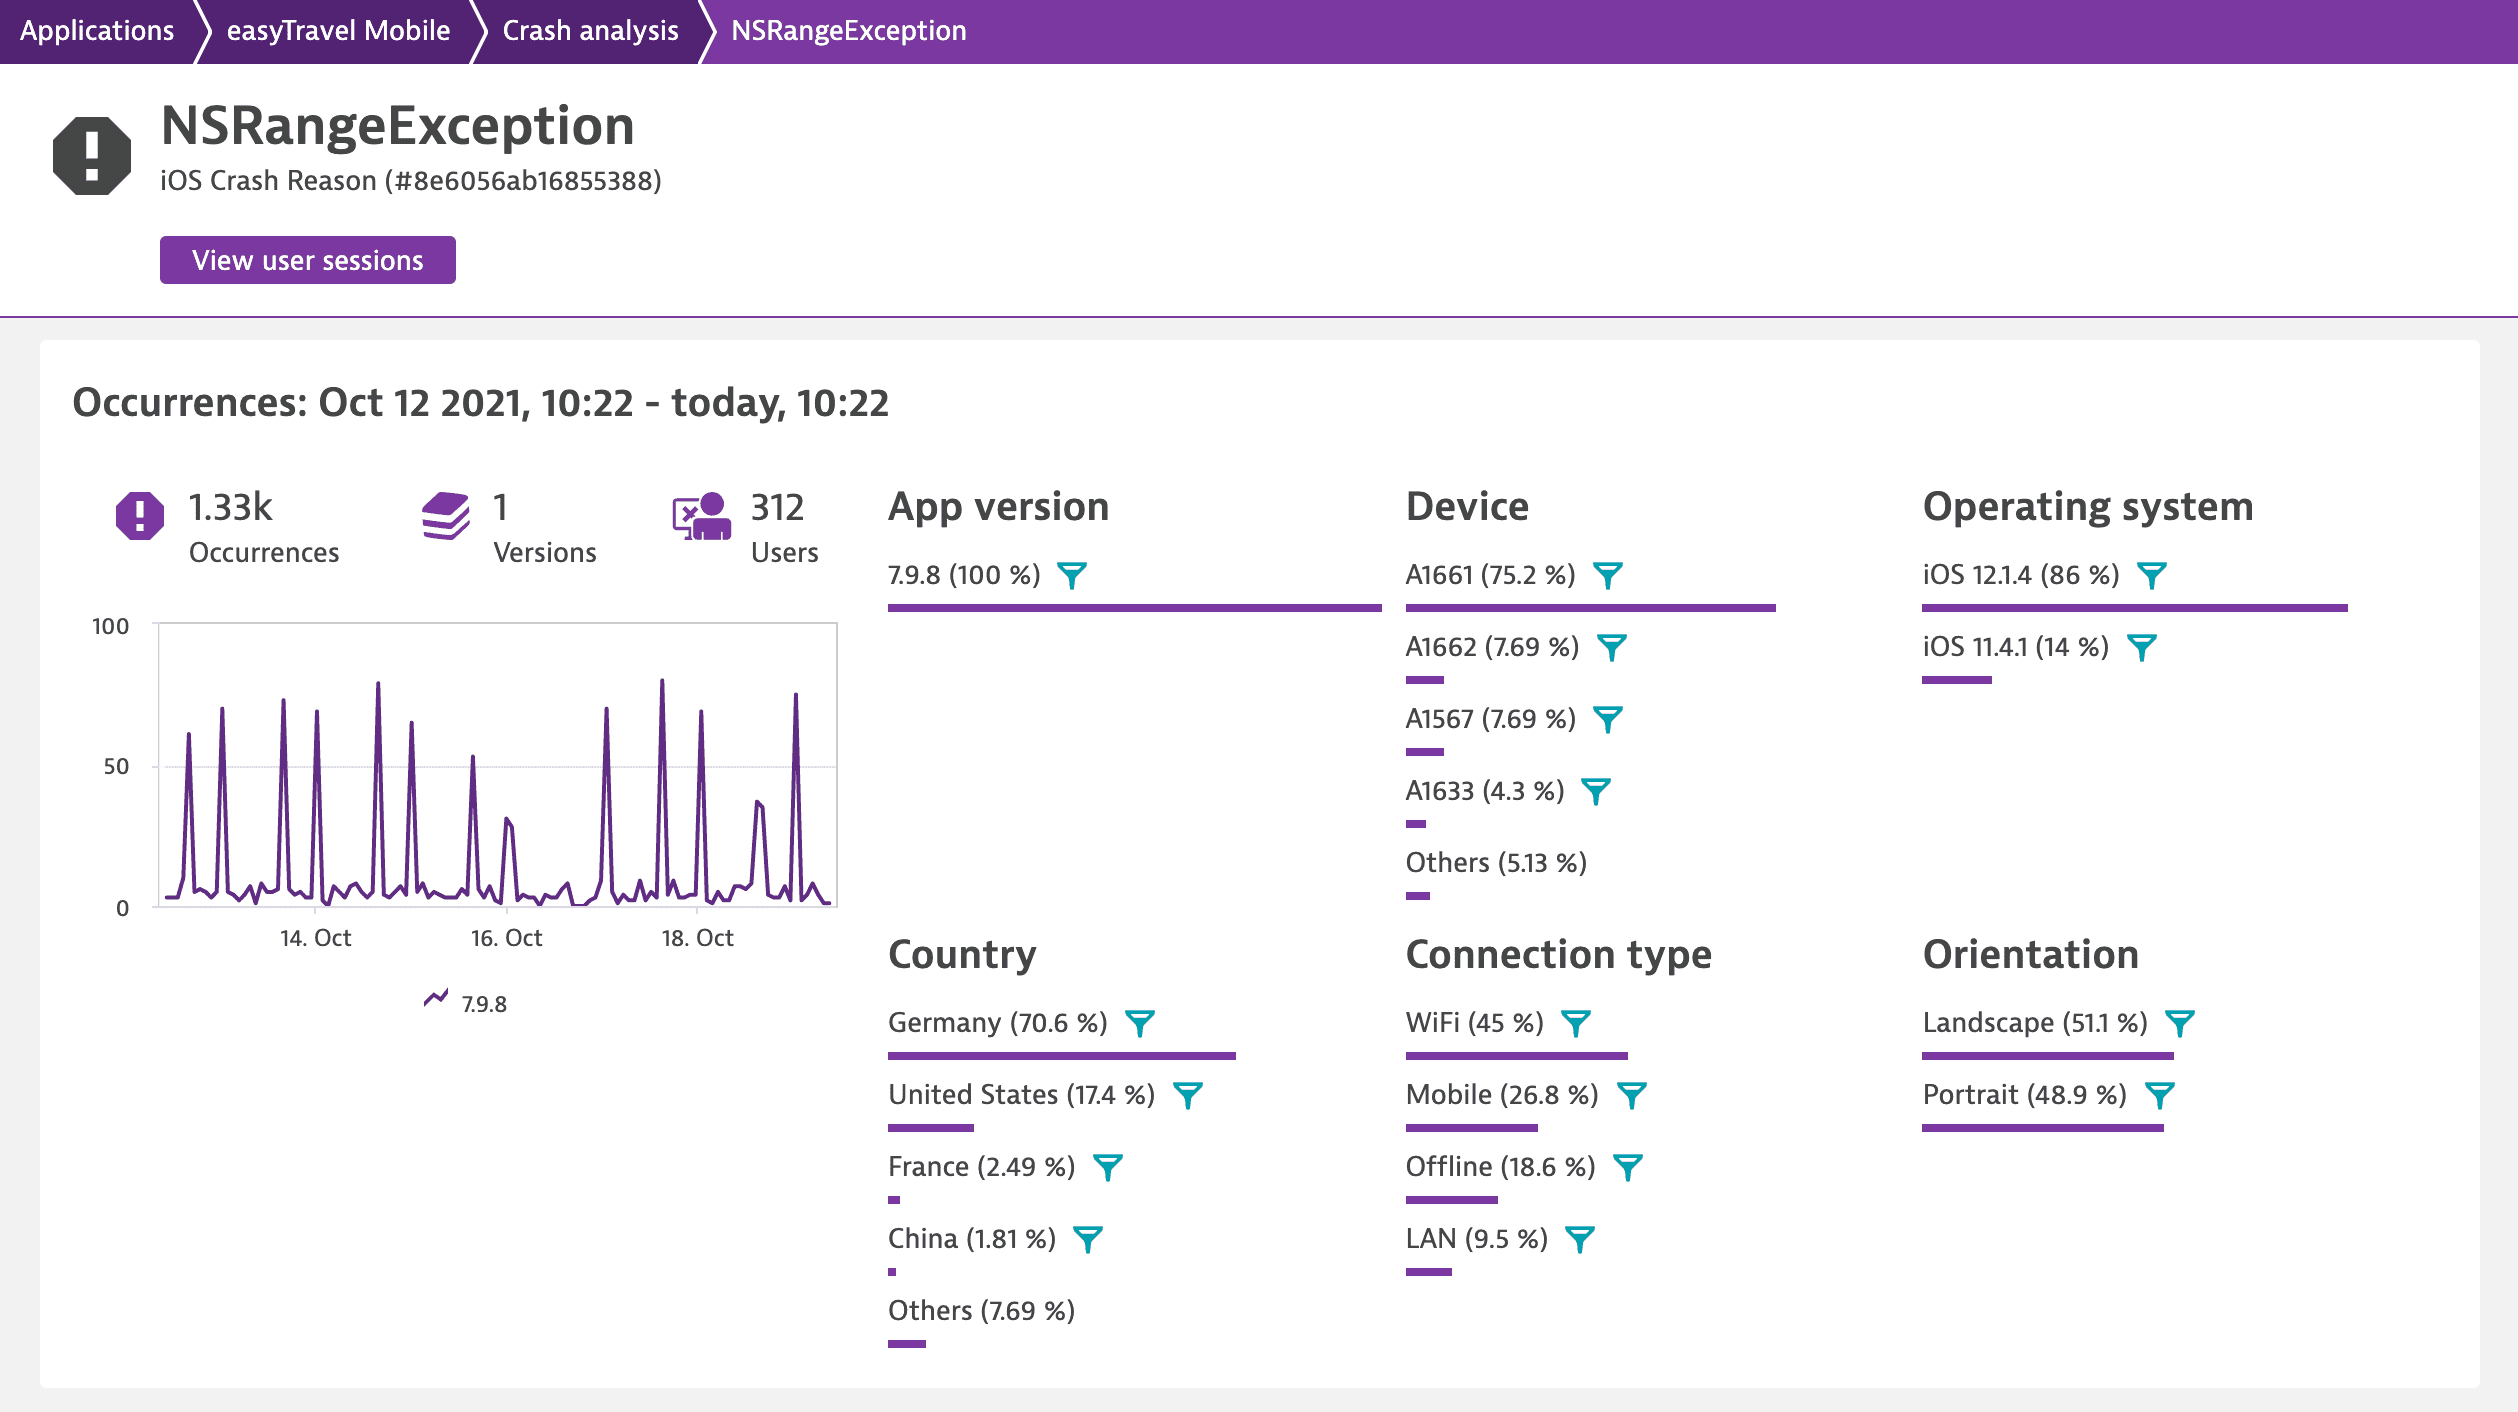
Crash group details page
Under Crash groups on the Crash analysis page, select a crash group you're interested in to access all crash instances. Filter them to investigate a particular part of the crash group.
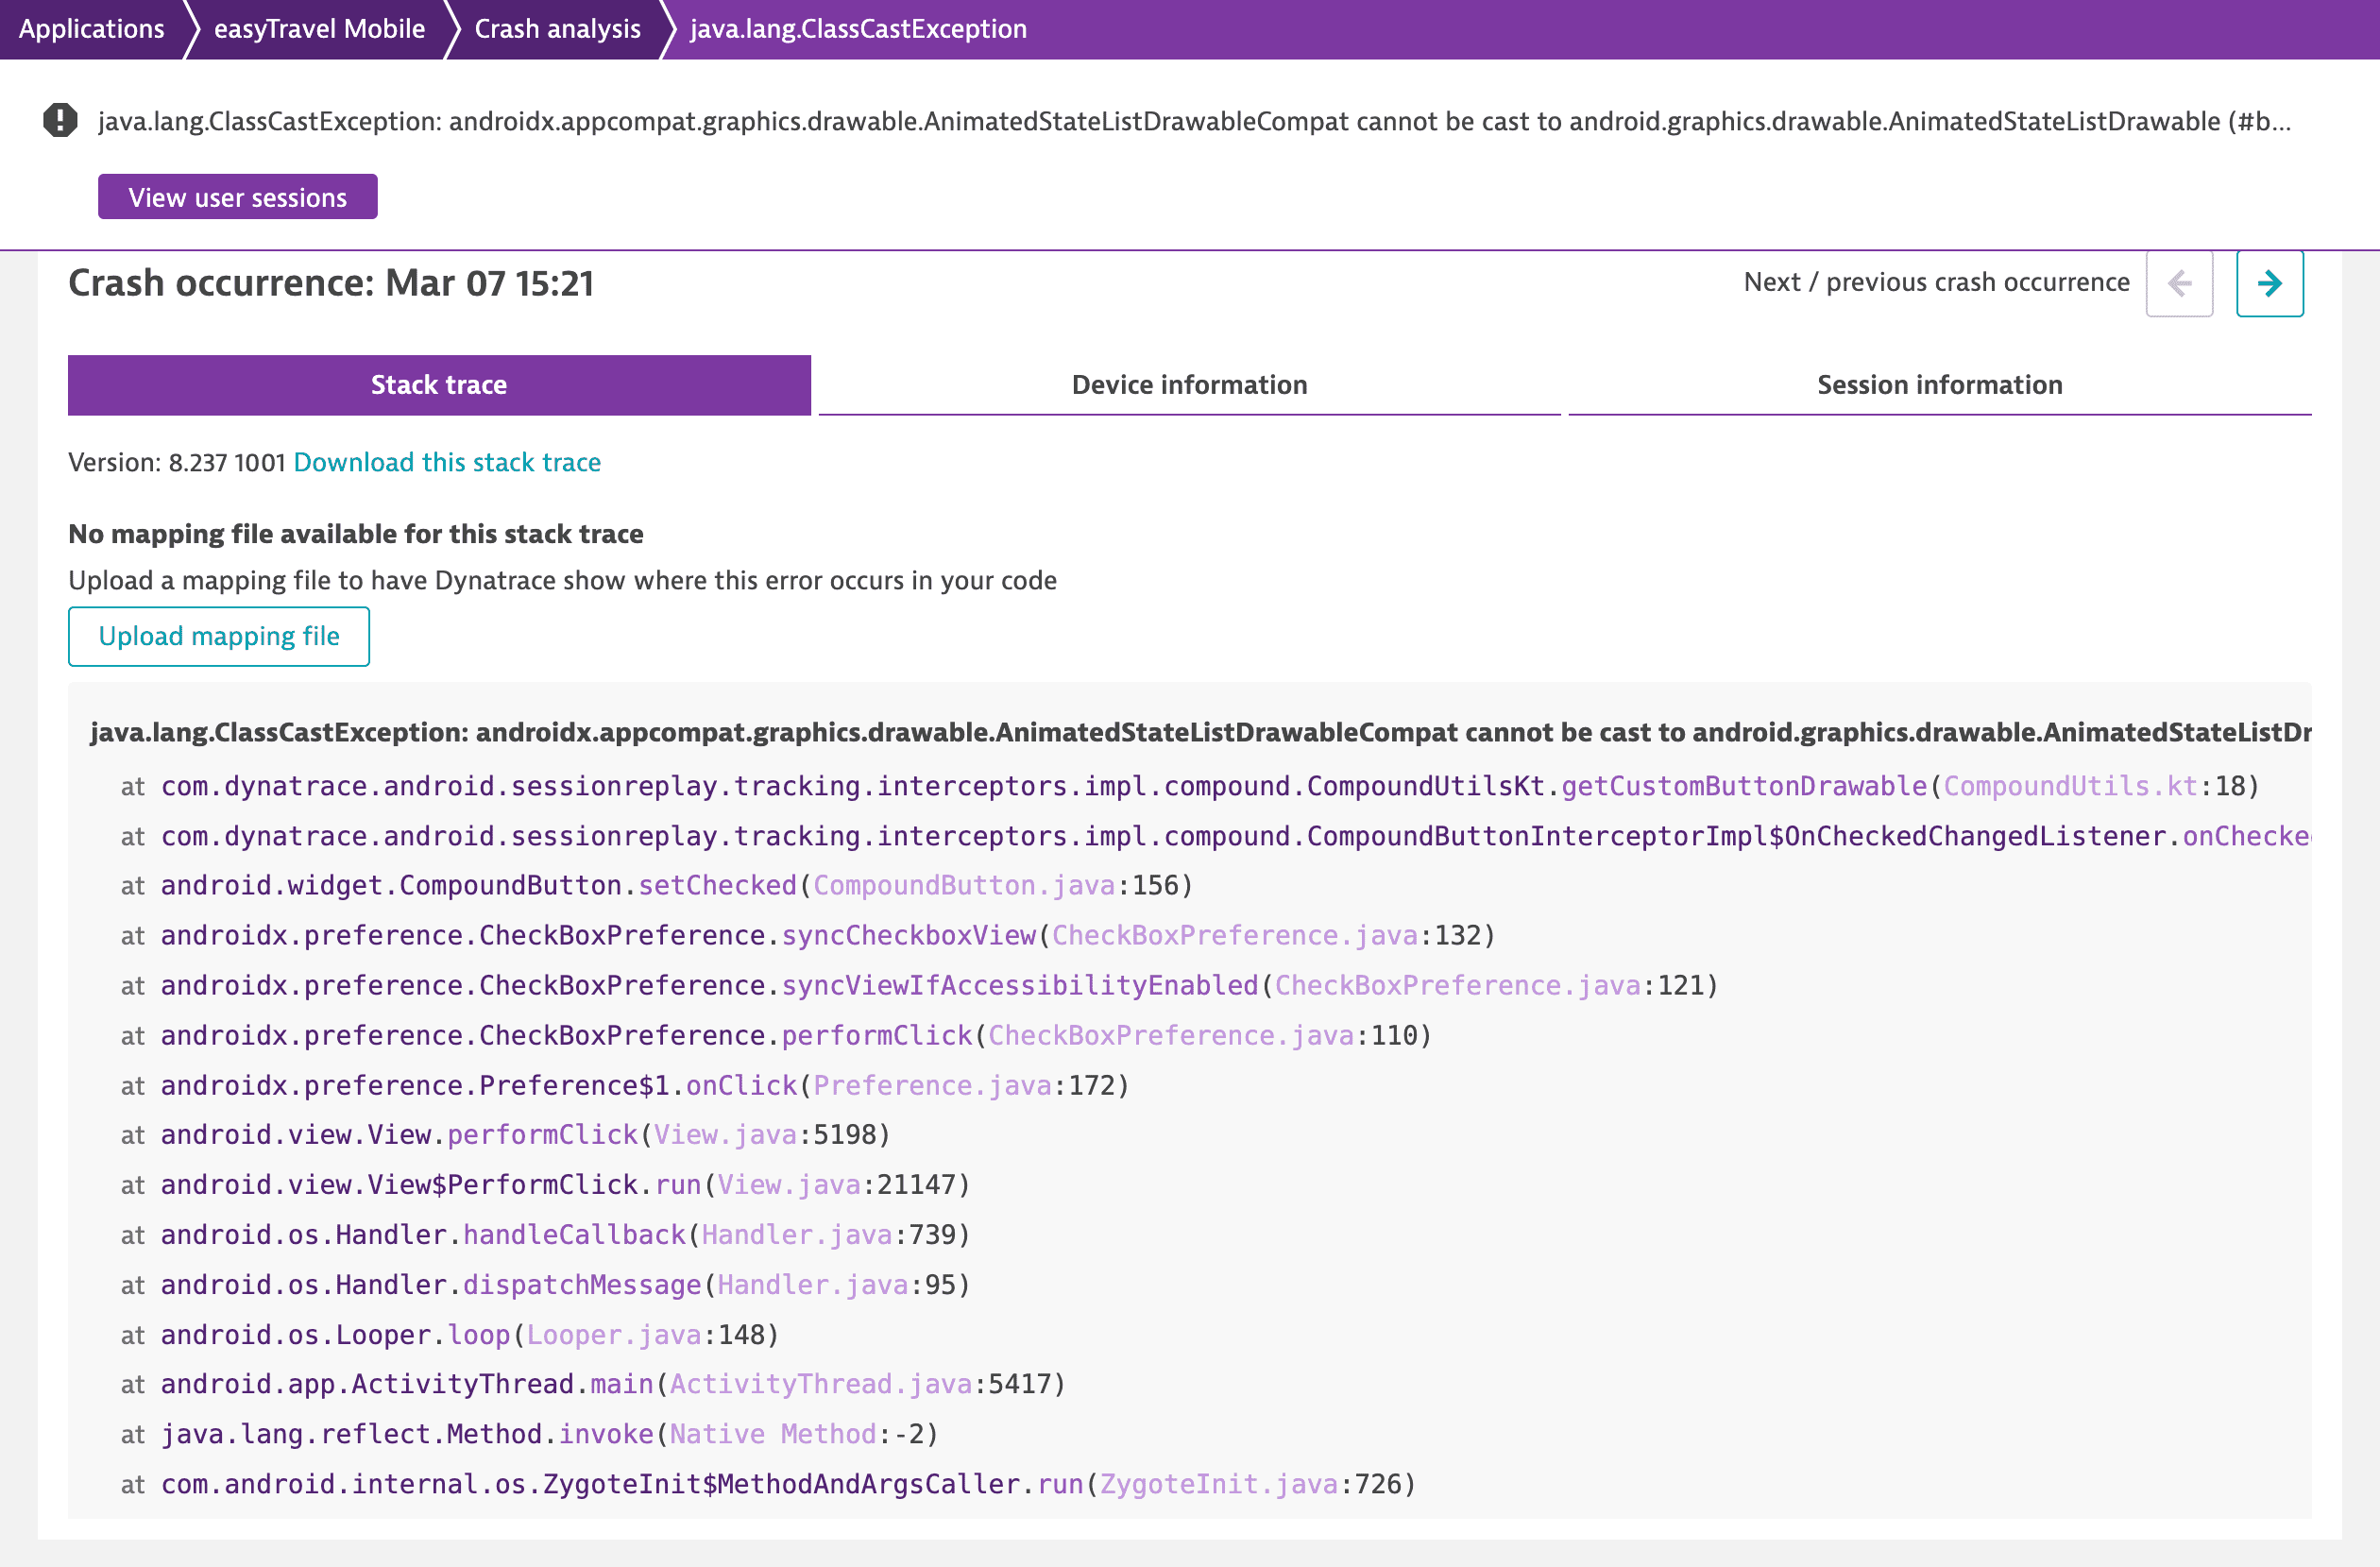
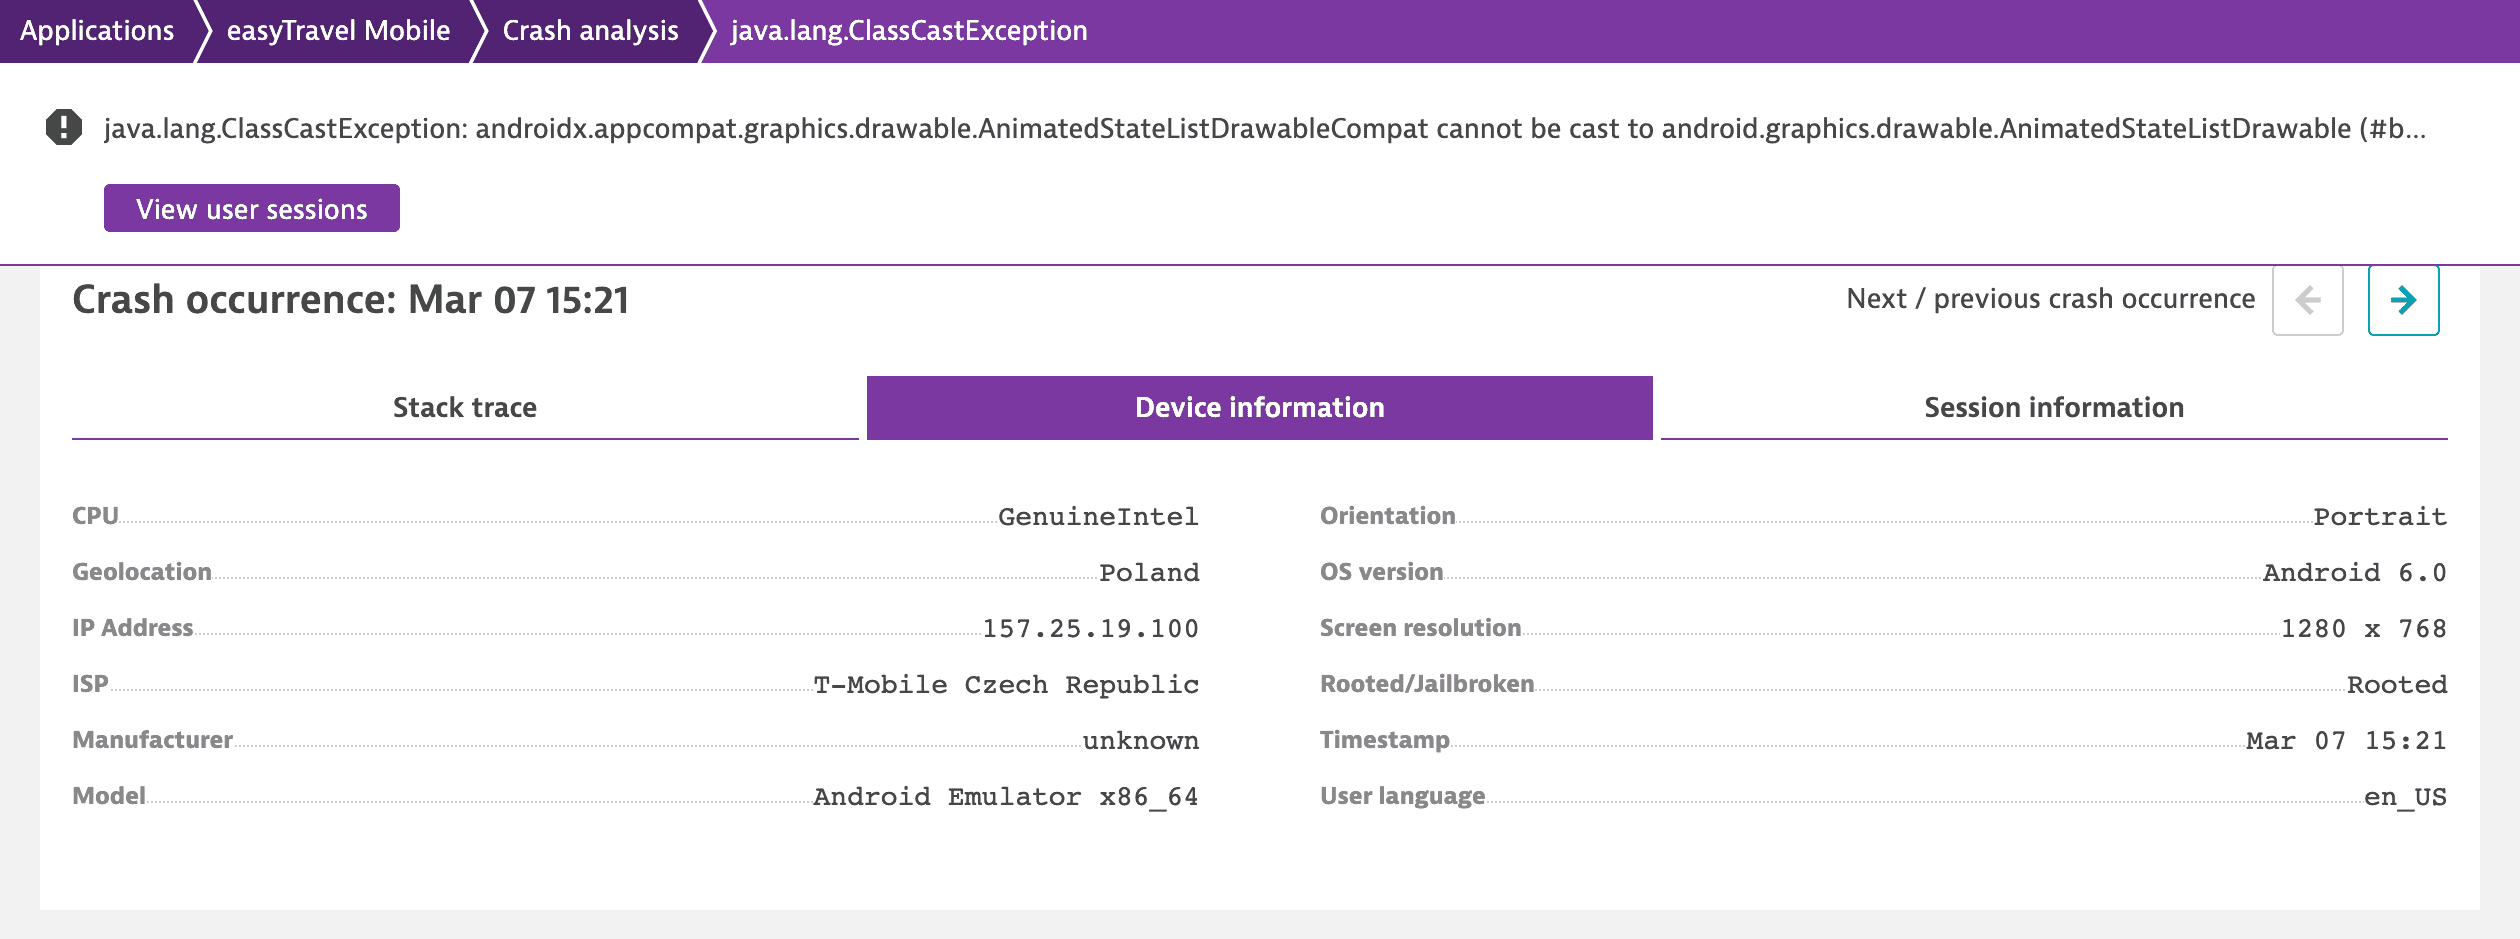
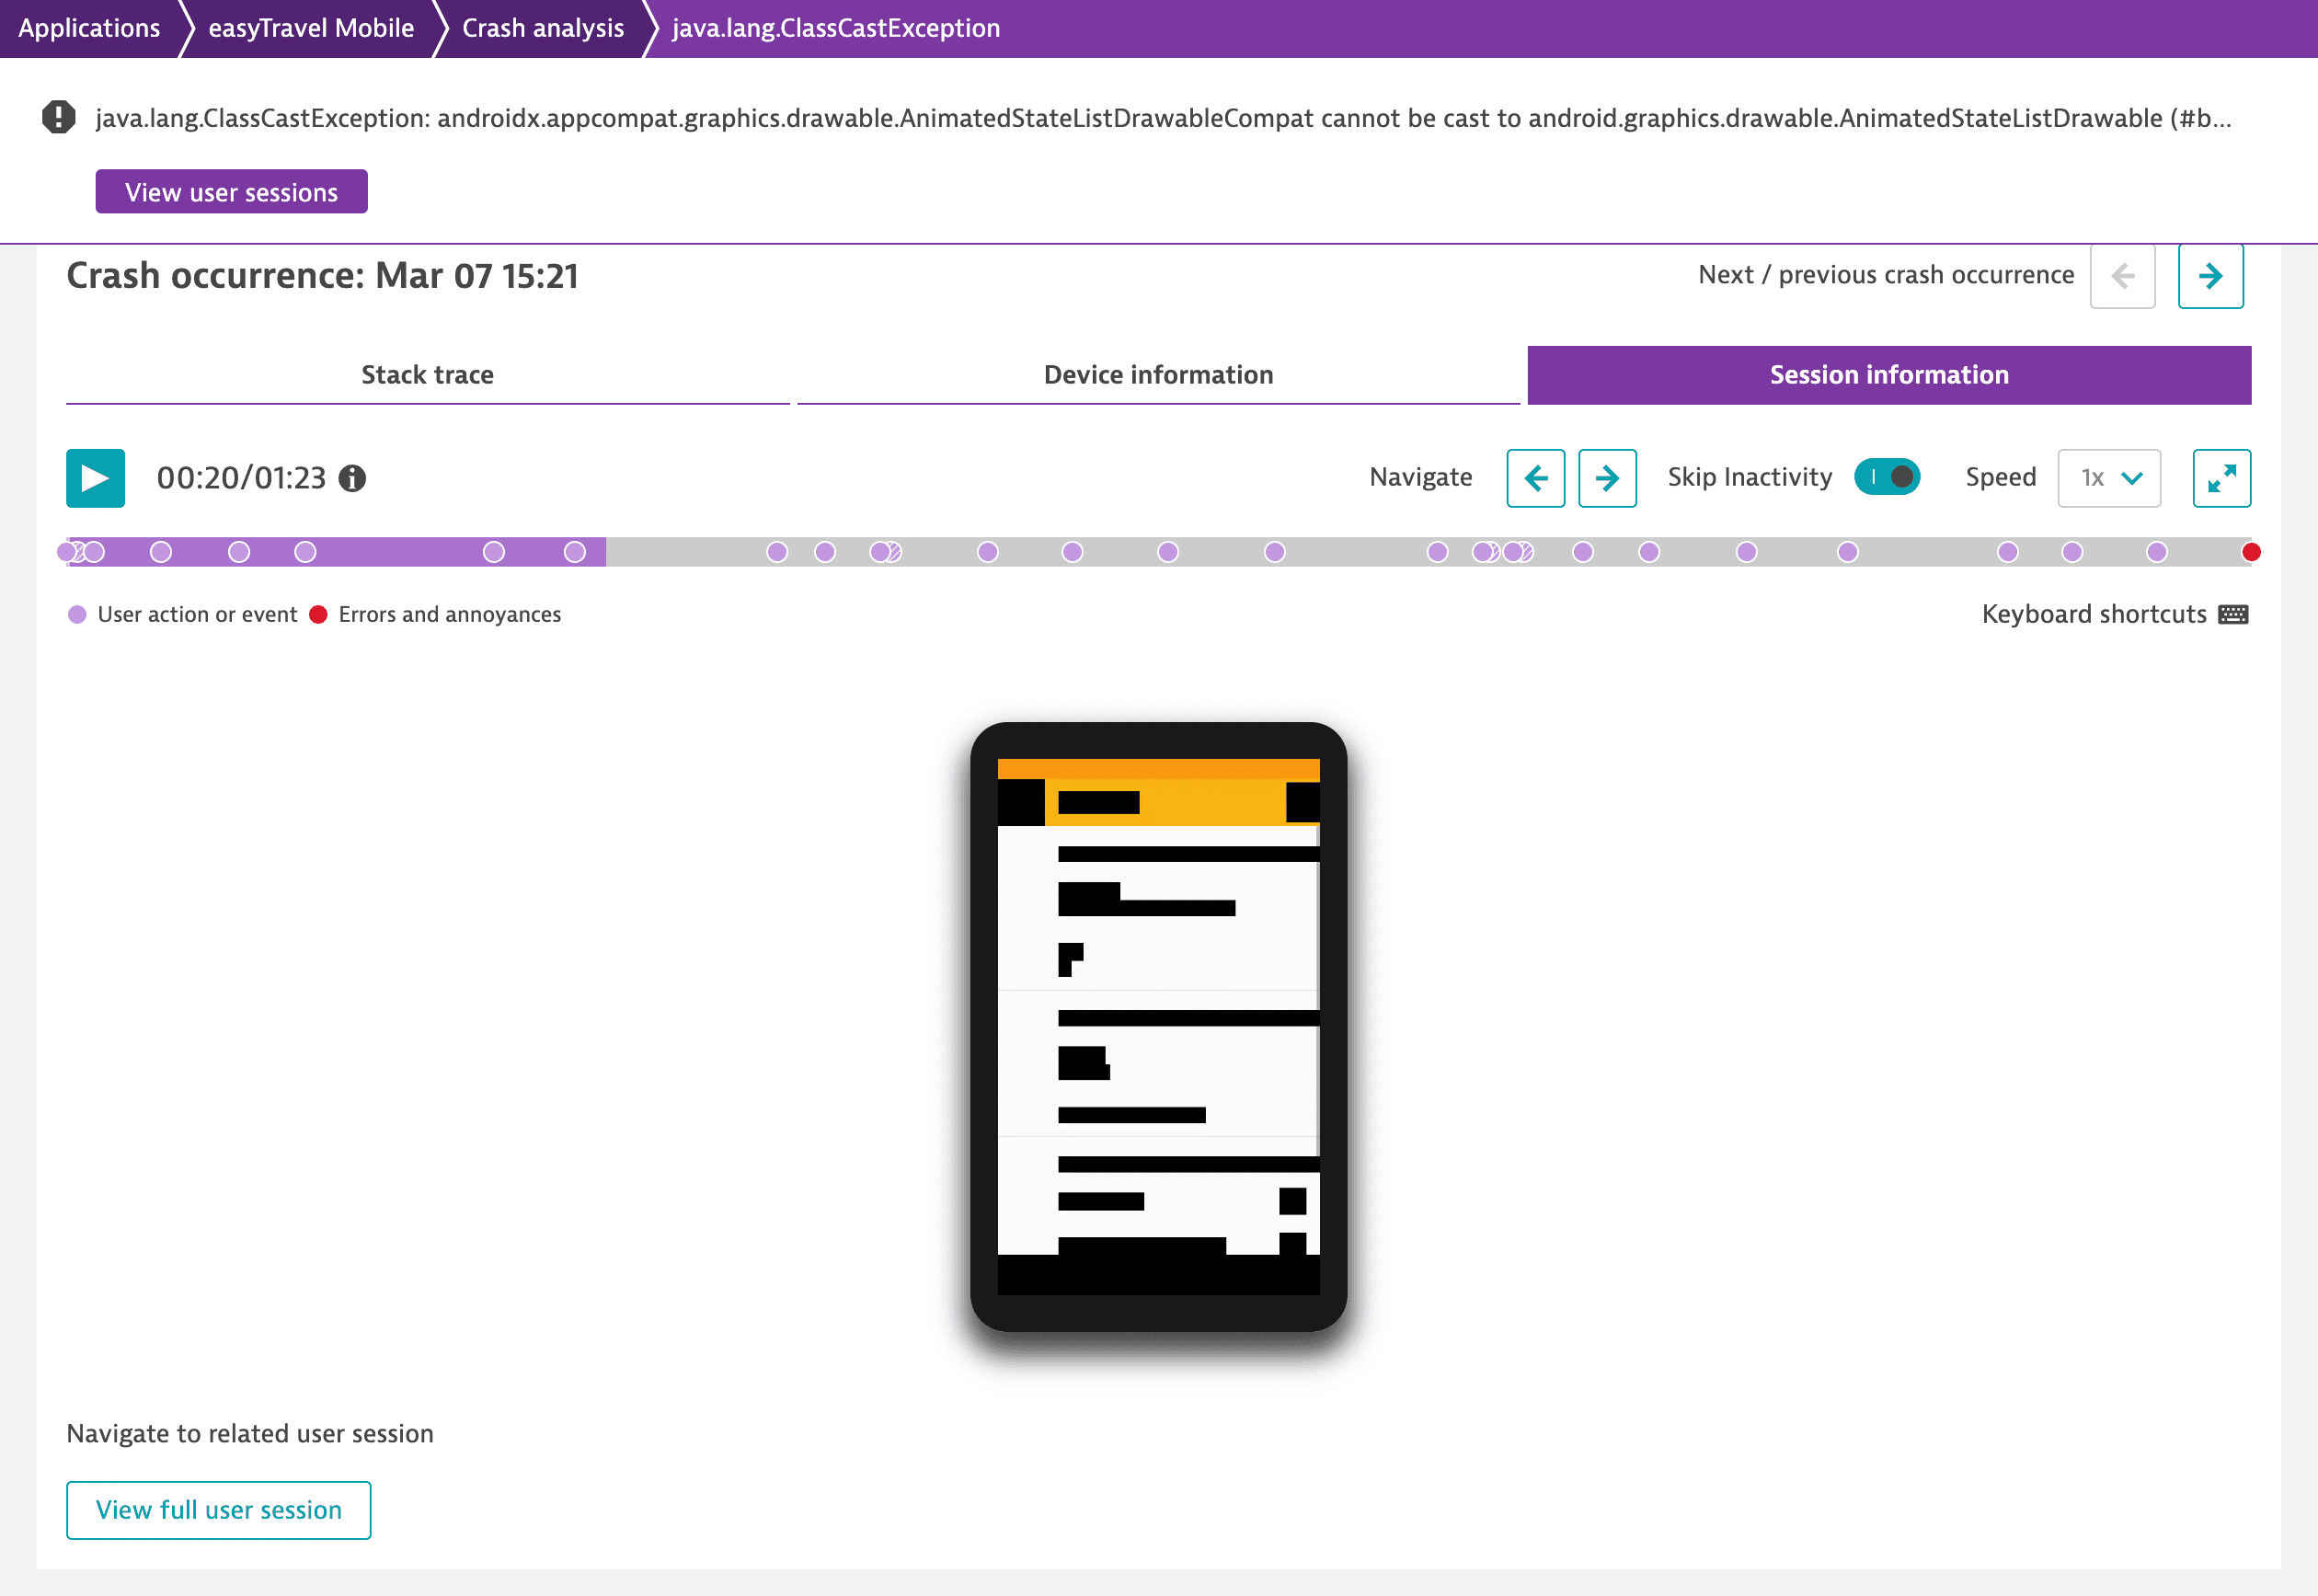
On the crash group details page, select Next / previous crash occurrence  to browse through all the crash occurrences. Choose the crash occurrence you're interested in, and then switch between the tabs to view the detailed information on the selected crash occurrence.
On the Stack trace tab, examine the stack trace or download the stack trace to share it with your team.
 Custom Applications