Analyze web requests for custom applications
- How-to guide
- 1-min read
- Published Jan 30, 2023
With Dynatrace client-side monitoring, you can assess the performance of first-party and third-party services in regard to availability, response time, and error occurrences.
To monitor your application's web requests
- Go to Frontend.
- Select the application that you want to analyze.
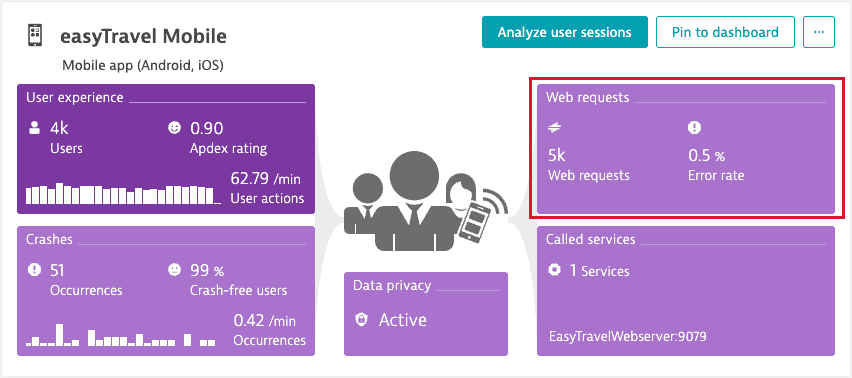
- From the application overview page, select the Web requests tile.
The Web requests tile shows the overall number of web requests and the web request error rate for the selected timeframe.

The information on the request rate, request duration, and top providers is available in the Web requests and Top providers sections.
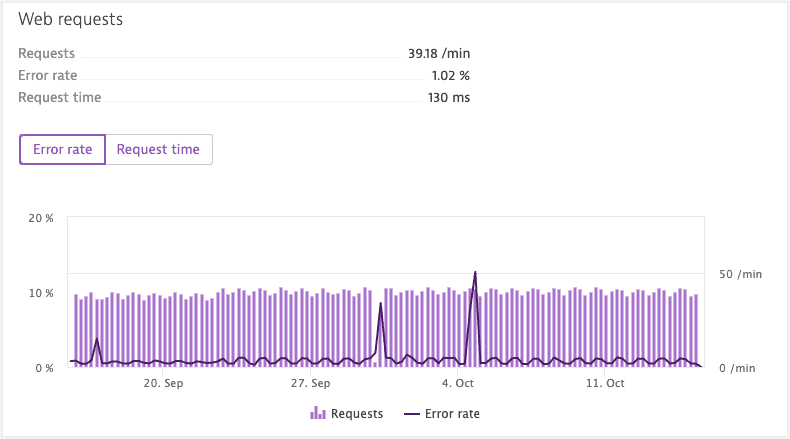
Web requests - Error rate
This chart compares the web request rate—the number of web requests per minute—to the error rate for the selected timeframe.

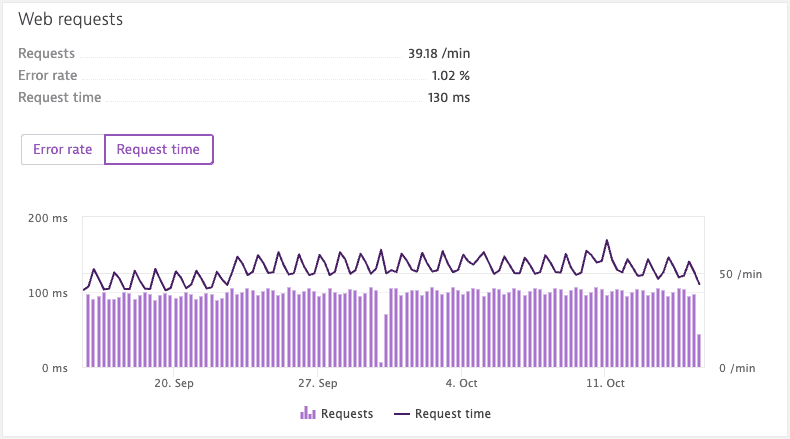
Web requests - Request time
This chart compares the web request rate to the request time for the selected timeframe.

Top providers
This list includes the HTTP domains containing the largest number of outgoing requests triggered by your application for the selected timeframe.

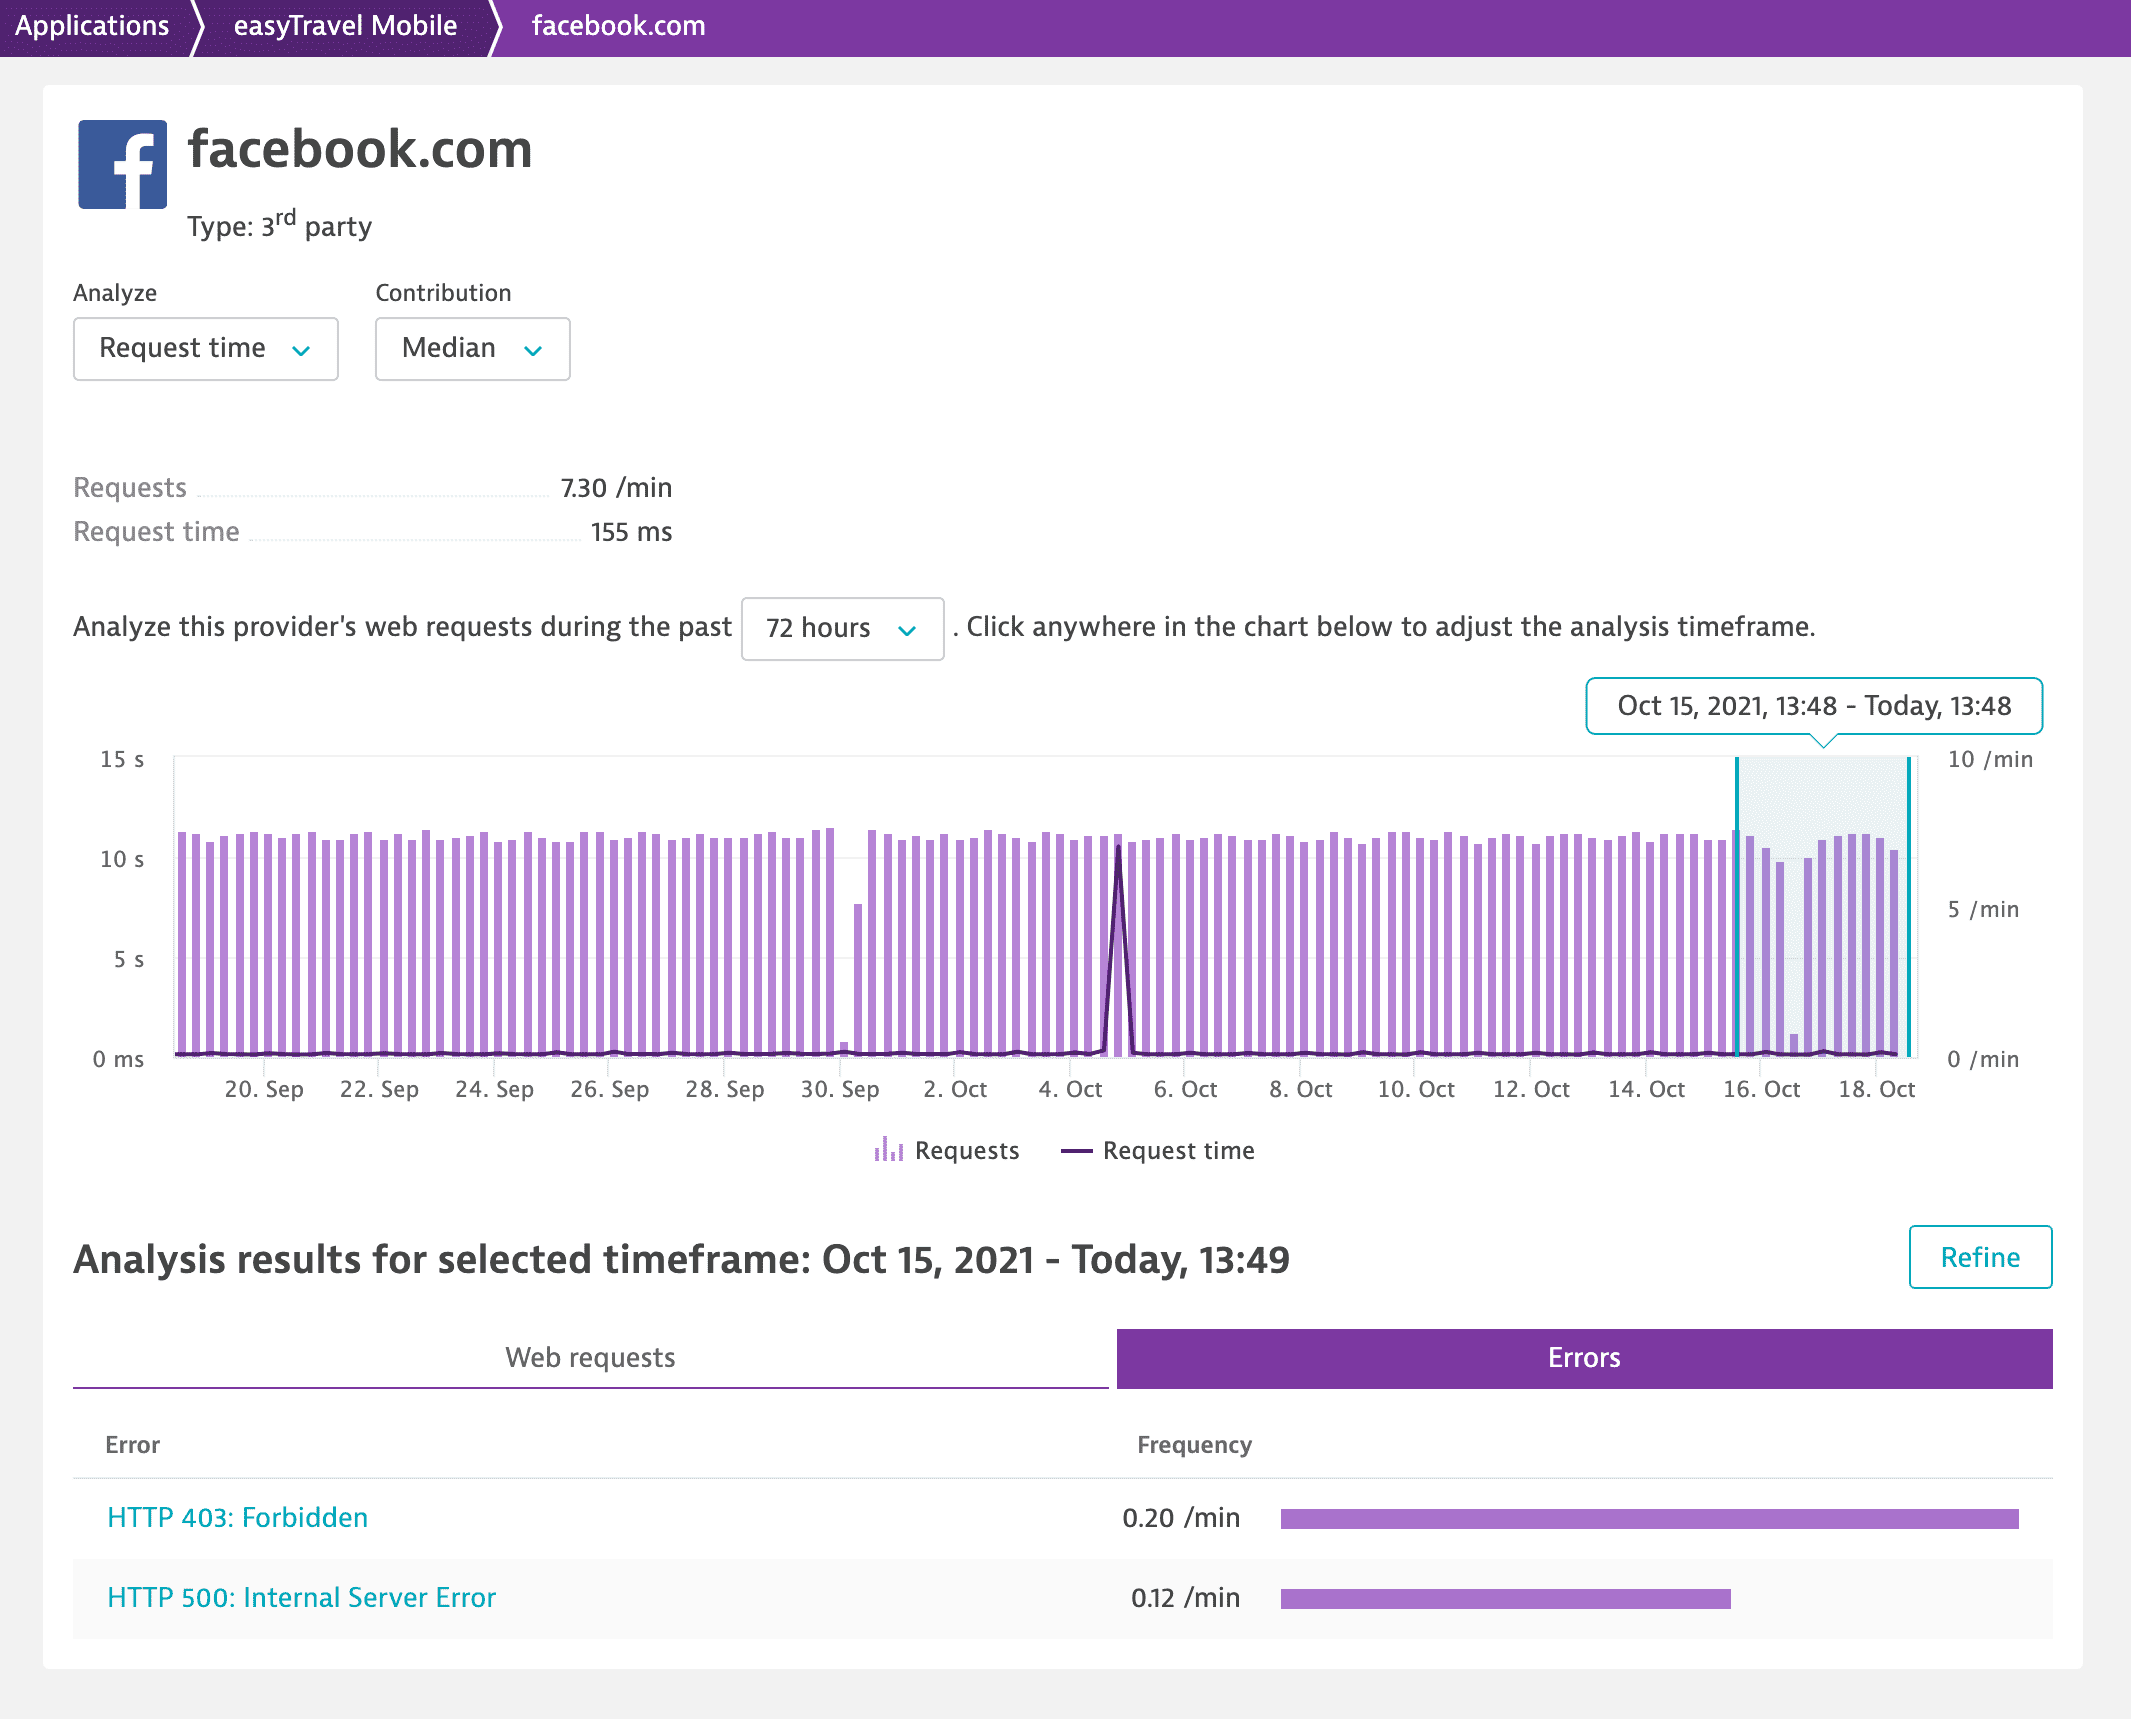
To view additional information on the provider, select it from the list. The provider details page opens where the data on the request rate, request time, and error rate for the selected provider is available.
- Go to the Web requests tab to explore the information on a particular web request, such as the request rate, duration, and size as well as error rate and some other details.
- Go to the Errors tab to view the list of web request errors for this provider. Select the error that you want to analyze to open the web request error details page.

 Custom Applications