Radware Alteon Load Balancer extension
- Latest Dynatrace
- Extension
Monitor your Radware Alteon Network Load Balancer devices and interfaces through SNMP.
Get started
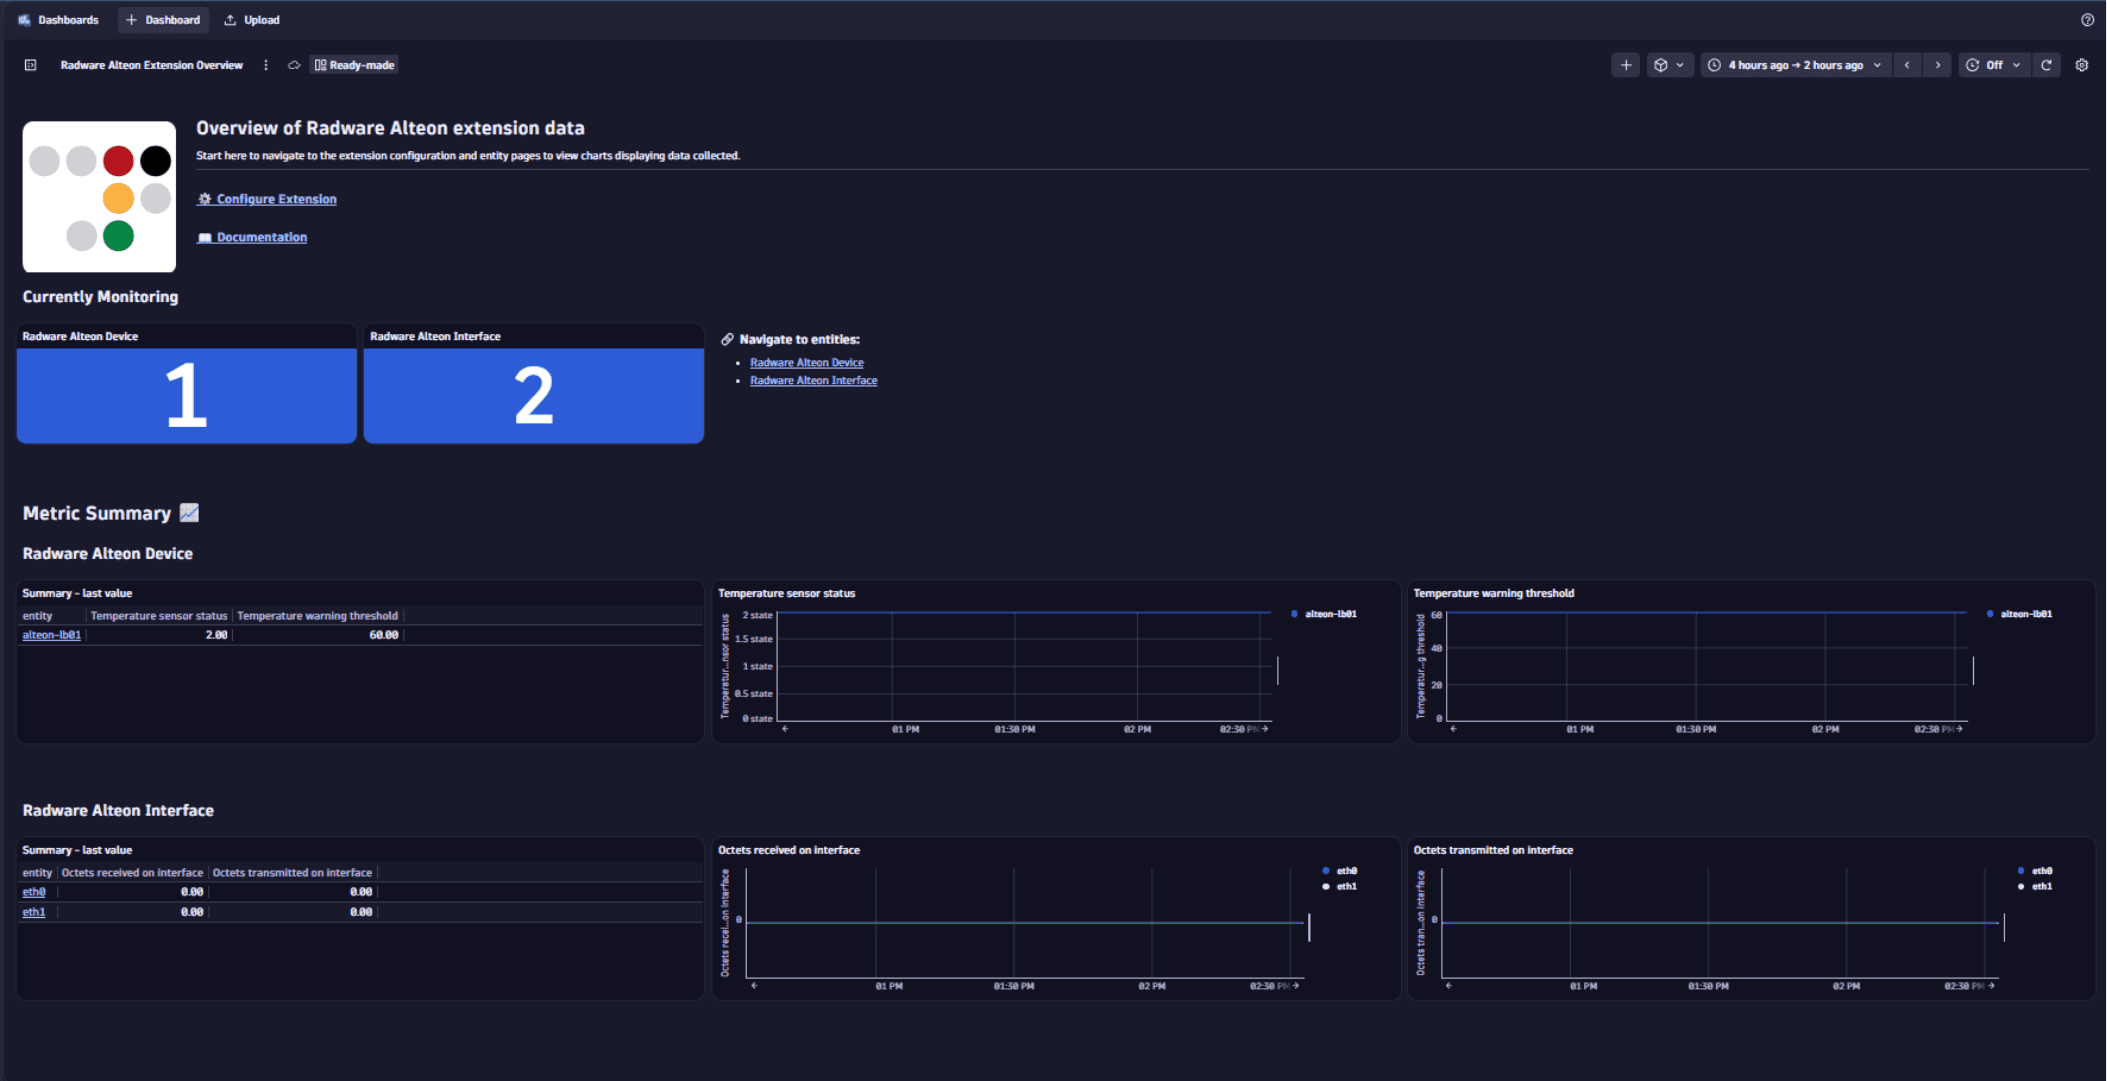
Overview
This extension collects infrastructure metrics to monitor the health and performance of your Radware Alteon Load Balancer devices.
Use cases
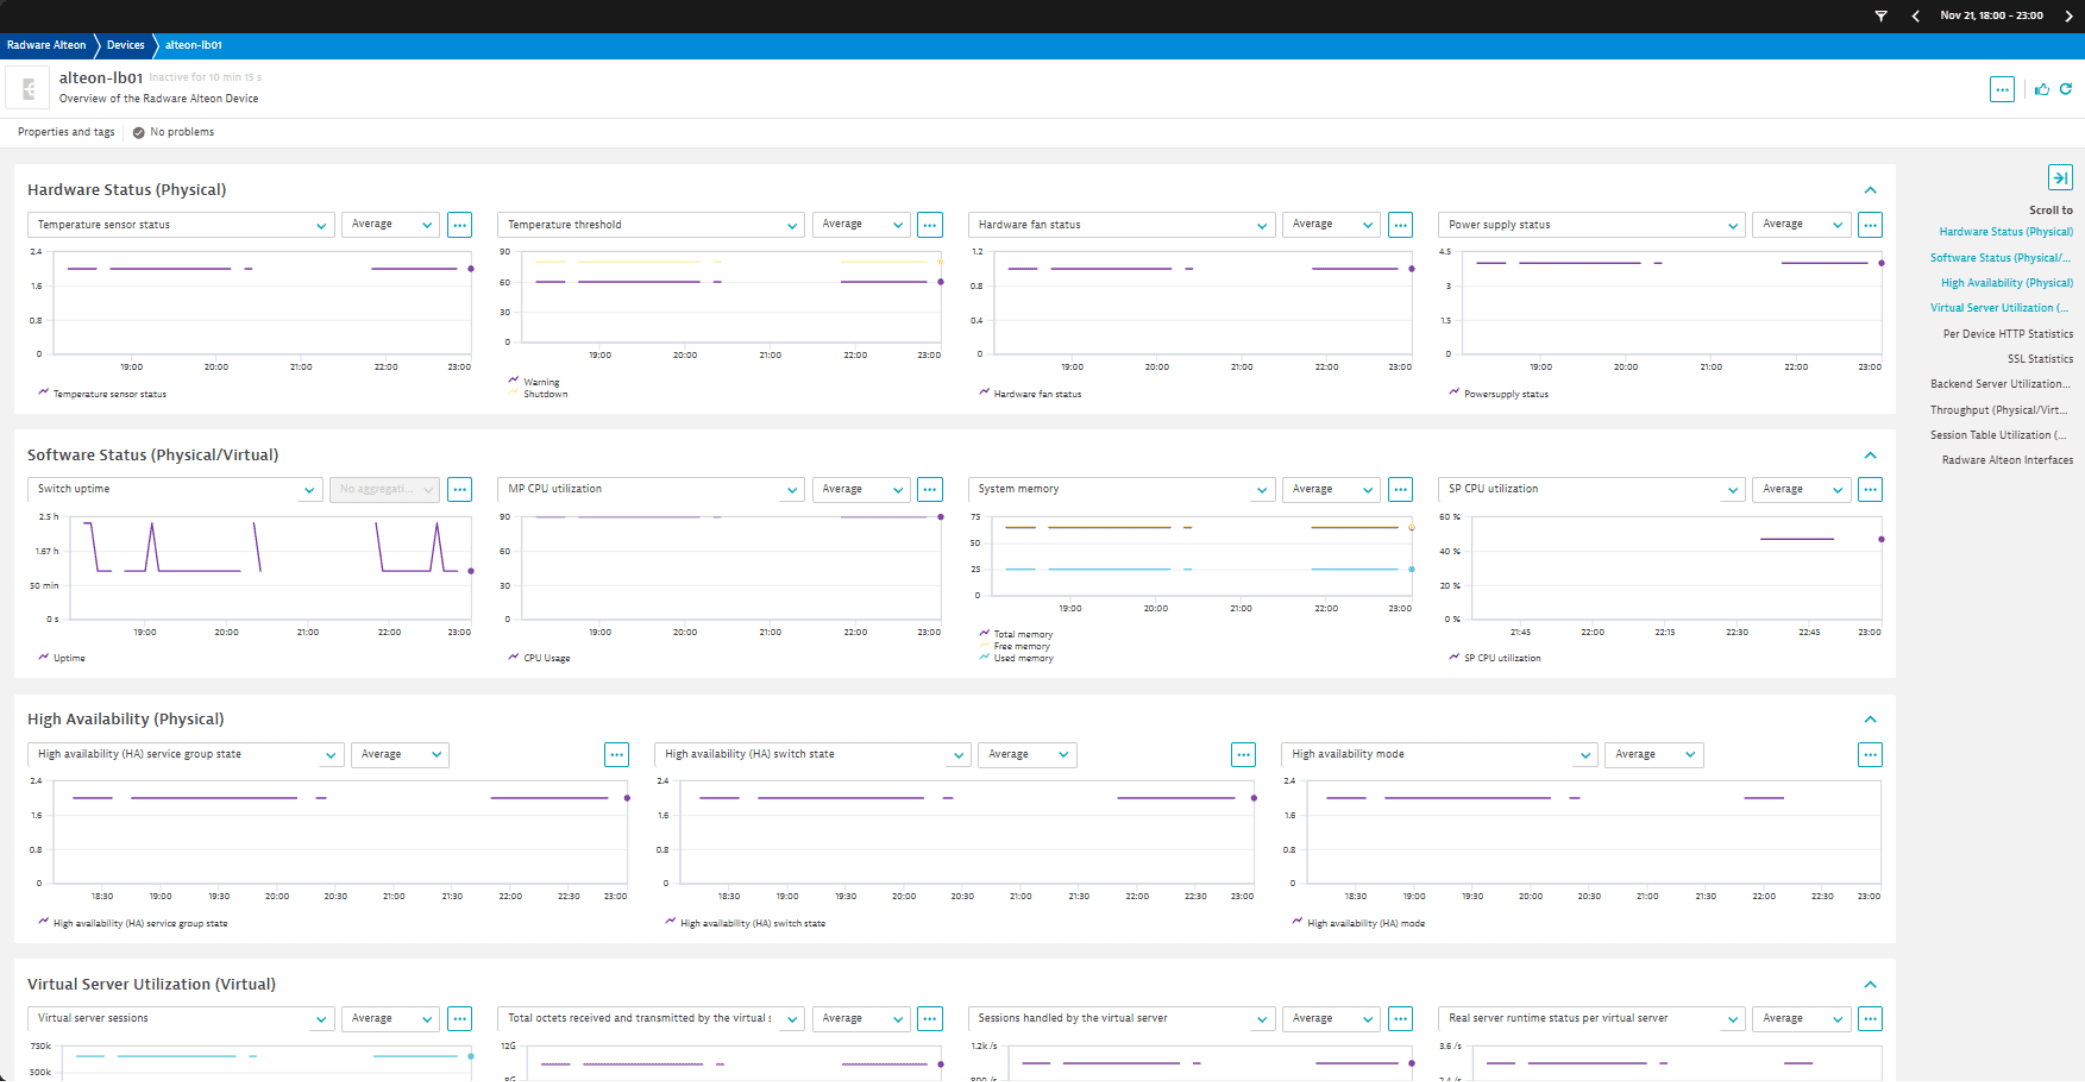
- Monitor important device metrics such as uptime, CPU and memory usage, as well as additional hardware status metrics for temperature, fan, and power supply.
- Monitor device interfaces to report metrics including bytes, discards, and inbound and outbound errors.
- Collect additional device data, including virtual server utilization, HTTP and SSL statistics, throughput, and session counts. The full list of monitored metrics can be viewed under Feature Sets.
- Detect device anomalies and avoid outages.
Compatibility information
- SNMP v2c or SNMP v3
- Dynatrace version 1.318+
Activation and setup
Activate the extension in your environment using the in-product Hub, provide the necessary device configuration, and you're all set up.
For details, see the SNMP extension data source documentation.
Details
The extension package contains:
- SNMP Data Source configuration
- Overview dashboard (Classic & Platform)
- Unified analysis screens
- Custom topology types extracted from metric dimensions:
- Radware Alteon Device
- Radware Alteon Interface
- SNMP MIB files used for monitoring:
- IF-MIB
- ALTEON-CHEETAH-LAYER4-MIB
- ALTEON-CHEETAH-NETWORK-MIB
- ALTEON-CHEETAH-SWITCH-MIB
- ALTEON-ROOT-MIB
Licensing and costs
There is no charge to use the extension. You are only charged for the data that the extension ingests.
The Radware Alteon Load Balancer extension ingests custom metrics, which consume Davis Data Units (DDUs) (Dynatrace classic license) or Metrics powered by Grail (DPS), according to your license model.
Calculations are based on the assumption that you monitor all metrics for every feature set every minute. Metric data points per minute per device:
60 + (8 * Interfaces)
Dynatrace Platform Subscription
In the Dynatrace Platform Subscription, metric ingestion consumes Metrics powered by Grail according to the number of ingested metric data points.
To calculate the approximate yearly consumption, apply the following calculation: <metric data points per minute> * 60 minutes * 24 hours * 365 days.
Dynatrace classic license
In the classic licensing model, metric ingestion consumes Davis Data Units (DDUs) at the rate of .001 DDUs per metric data point. Multiply the above formula for annual data points by .001 to estimate annual DDU usage.
The DDU cost above does not include any possible log events or custom events that are triggered by the extension. For more information, see DDU events.
Feature sets
Throughput_Physical_Virtual
| Metric name | Metric key | Description |
|---|---|---|
| Peak throughput of ports | radware_alteon.peakthroughputusage.count | Peak throughput of ports in bits per second. |
| Current throughput of ports | radware_alteon.curthroughputusage.count | Current throughput of ports in bits per second. |
Per_Device_HTTP_Statistics_Virtual
| Metric name | Metric key | Description |
|---|---|---|
| HTTP 2.0 connection count | radware_alteon.httpstatsumm.http20connection.count | HTTP 2.0 connection count. |
| HTTP 1.1 connection count | radware_alteon.httpstatsumm.http11connection.count | HTTP 1.1 connection count. |
| HTTP 1.0 connection count | radware_alteon.httpstatsumm.http10connection.count | HTTP 1.0 connection count. |
| HTTP 2.0 connection peak count | radware_alteon.httpstatsumm.http20connection.peak.count | HTTP 2.0 connection peak count. |
| HTTP 1.1 connection peak count | radware_alteon.httpstatsumm.http11connection.peak.count | HTTP 1.1 connection peak count. |
| HTTP 1.0 connection peak count | radware_alteon.httpstatsumm.http10connection.peak.count | HTTP 1.0 connection peak count. |
| HTTP 2.0 request count | radware_alteon.httpstatsumm.http20connection.request.count | HTTP 2.0 request count. |
| HTTP 1.1 request count | radware_alteon.httpstatsumm.http11connection.request.count | HTTP 1.1 request count. |
| HTTP 1.0 request count | radware_alteon.httpstatsumm.http10connection.request.count | HTTP 1.0 request count. |
| HTTP transactions per second | radware_alteon.httptranssumm.trans.rate | HTTP transactions per second. |
Virtual_Server_Utilization_Virtual
| Metric name | Metric key | Description |
|---|---|---|
| Virtual server current sessions | radware_alteon.slbstat.enh.vserver.currsessions | The number of sessions that are currently handled by the virtual server. |
| Virtual server total sessions | radware_alteon.slbstat.enh.vserver.totalsessions | The total number of sessions that are handled by the virtual server. |
| Virtual server highest sessions handled | radware_alteon.slbstat.enh.vserver.highestsessions | The highest number of sessions that have been handled by the virtual server. |
| Total octets received and transmitted by the virtual server | radware_alteon.slbstat.enh.vserver.hc.octets | The total octets received and transmitted by the virtual server. |
| Sessions handled by the virtual server | radware_alteon.slbstat.enh.vserver.sessions | Number of Sessions handled by the virtual server per second. |
| Real server runtime status per virtual server | radware_alteon.slbstat.enh.vserver.real.status | The runtime Real Server Status per Virtual service. (0)Up, (1)Down, (2)Admin-Down, (3)Warning, (4)Shutdown, (5)Error |
| Backend server concurrent connections for virtual service | radware_alteon.commng.enh.perservstats.servconn | The number of concurrent backend server connections for virtual service. |
| Virtual service client requests passed to AX | radware_alteon.commng.enh.perservstats.clireq | Number of client requests passed to AX for virtual service. |
| Virtual service security policy peak bandwidth (secPolPerServBwPeak) | radware_alteon.secpol.perserv.bw.peak | Virtual service security policy stats - Bandwidth peak value. |
| Virtual service security policy bandwidth ( secPolPerServBwCurVal) | radware_alteon.secpol.perserv.bw.curval | Virtual service security policy stats - Bandwidth current value. |
| Virtual service security policy PPS current (secPolPerServPPSCurVal) | radware_alteon.secpol.perserv.pps.curval | Virtual service security policy stats - PPS current value. |
| Virtual service security policy PPS peak (secPolPerServPPSPeak) | radware_alteon.secpol.perserv.pps.peak | Virtual service security policy stats - PPS peak value. |
| Virtual service security policy CPS current (secPolPerServCPSCurVal) | radware_alteon.secpol.perserv.cps.curval | Virtual service security policy stats - CPS current value. |
| Virtual service security policy CPS peak (secPolPerServCPSPeak) | radware_alteon.secpol.perserv.cps.peak | Virtual service security policy stats - CPS peak value. |
| Virtual service security policy latency current (secPolPerServLatencyCurVal) | radware_alteon.secpol.perserv.latency.curval | Virtual service security policy stats - latency current value. |
| Virtual service security policy latency peak (secPolPerServLatencyPeak) | radware_alteon.secpol.perserv.latency.peak | Virtual service security policy stats - latency peak value. |
Backend_Server_Utilization_Virtual
| Metric name | Metric key | Description |
|---|---|---|
| Real-server current sessions | radware_alteon.slbstat.enh.rserver.currsessions | Real-server current sessions. |
| Real-server total sessions | radware_alteon.slbstat.enh.rserver.totalsessions | Real-server total sessions. |
| Real-server highest sessions | radware_alteon.slbstat.enh.rserver.highestsessions | Real-server highest sessions. |
| Real-server total rx/tx octets | radware_alteon.slbstat.enh.rserver.hc.octets | Real-server total rx/tx octets. |
| Real server max concurrent connections | radware_alteon.slbcur.cfg.realserver.maxconns | The Maximum allowed number of concurrent connections per real server in the configuration. |
| SP current memory | radware_alteon.spmemusagestats.currentmemory | The current memory of SP in kilobytes. |
| Real-server group current sessions | radware_alteon.slbstat.enh.group.currsessions | The number of sessions that are currently handled by the real server group. |
| Real-server group total sessions | radware_alteon.slbstat.enh.group.totalsessions | The total number of sessions that have been handled by the real server group. |
| Real-server group highest sessions | radware_alteon.slbstat.enh.group.highestsessions | The highest sessions that have been handled by the real server group. |
Session_Table_Utilization_Virtual
| Metric name | Metric key | Description |
|---|---|---|
| Session table maximum entries | radware_alteon.slbstat.maint.maximumsessions | The maximum number entries in the session table. |
| Ipv6 session count | radware_alteon.slbstat.maint.ip6currsessions.count | The number of sessions for ipv6. |
| Curent sessions in session table | radware_alteon.slbstat.maint.curbindings | The current number of sessions in the session table. |
Software_Status_SP
| Metric name | Metric key | Description |
|---|---|---|
| SP CPU utilization | com.dynatrace.extension.network_device.sp.cpu_usage | SP CPU utilization |
default
| Metric name | Metric key | Description |
|---|---|---|
| — | com.dynatrace.extension.network_device.sysuptime | — |
| — | com.dynatrace.extension.network_device.cpu_usage | — |
| — | com.dynatrace.extension.network_device.memory_total | — |
| — | com.dynatrace.extension.network_device.memory_free | — |
| — | com.dynatrace.extension.network_device.memory_used | — |
| — | com.dynatrace.extension.network_device.if.status | — |
High_Availability_Physical
| Metric name | Metric key | Description |
|---|---|---|
| High availability (HA) service group state | radware_alteon.ha.group.state | High availability (HA) service group state |
| High availability (HA) mode | radware_alteon.ha.curcfg.mode | High availability (HA) mode |
Hardware_Status_Physical
| Metric name | Metric key | Description |
|---|---|---|
| Temperature sensor status | radware_alteon.temperature.status | The status of the temperature sensor. ok(1), exceed(2) |
| Temperature warning threshold | radware_alteon.temperature.threshold.warning | The temperature warning threshold |
| Temperature shutdown threshold | radware_alteon.temperature.threshold.shutdown | The temperature shutdown threshold |
| Hardware fan status | radware_alteon.fan.status | Hardware fan status. ok(1), fail(2), unplug(3) |
| Powersupply status | radware_alteon.powersupply.status | Powersupply status. singlePowerSupplyOk(1), firstPowerSupplyFailed(2), secondPowerSupplyFailed(3), doublePowerSupplyOk(4), unknownPowerSupplyFailed(5) |
SSL_Statistics_Virtual
| Metric name | Metric key | Description |
|---|---|---|
| TCP sessions using SSL service | radware_alteon.sslslbstat.cursessions | The current number of different TCP sessions using SSL service. |
| Total TCP sessions using SSL service | radware_alteon.sslslbstat.totalsessions.count | The total number of different TCP sessions using SSL service. |
| TCP sessions using SSL service high water mark | radware_alteon.sslslbstat.highestsessions.count | The high water mark of current sessions of different TCP sessions using SSL service. |
| SSL handshakes between clients and AAS per second | radware_alteon.ssloff.newhandShake | New SSL handshakes between clients and AAS per second. |
| New SSL handshakes between Clients and AAS per second (sslOffPerEnhServNewhandShake) | radware_alteon.ssloffper.enh.serv.newhandshake | Number of New SSL handshakes between Clients and AAS per second for this virtual service. |
| Number of expired SSL certificates per second for virtual service (sslOffPerEnhServExpiredCertificates) | radware_alteon.ssloffper.enh.serv.expiredcertificates | Number of expired SSL certificates per second for virtual service. |
Interfaces
| Metric name | Metric key | Description |
|---|---|---|
| — | com.dynatrace.extension.network_device.if.bytes_in.count | — |
| — | com.dynatrace.extension.network_device.if.bytes_out.count | — |
| — | com.dynatrace.extension.network_device.if.in.discards.count | — |
| — | com.dynatrace.extension.network_device.if.out.discards.count | — |
| — | com.dynatrace.extension.network_device.if.in.errors.count | — |
| — | com.dynatrace.extension.network_device.if.out.errors.count | — |
Advanced interfaces
| Metric name | Metric key | Description |
|---|---|---|
| — | com.dynatrace.extension.network_device.if.lastchange | — |
