Mulesoft Cloudhub (Extension v2) extension
- Latest Dynatrace
- Extension
Collect organization, environment, application, endpoint, APIs, and workers metrics for your Mulesoft Cloudhub apps.
Get started
Requirements
Monitoring needs to be enabled for Cloudhub 1.0 apps. For details, see Setting Up Monitoring for CloudHub Deployments.
Mulesoft configuration
-
In your Mulesoft account, under Access Management, create a Connected App.
-
Add the following scopes to the app:
- Monitoring Viewer: You need to include the root organization (business unit) in this scope.
- View Organization
- View Environment
- Read Applications
- View APIs Configuration
- Read Runtime Fabrics
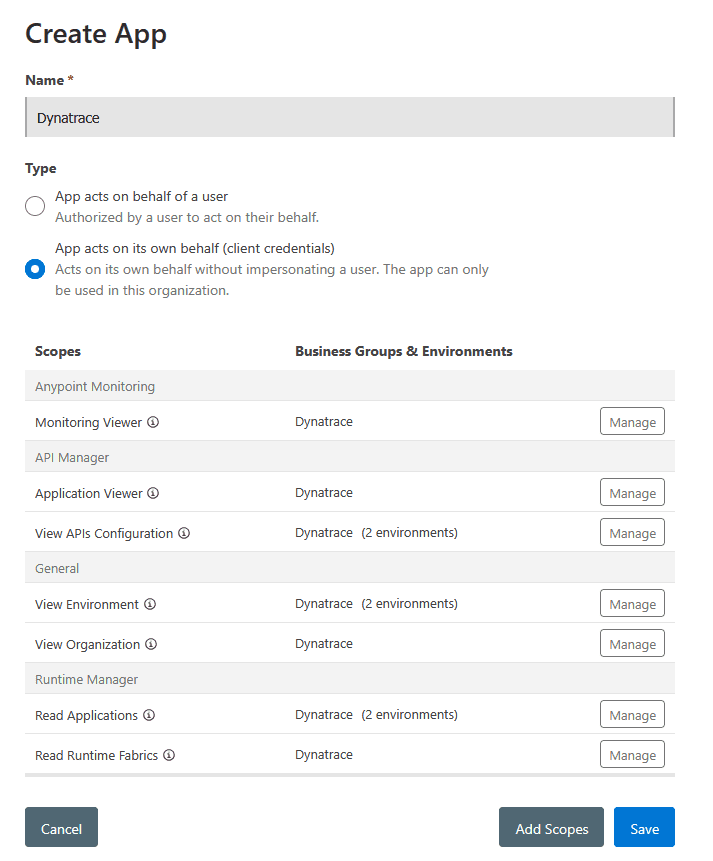 Mulesoft extension v2 Connected Apps
Dynatrace configuration
-
In Extensions, select Mulesoft Cloudhub.
-
Add a monitoring configuration:
- Mulesoft Domain URL
- This is the URL to access your Mulesoft account; in most cases this is
https://anypoint.mulesoft.com. - For Europe, this is
https://eu1.anypoint.mulesoft.com. - For Government Cloud, this is
https://gov.anypoint.mulesoft.com.
- This is the URL to access your Mulesoft account; in most cases this is
- Mulesoft Client ID
- From the connected app you created, copy the
Client ID.
- From the connected app you created, copy the
- Mulesoft Client Secret
- From the connected app you created, copy the
Client Secret.
- From the connected app you created, copy the
- Mulesoft Organization/Business Group ID
- Optional, if empty the default Organization ID will be used.
- You can get a list of all organizations from the Anypoint Platform.
- Frequency
- How often we should collect data.
- Environments filter
- Optionally, you can filter to monitor certain environments and applications.
- These filters behave as a
containsfilter. - You can have multiple filters for a single monitoring configuration.
- Proxy
- If you need to use a proxy to access the Mulesoft API, you can configure it here.
Details
V2 Apps Support
Starting from version 2.0.0, the extension attempts to collect data from v2 applications.
The following applies:
- The API endpoint used is
/amc/application-manager/api/v2/organizations/{org_id}/environments/{environment_id}/deployments/{deployment_id} - To keep topology data relevant, some metrics from v1 apps are translated into v2 apps:
cloudhub.app.workers- obtained fromtarget -> replicas.cloudhub.app.remaining_workers- the number ofreplicas.
Metrics
| Metric | Description |
|---|---|
vCores Production | The number of vCores active on the organization for Production environments |
vCores Sandbox | The number of vCores active on the organization for Sandbox environments |
vCores Design | The number of vCores active on the organization for Design environments |
VPCs | The number of VPCs active on the organization |
VPNs | The number of VPNs active on the organization |
Gateways | The number of Gateways active on the organization |
Applications | The number of Applications on the organization |
Started Applications | The number of Applications that are started on the organization |
Workers | The number of Workers for an application |
Remaining Workers | The number of Workers remaining for an application |
Requests | The number of requests for an application |
Errors | The number of errors for an application |
Response Time | The average response time for an application |
JVM Heap Used | The amount of JVM Heap used for the worker |
JVM Heap Total | The total amount of JVM Heap for the worker |
Thread Count | The number of threads for the worker |
CPU | The CPU usage for the worker |
Load Average | The load average for the worker |
Available Processors | The number of available processors for the worker |
Requests (Endpoint) | Per endpoint and response type |
Response Time (Endpoint) | Per endpoint and response type |
Outbound Response Time | Per endpoint and response type |
Outbound Requests | Per endpoint and response type |
API Requests | Per API, response_code |
API Request Size | Per API, response_code |
API Response Size | Per API, response_code |
API Response Time | Per API, response_code |
API Policy Violations | Per API, policy |
API Requests by Location | Per API and Location |
Licensing and costs
There is no charge to use the extension. You are only charged for the data that the extension ingests.
The Mulesoft Cloudhub (Extension v2) extension ingests custom metrics, which consume Davis Data Units (DDUs) (Dynatrace classic license) or Metrics powered by Grail (DPS), according to your license model.
The approximate number of metric data points per minute is:
8 + (7 * <applications>) + (6 * <workers>) + (6 * <apis>)
For example, monitoring 25 applications with three workers per application and 10 APIs gives 8 + (7 * 25) + (6 * 75) + (6 * 10) = 693 metric data points per minute.
Dynatrace Platform Subscription
In the Dynatrace Platform Subscription, metric ingestion consumes Metrics powered by Grail according to the number of ingested metric data points.
To calculate the approximate yearly consumption, apply the following calculation: <metric data points per minute> * 60 minutes * 24 hours * 365 days.
For the example above: 693 * 60 * 24 * 365 = 364,240,800 metric data points per year.
Dynatrace classic license
In the classic licensing model, metric ingestion consumes Davis Data Units (DDUs) at the rate of .001 DDUs per metric data point. Multiply the above formula for annual data points by .001 to estimate annual DDU usage.
For the example above: 693 * 60 * 24 * 365 * 0.001 = 364,240.8 DDUs per year.
The DDU cost above does not include any possible log events or custom events that are triggered by the extension. For more information, see DDU events.
FAQ
Does the extension use unsupported Mulesoft APIs?
Yes, the extension uses the Mulesoft dashboard APIs, which are not public and documented.
Feature sets
When activating your extension using a monitoring configuration, you can limit monitoring to one of the feature sets. To work properly, the extension has to collect at least one metric after the activation.
In highly segmented networks, feature sets can reflect the segments of your environment. Then, when you create a monitoring configuration, you can select a feature set and a corresponding ActiveGate group that can connect to this particular segment.
All metrics that aren't categorized into any feature set are considered to be the default and are always reported.
A metric inherits the feature set of a subgroup, which in turn inherits the feature set of a group. Also, the feature set defined on the metric level overrides the feature set defined on the subgroup level, which in turn overrides the feature set defined on the group level.
