Cisco SD-WAN extension
- Latest Dynatrace
- Extension
Monitor Cisco SD-WAN overlay performance with device, site, tunnel, and network health metrics collected via the vManage REST API.
Get started
Overview
The Cisco SD-WAN extension uses the Cisco Catalyst SD-WAN Manager API to collect performance metrics for a Cisco SD-WAN fabric managed by one or multiple Cisco SD-WAN Managers (also known as vManage).
Use cases
- Monitor your entire network infrastructure with Dynatrace
- Gain insights into your Cisco Catalyst SD-WAN infrastructure
- Extend Dynatrace visibility into Cisco SD-WAN fabric performance
Requirements
- You need access to the Cisco SD-WAN Manager (vManage) API.
- You need network connectivity between the ActiveGate where you deploy the extension and the vManage systems (vManage virtual IP (VIP) or individual vManage nodes).
Compatibility information
Cisco vManage API version 20.15 and above (tested on 20.15; Cisco documented no breaking changes in the used APIs up to version 20.18).
This integration was implemented and tested on vManage version 20.15. You can expect it to be compatible with version 20.15 and later. Compatibility with earlier versions is not guaranteed, although the extension may function with some earlier versions.
Activation and setup
Cisco SD-WAN Manager configuration
For the Dynatrace integration, we recommend creating a dedicated user with read-only privileges.
-
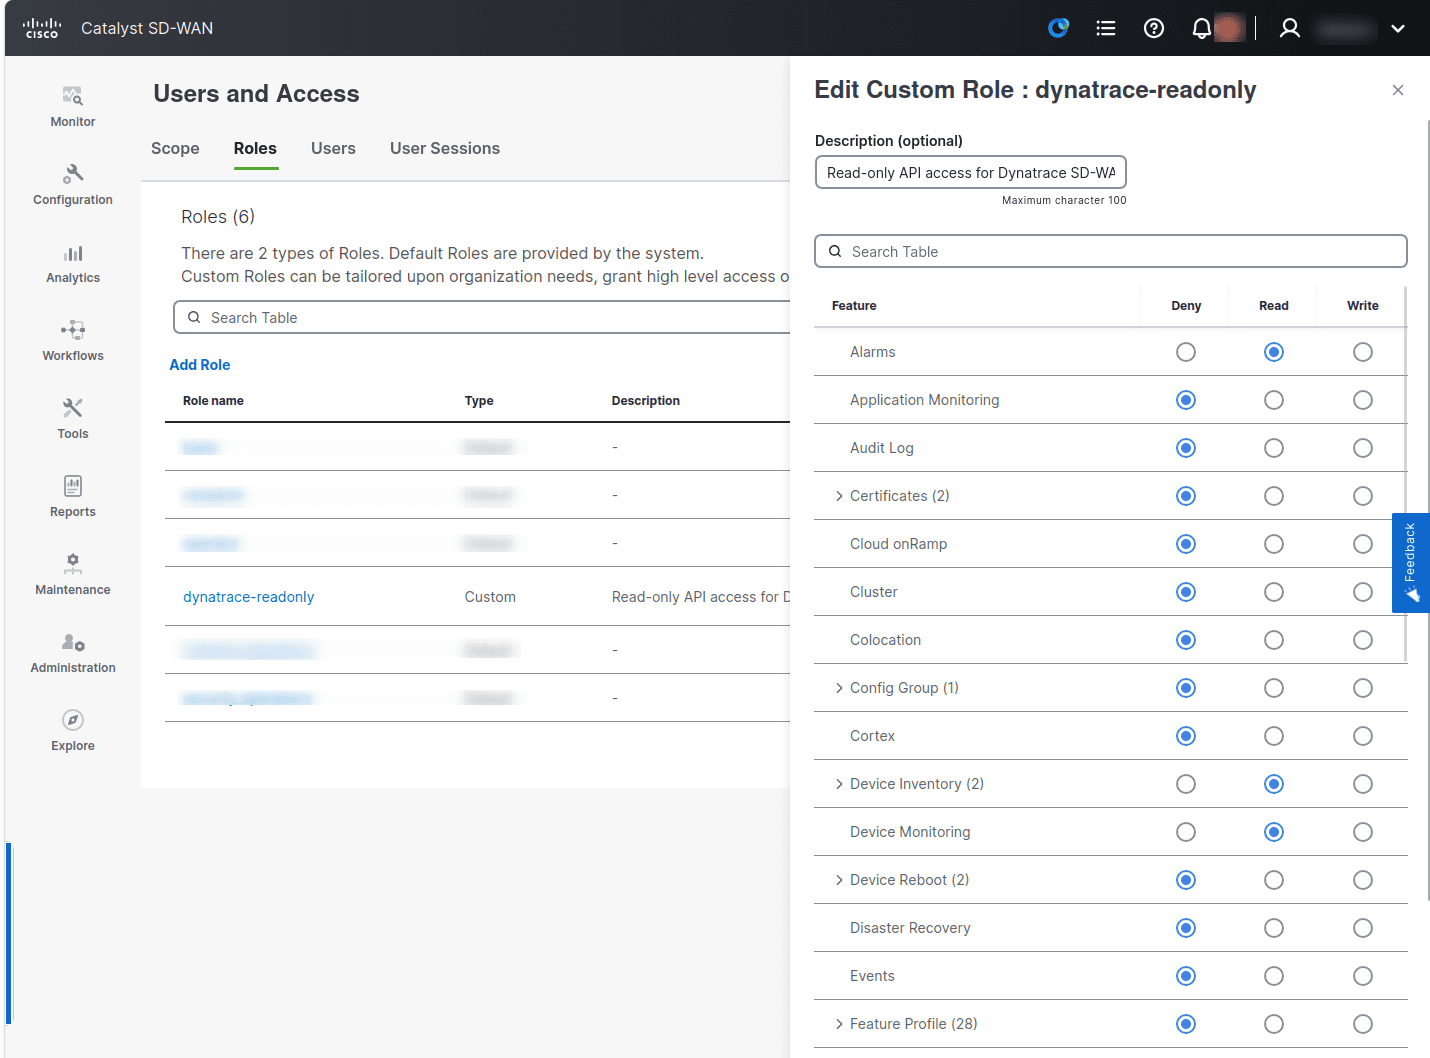
optional Create a dedicated role (for example,
dynatrace-readonly) with read-only privileges.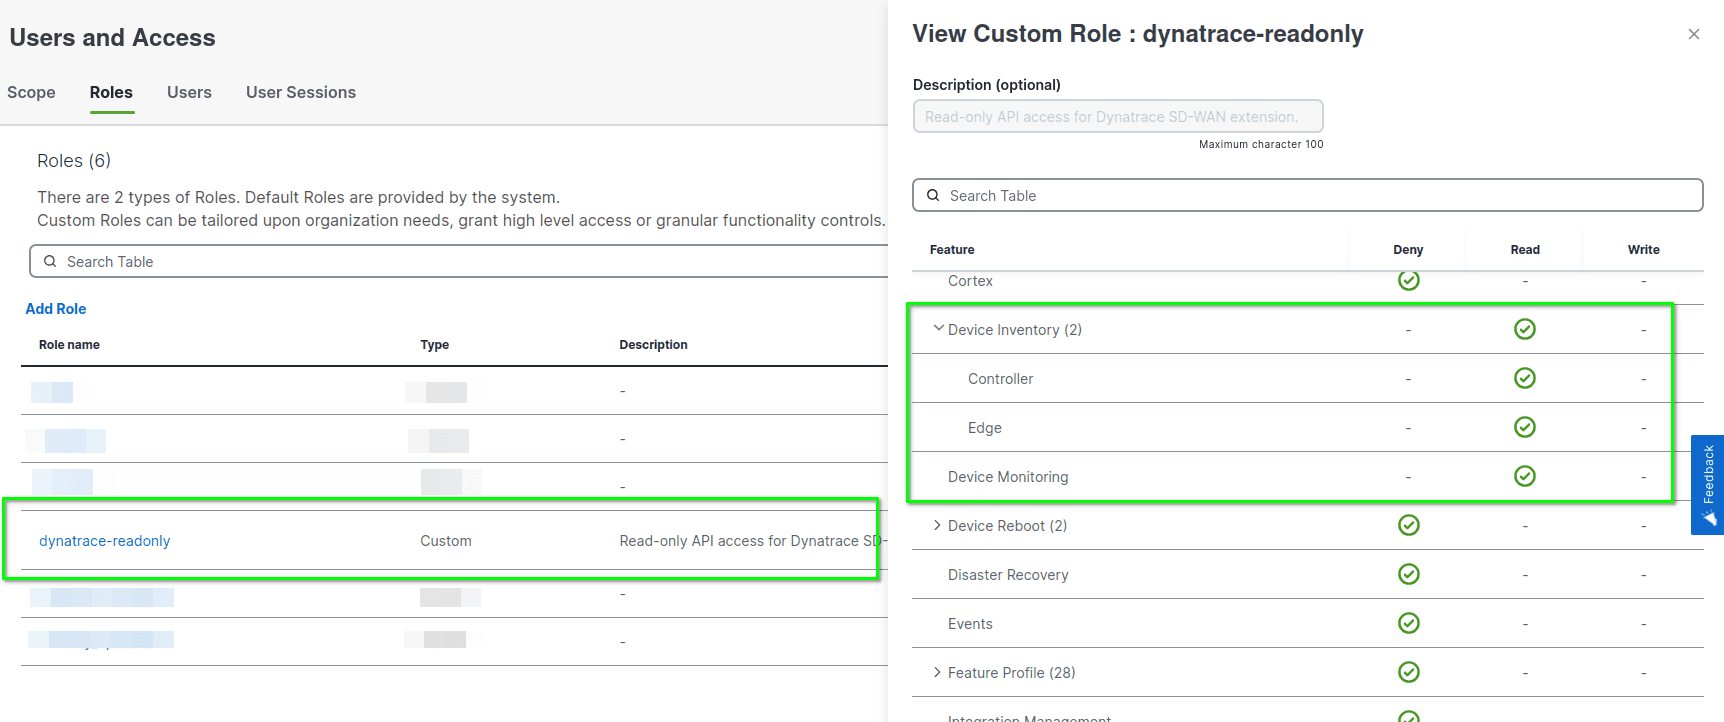 Create role
- Configure the custom role with Read access for:
- Device Inventory (both subroles: Controller and Edge)
- Device Monitoring
- Alarms
 Device Inventory, Device Monitoring and Alarms role permissions
 - Configure the custom role with Read access for:
-
Create a dedicated user (for example,
dynatrace-api) with thedynatrace-readonlyrole.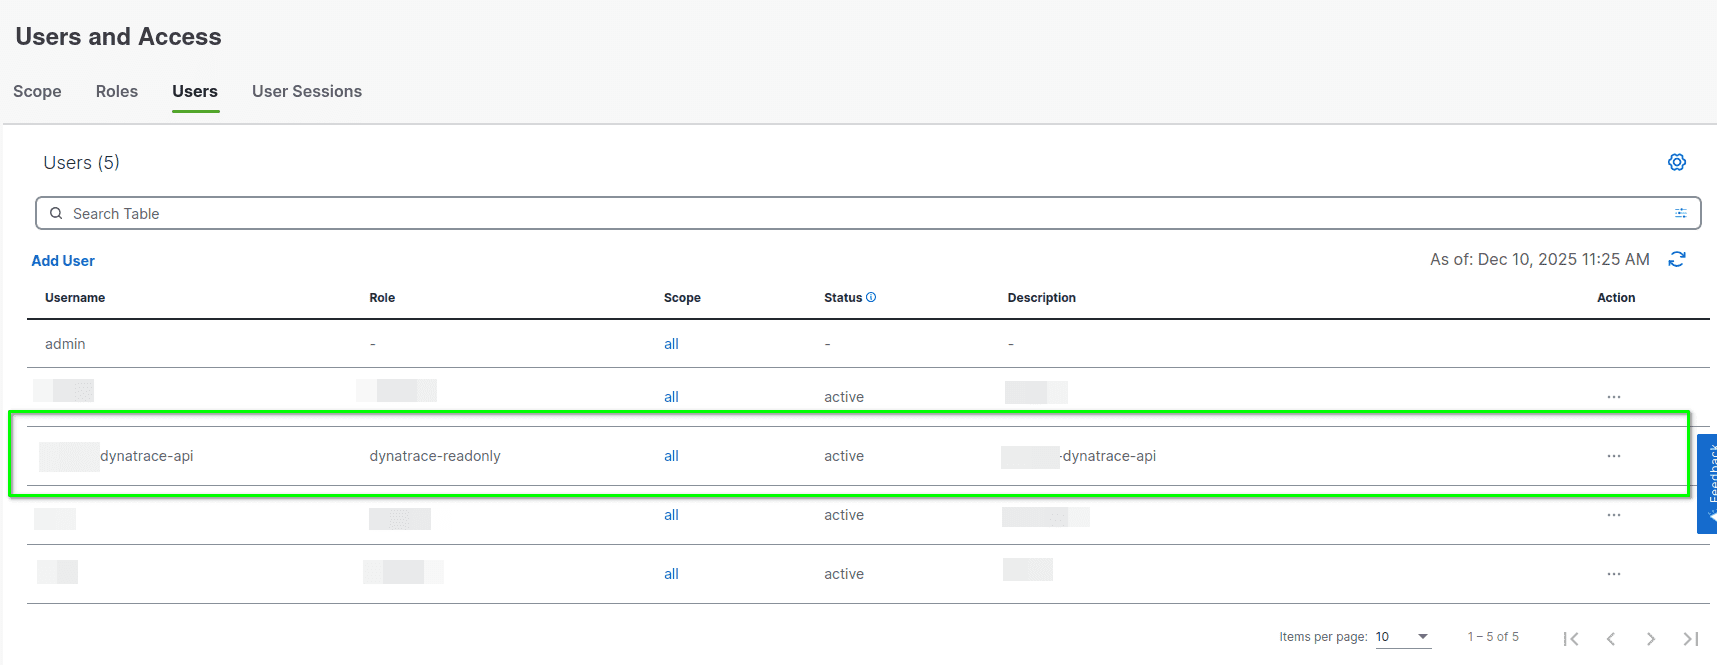 Create user
Extension activation
To activate remote monitoring of your SD-WAN fabric:
-
Activate the extension in the Dynatrace Hub.
Go to Hub, find the Cisco SD-WAN extension, and select Add to environment.
-
Add a new monitoring configuration.
You can configure the extension to use the vManage virtual IP (VIP) or individual vManage node endpoints that are part of the same logical Cisco SD-WAN Manager (vManage) cluster and manage the same SD-WAN fabric.
Details
The extension obtains metrics from the Statistics and Device State APIs. It uses Session-based authentication to authenticate with vManage and access the API.
Extension package contents
- Extension code (Python) that connects to the vManage API endpoints to collect device state and statistics data
- Dashboards offering high-level Cisco SD-WAN infrastructure overview
- Unified Analysis pages for Cisco SD-WAN Infrastructure, sites, devices, device interfaces, and transport locators
- Analysis screens integrated with the
 Infrastructure & Operations app available on the Dynatrace platform
Summary of the entities monitored
- SD-WAN Infrastructure
- SD-WAN Sites
- Devices – based on device state (health, QoE) and statistics data
- Device Interfaces – based on the Interface statistics
- Transport Locators (TLOC) – based on the Application-Aware Routing statistics aggregated by Local System IP, Color and Encapsulation Protocol
Extension metrics grouping (Feature sets)
The following feature sets categorize various metrics collected by the Cisco SD-WAN extension:
| Feature set | Description |
|---|---|
default | Provides generic network interface and device-specific metricsused in |
advanced_interface | Optional Provides additional generic network interface metrics. |
fabric_infra | Covers Infrastructure, Sites, and Devices health summary and overall metrics and Inventory state metrics. These metrics correspond to data visualized in the vManage Overview Dashboard. |
device_health | Captures device health and basic performance metrics (health, QoE, CPU load, memory utilization, reachability) for individual devices. |
device_statistics | Covers detailed device CPU, memory, processes, and disk metrics (typically reported by vManage API with 1-minute aggregation). |
interface_statistics | Captures interface metrics (typically reported by vManage API with 5-minute aggregation). |
approute_statistics | Captures TLOC metrics (typically reported by vManage API with 10-minute aggregation). |
alarms | Captures SD-WAN alarm count metrics. |
self-monitoring | Optional Metrics for fine-tuning and diagnostics of the extension itself. |
Extension metrics naming conventions
Generic network interface and device metrics (prefixed with com.dynatrace.extension.network_device) follow naming conventions used in Infrastructure & Operations.
Extension-specific metric names (prefixed with cisco.sdwan) and their dimension names follow naming conventions used by the vManage API. If you're familiar with the vManage API model, you'll recognize the property names used for these metrics and dimensions.
Licensing and costs
There is no charge to use the extension. You are only charged for the data that the extension ingests.
The Cisco SD-WAN extension ingests custom metrics, which consume Davis Data Units (DDUs) (Dynatrace classic license) or Metrics powered by Grail (DPS), according to your license model.
The following formula provides approximate data points ingested per minute, assuming all feature sets are enabled and assuming default data collection interval and default statistics aggregation times:
(5 (featureSet: fabric_infra)+ 1 * <Number of Alarms by : {device, severity, rulename}> (featureSet: alarms)+ 4 * <Number of Sites> (featureSet: fabric_infra)+ 5 * <Number of Devices> (featureSet: device_health)+ 24 // Optional - Self monitoring metrics (featureSet: self-monitoring, ignoring error counters not reported on normal operation)) / <collection-interval-default-5min> data points per minute+(11 * <Number of Devices> (featureSet: device_statistics)) / <statistics-aggregation-default-1min> data points per minute+(16 * <Number of Interfaces> (featureSet: interface_statistics)) / <statistics-aggregation-default-5min> data points per minute+(7 * <Number of TLOCs> (featureSet: approute_statistics)) / <statistics-aggregation-default-10min> data points per minute
Dynatrace Platform Subscription
In the Dynatrace Platform Subscription, metric ingestion consumes Metrics powered by Grail according to the number of ingested metric data points.
To calculate the approximate yearly consumption, apply the following calculation: <metric data points per minute> * 60 minutes * 24 hours * 365 days.
Dynatrace classic license
In the classic licensing model, metric ingestion consumes Davis Data Units (DDUs) at the rate of .001 DDUs per metric data point. Multiply the above formula for annual data points by .001 to estimate annual DDU usage.
The DDU cost above does not include any possible log events or custom events that are triggered by the extension. For more information, see DDU events.
Feature sets
When activating your extension using a monitoring configuration, you can limit monitoring to one of the feature sets. To work properly, the extension has to collect at least one metric after the activation.
In highly segmented networks, feature sets can reflect the segments of your environment. Then, when you create a monitoring configuration, you can select a feature set and a corresponding ActiveGate group that can connect to this particular segment.
All metrics that aren't categorized into any feature set are considered to be the default and are always reported.
A metric inherits the feature set of a subgroup, which in turn inherits the feature set of a group. Also, the feature set defined on the metric level overrides the feature set defined on the subgroup level, which in turn overrides the feature set defined on the group level.
circuitAvailability
| Metric name | Metric key | Description |
|---|---|---|
| TLOC Control Connections Up | cisco.sdwan.device.circuit.control_connections_up | Number of active control connections from this transport to controllers |
| TLOC Control Connections Down | cisco.sdwan.device.circuit.control_connections_down | Number of failed control connections from this transport to controllers |
| TLOC BFD Sessions Up | cisco.sdwan.device.circuit.bfd_sessions_up | Active BFD sessions on this transport (edge routers only; absent on controllers) |
| TLOC BFD Sessions Down | cisco.sdwan.device.circuit.bfd_sessions_down | Inactive BFD sessions on this transport (edge routers only; absent on controllers) |
| TLOC Control Connections to vSmarts | cisco.sdwan.device.circuit.control_connections_to_vsmarts | Number of active control connections to vSmart controllers (controllers only; absent on edge routers) |
| TLOC Expected Control Connections | cisco.sdwan.device.circuit.expected_control_connections | Expected number of control connections from this transport (sparse; present on vSmarts and vManage) |
interfaceStatistics
| Metric name | Metric key | Description |
|---|---|---|
| Admin Status | cisco.sdwan.interface.admin_status | SD-WAN Interface Admin Status |
| Oper Status | cisco.sdwan.interface.oper_status | SD-WAN Interface Oper Status |
| RX Packets | cisco.sdwan.interface.rx_pkts | SD-WAN Interface Packets Recieved |
| RX Octets | cisco.sdwan.interface.rx_octets | SD-WAN Interface Octets Recieved |
| RX Errors | cisco.sdwan.interface.rx_errors | SD-WAN Interface RX Errors |
| RX Drops | cisco.sdwan.interface.rx_drops | SD-WAN Interface RX Drops |
| RX Packets Per Second | cisco.sdwan.interface.rx_pps | SD-WAN Interface Recieved Packets Per Second |
| RX KiloBit Per Second | cisco.sdwan.interface.rx_kbps | SD-WAN Interface Recieved KiloBit Per Second |
| TX Packets | cisco.sdwan.interface.tx_pkts | SD-WAN Interface Packets Transmitted |
| TX Octets | cisco.sdwan.interface.tx_octets | SD-WAN Interface Octets Transmitted |
| TX Errors | cisco.sdwan.interface.tx_errors | SD-WAN Interface TX Errors |
| TX Drops | cisco.sdwan.interface.tx_drops | SD-WAN Interface TX Drops |
| TX Packets Per Second | cisco.sdwan.interface.tx_pps | SD-WAN Interface Transmitted Packets Per Second |
| TX KiloBit Per Second | cisco.sdwan.interface.tx_kbps | SD-WAN Interface Transmitted KiloBit Per Second |
| Uplink Capacity Utilization | cisco.sdwan.interface.up_cap_perc | SD-WAN Interface Uplink Capacity Utilization |
| Downlink Capacity Utilization | cisco.sdwan.interface.down_cap_perc | SD-WAN Interface Downlink Capacity Usage |
deviceHealth
| Metric name | Metric key | Description |
|---|---|---|
| CPU Load | cisco.sdwan.device.cpu_load | SD-WAN Device CPU Load |
| Memory Utilization | cisco.sdwan.device.memory_utilization | SD-WAN Device Memory Utilization |
| Device Health | cisco.sdwan.device.health | SD-WAN Device Health Code Value (1 - green, 3 - yellow, 5 - red) |
| Device Reachability | cisco.sdwan.device.reachability | SD-WAN Device Reachability Code Value (1 - reachable, 0 - unreachable) |
| Device QoE | cisco.sdwan.device.qoe | SD-WAN Device QoE Score |
fabricInfra
| Metric name | Metric key | Description |
|---|---|---|
| Sites Health | cisco.sdwan.fabric_infra.site_health_count.gauge | Number of Sites per Health Code |
| Devices Health | cisco.sdwan.fabric_infra.device_health_count.gauge | Number of Devices per Health Code |
| Hardware Status | cisco.sdwan.fabric_infra.hardware_summary_count.gauge | Number of Devices per Hardware Status Code |
| Inventory Status | cisco.sdwan.fabric_infra.inventory_summary_count.gauge | Number of Devices per Inventory Status Code |
| Tunnels Health | cisco.sdwan.fabric_infra.tunnel_health_count.gauge | Number of Tunnels per Health Code |
| Site Health | cisco.sdwan.site.site_health | Site Health Code Value (1 - Good, 3 - Fair, 5 - Poor) |
| Site's Devices Health | cisco.sdwan.site.devices_health | Site's Devices Health Code Value (1 - Good, 3 - Fair, 5 - Poor) |
| Site's Tunnels Health | cisco.sdwan.site.tunnels_health | Site's Tunnels Health Code Value (1 - Good, 3 - Fair, 5 - Poor) |
| Site's Apps Usage | cisco.sdwan.site.apps_usage | Site's Apps Usage |
advancedInterface
| Metric name | Metric key | Description |
|---|---|---|
| — | com.dynatrace.extension.network_device.if.in.pkts.count | — |
| — | com.dynatrace.extension.network_device.if.out.pkts.count | — |
default
| Metric name | Metric key | Description |
|---|---|---|
| — | com.dynatrace.extension.network_device.cpu_usage | — |
| — | com.dynatrace.extension.network_device.memory_usage | — |
| — | com.dynatrace.extension.network_device.sysuptime | — |
| — | com.dynatrace.extension.network_device.memory_used | — |
| — | com.dynatrace.extension.network_device.memory_free | — |
| — | com.dynatrace.extension.network_device.if.status | — |
| — | com.dynatrace.extension.network_device.if.bytes_in.count | — |
| — | com.dynatrace.extension.network_device.if.bytes_out.count | — |
| — | com.dynatrace.extension.network_device.if.in.errors.count | — |
| — | com.dynatrace.extension.network_device.if.out.errors.count | — |
| — | com.dynatrace.extension.network_device.if.in.discards.count | — |
| — | com.dynatrace.extension.network_device.if.out.discards.count | — |
approuteStatistics
| Metric name | Metric key | Description |
|---|---|---|
| TLOC QoE | cisco.sdwan.tloc.vqoe_score | SD-WAN TLOC QoE Score aggregated as average across all mapped tunnels |
| TLOC Loss | cisco.sdwan.tloc.loss_percentage | SD-WAN TLOC Loss Percentage aggregated as average across all mapped tunnels |
| TLOC Latency | cisco.sdwan.tloc.latency | SD-WAN TLOC Latency aggregated as average across all mapped tunnels |
| TLOC Jitter | cisco.sdwan.tloc.jitter | SD-WAN TLOC Jitter aggregated as average across all mapped tunnels |
| TLOC TX Octets | cisco.sdwan.tloc.tx_octets | SD-WAN TLOC TX Octets aggregated as sum across all mapped tunnels |
| TLOC RX Octets | cisco.sdwan.tloc.rx_octets | SD-WAN TLOC RX Octets aggregated as sum across all mapped tunnels |
| TLOC Tunnels | cisco.sdwan.tloc.tunnel_count.gauge | SD-WAN TLOC Tunnels determined by the cardinality of the Remote System IPs |
deviceStatistics
| Metric name | Metric key | Description |
|---|---|---|
| CPU System | cisco.sdwan.device.cpu_system | SD-WAN Device CPU System Utilization |
| CPU User | cisco.sdwan.device.cpu_user | SD-WAN Device CPU User Utilization |
| CPU Idle | cisco.sdwan.device.cpu_idle | SD-WAN Device CPU Idle |
| Memory Used | cisco.sdwan.device.mem_used | SD-WAN Device Memory Used |
| Memory Free | cisco.sdwan.device.mem_free | SD-WAN Device Memory Free |
| Memory Buffers | cisco.sdwan.device.mem_buffers | SD-WAN Device Memory Buffers |
| Memory Cached | cisco.sdwan.device.mem_cached | SD-WAN Device Memory Cached |
| Processes Total | cisco.sdwan.device.totalp | SD-WAN Device Total Processes |
| Processes Running | cisco.sdwan.device.runningp | SD-WAN Device Running Processes |
| Disk Used | cisco.sdwan.device.disk_used | SD-WAN Device Disk Used |
| Disk Available | cisco.sdwan.device.disk_avail | SD-WAN Device Disk Available |
alarms
| Metric name | Metric key | Description |
|---|---|---|
| Alarm Count | cisco.sdwan.device.alarm_count.gauge | SD-WAN Device Alarm Count |
self-monitoring
| Metric name | Metric key | Description |
|---|---|---|
| Total duration of all rate-limited executed queries to all connection urls to collect data reported as metrics | sfm.cisco.sdwan.monitor.run.total.duration | — |
| Total duration of all rate-limited synchronously executed queries to all connection urls to collect data reported as metrics | sfm.cisco.sdwan.monitor.run.sync.duration | — |
| Metrics Data Collection Overall Asynchronous Time | sfm.cisco.sdwan.monitor.run.async.duration | Total duration of all rate-limited asynchronously executed queries to all connection urls to collect data reported as metrics |
| Metrics Data Collection Error | sfm.cisco.sdwan.monitor.run.error | Indicates whether an unhandled error occurred during execution of Metrics Data Collection. |
| get_site_health_stats Query Time | sfm.cisco.sdwan.get_site_health_stats.duration | — |
| get_site_health_stats Error | sfm.cisco.sdwan.get_site_health_stats.error | Indicates whether an error occurred during get_site_health_stats Query |
| report_site_health_stats Overall Time | sfm.cisco.sdwan.report_site_health_stats.duration | — |
| report_site_health_stats Error | sfm.cisco.sdwan.report_site_health_stats.error | Indicates whether an error occurred during report_site_health_stats |
| get_vedge_inventory_summary Query Time | sfm.cisco.sdwan.get_vedge_inventory_summary.duration | — |
| get_vedge_inventory_summary Error | sfm.cisco.sdwan.get_vedge_inventory_summary.error | Indicates whether an error occurred during get_vedge_inventory_summary Query |
| report_vedge_inventory_summary Overall Time | sfm.cisco.sdwan.report_vedge_inventory_summary.duration | — |
| report_vedge_inventory_summary Error | sfm.cisco.sdwan.report_vedge_inventory_summary.error | Indicates whether an error occurred during report_vedge_inventory_summary |
| get_device_health_overview_stats Query Time | sfm.cisco.sdwan.get_device_health_overview_stats.duration | — |
| get_device_health_overview_stats Error | sfm.cisco.sdwan.get_device_health_overview_stats.error | Indicates whether an error occurred during get_device_health_overview_stats Query |
| report_device_health_overview Overall Time | sfm.cisco.sdwan.report_device_health_overview.duration | — |
| report_device_health_overview Error | sfm.cisco.sdwan.report_device_health_overview.error | Indicates whether an error occurred during report_device_health_overview |
| get_hardware_health_summary Query Time | sfm.cisco.sdwan.get_hardware_health_summary.duration | — |
| get_hardware_health_summary Error | sfm.cisco.sdwan.get_hardware_health_summary.error | Indicates whether an error occurred during get_hardware_health_summary Query |
| report_hardware_health_summary Overall Time | sfm.cisco.sdwan.report_hardware_health_summary.duration | — |
| report_hardware_health_summary Error | sfm.cisco.sdwan.report_hardware_health_summary.error | Indicates whether an error occurred during report_hardware_health_summary |
| get_remote_system_cardinality Query Time | sfm.cisco.sdwan.get_remote_system_cardinality.duration | — |
| get_remote_system_cardinality Error | sfm.cisco.sdwan.get_remote_system_cardinality.error | Indicates whether an error occurred during get_approute_statistics_remote_system_cardinality Query |
| report_remote_system_cardinality Overall Time | sfm.cisco.sdwan.report_remote_system_cardinality.duration | — |
| report_remote_system_cardinality Error | sfm.cisco.sdwan.report_remote_system_cardinality.error | Indicates whether an error occurred during report_remote_system_cardinality |
| get_tunnel_health_overview Query Time | sfm.cisco.sdwan.get_tunnel_health_overview.duration | — |
| get_tunnel_health_overview Error | sfm.cisco.sdwan.get_tunnel_health_overview.error | Indicates whether an error occurred during get_tunnel_health_overview Query |
| report_tunnel_health_overview Overall Time | sfm.cisco.sdwan.report_tunnel_health_overview.duration | — |
| report_tunnel_health_overview Error | sfm.cisco.sdwan.report_tunnel_health_overview.error | Indicates whether an error occurred during report_tunnel_health_overview |
| get_approute_statistics_aggregation Query Time | sfm.cisco.sdwan.get_approute_statistics_aggregation.duration | — |
| get_approute_statistics_aggregation Error | sfm.cisco.sdwan.get_approute_statistics_aggregation.error | Indicates whether an error occurred during get_approute_statistics_aggregation Query |
| report_statistics_approute Overall Time | sfm.cisco.sdwan.report_statistics_approute.duration | — |
| report_statistics_approute Error | sfm.cisco.sdwan.report_statistics_approute.error | Indicates whether an error occurred during report_statistics_approute |
| get_devices_health Query Time | sfm.cisco.sdwan.get_devices_health.duration | — |
| get_devices_health Error | sfm.cisco.sdwan.get_devices_health.error | Indicates whether an error occurred during get_devices_health Query |
| report_devices_health Overall Time | sfm.cisco.sdwan.report_devices_health.duration | — |
| report_devices_health Error | sfm.cisco.sdwan.report_devices_health.error | Indicates whether an error occurred during report_devices_health |
| get_statistics_system_aggregation Query Time | sfm.cisco.sdwan.get_statistics_system_aggregation.duration | — |
| get_statistics_system_aggregation Error | sfm.cisco.sdwan.get_statistics_system_aggregation.error | Indicates whether an error occurred during get_statistics_system_aggregation Query |
| get_interface_statistics Query Time | sfm.cisco.sdwan.get_interface_statistics.duration | — |
| get_interface_statistics Error | sfm.cisco.sdwan.get_interface_statistics.error | Indicates whether an error occurred during get_interface_statistics Query |
| report_statistics_system Overall Time | sfm.cisco.sdwan.report_statistics_system.duration | — |
| report_statistics_system Error | sfm.cisco.sdwan.report_statistics_system.error | Indicates whether an error occurred during report_statistics_system |
| report_statistics_interface Overall Time | sfm.cisco.sdwan.report_statistics_interface.duration | — |
| report_statistics_interface Error | sfm.cisco.sdwan.report_statistics_interface.error | Indicates whether an error occurred during report_statistics_interface |
| — | sfm.cisco.sdwan.get_alarms_count.duration | — |
| — | sfm.cisco.sdwan.get_alarms_count.error | — |
| — | sfm.cisco.sdwan.get_alarms_aggregation.duration | — |
| — | sfm.cisco.sdwan.get_alarms_aggregation.error | — |
| — | sfm.cisco.sdwan.get_alarms.duration | — |
| — | sfm.cisco.sdwan.get_alarms.error | — |
| — | sfm.cisco.sdwan.report_alarm_counts.duration | — |
| — | sfm.cisco.sdwan.report_alarm_counts.error | — |
| — | sfm.cisco.sdwan.report_alarm_log_events.duration | — |
| — | sfm.cisco.sdwan.report_alarm_log_events.error | — |
| get_tloc_status Query Time | sfm.cisco.sdwan.get_tloc_status.duration | — |
| get_tloc_status Error | sfm.cisco.sdwan.get_tloc_status.error | Indicates whether an error occurred during get_tloc_status Query |
| report_tloc_status Overall Time | sfm.cisco.sdwan.report_tloc_status.duration | — |
| report_tloc_status Error | sfm.cisco.sdwan.report_tloc_status.error | Indicates whether an error occurred during report_tloc_status |
FAQ
Do I need to enable all feature sets?
No, not all feature sets are required.
self-monitoringis optional and is only needed for fine-tuning and diagnostics of the extension itself.- If you want to view PLATFORM screens (generic network device and interface metrics)within Infrastructure & Operations, only the
defaultfeature set is needed. - If you want to view both CLASSIC screens and all PLATFORM screens (generic network device and interface metrics and extension-specific metrics), enable
fabric_infra,device_health,device_statistics,interface_statistics,approute_statisticsandalarmsfeature sets depending on your needs. advanced_interfaceis optional (prepared for future use); its metrics are not currently availablein the Infrastructure & Operations nor in the Unified Analysis pages.
How is site, device, tunnel, and application health represented?
The vManage API returns health status for sites, devices, tunnels, and applications as textual values.
- Site, site devices, tunnels, and applications health:
good,fair,poor - Device health:
green,yellow,red - Device reachability:
reachable,unreachable
The extension reports health as numeric metric values representing the status returned by the vManage API, using the following mappings.
Site, Site Devices, Site Tunnels, and Applications Health
| Health Status | Metric Value |
|---|---|
|
|
|
|
|
|
Applied to:
cisco.sdwan.site.site_healthcisco.sdwan.site.devices_healthcisco.sdwan.site.tunnels_healthcisco.sdwan.site.apps_health
Device Health
| Health Status | Metric Value |
|---|---|
|
|
|
|
|
|
Applied to:
cisco.sdwan.device.health
Device Reachability
| Reachability Status | Metric Value |
|---|---|
|
|
|
|
Applied to:
cisco.sdwan.device.reachability
How are Transport Locator (TLOC) metrics calculated?
The extension reports TLOC metrics by aggregating data retrieved from the vManage API. Average latency, loss, and jitter values are calculated using the vManage API query language and are aggregated by the following TLOC attributes:
- local system IP (
local_system_ip) - local color (
local_color) - encapsulation (
proto)
The metrics are queried from Application-Aware Routing (App-Route) statistics. Aggregation is performed across all tunnels associated with the same local TLOC.
The number of tunnels for a TLOC is determined by evaluating the cardinality of remote system IPs associated with the aggregated App-Route statistics.
How does the extension handle API rate limiting on vManage?
- The extension does not use the Real-Time Monitoring APIs, as these are highly CPU-intensive and subject to strict internal throttling.
- The extension does not use the Bulk Statistics APIs, which are intended for large dataset retrieval and are limited to 48 bulk requests per minute and 2 concurrent bulk statistics requests.
The extension primarily uses Cisco SD-WAN Statistics / Monitoring APIs (non-bulk) to collect operational data. According to Cisco SD-WAN documentation, these APIs are subject to a general rate limit of 100 requests per second.
To ensure stable and predictable operation, the extension applies its own internal API rate limiting, which you can configure by setting API rate limit per minute per one SD-WAN Manager Connection in the extension settings. The default rate limit is 16 requests per minute, with a maximum supported value of 48 requests per minute.
The internal API rate limit has a deliberately conservative maximum value of 48 requests per minute. This limit ensures that the extension does not overload your monitored SD-WAN infrastructure with REST API calls.
Data is periodically collected from the Cisco SD-WAN Manager at a configurable Metrics Collection Frequency, which is 5 minutes by default. During each collection cycle, API requests are evenly distributed over time to stay within the configured rate limit.
For a single Cisco SD-WAN deployment, API rate limits apply to the SD-WAN fabric as a whole, not to individual vManage nodes. As a result, you should treat API rate limits as fabric-wide limits.
You can configure the extension to use the vManage virtual IP (VIP) or load-balanced endpoint, which is the recommended access method for high-availability deployments. This approach relies on vManage's internal load-balancing and failover mechanisms.
Alternatively, you can configure multiple vManage node endpoints, provided they belong to the same vManage cluster and manage the same SD-WAN fabric. In this configuration, all endpoints return identical fabric-wide data, and the extension automatically distributes API requests evenly across the configured nodes.
The internal API rate limit configured in the extension applies globally across all configured vManage endpoints. For example, if you configure three vManage node endpoints and set the rate limit to 16 requests per minute, the extension distributes API calls across the nodes, resulting in approximately 5 requests per minute per node while maintaining the overall fabric-wide rate limit.
If the extension detects that one of the configured vManage nodes is not reachable, it automatically stops using that endpoint and continues data collection using the remaining nodes without increasing the per-node request rate. Once the unavailable node becomes reachable again, the extension automatically resumes using all configured nodes for data collection.
