SAP HANA Database (remote monitoring) extension
- Latest Dynatrace
- Extension
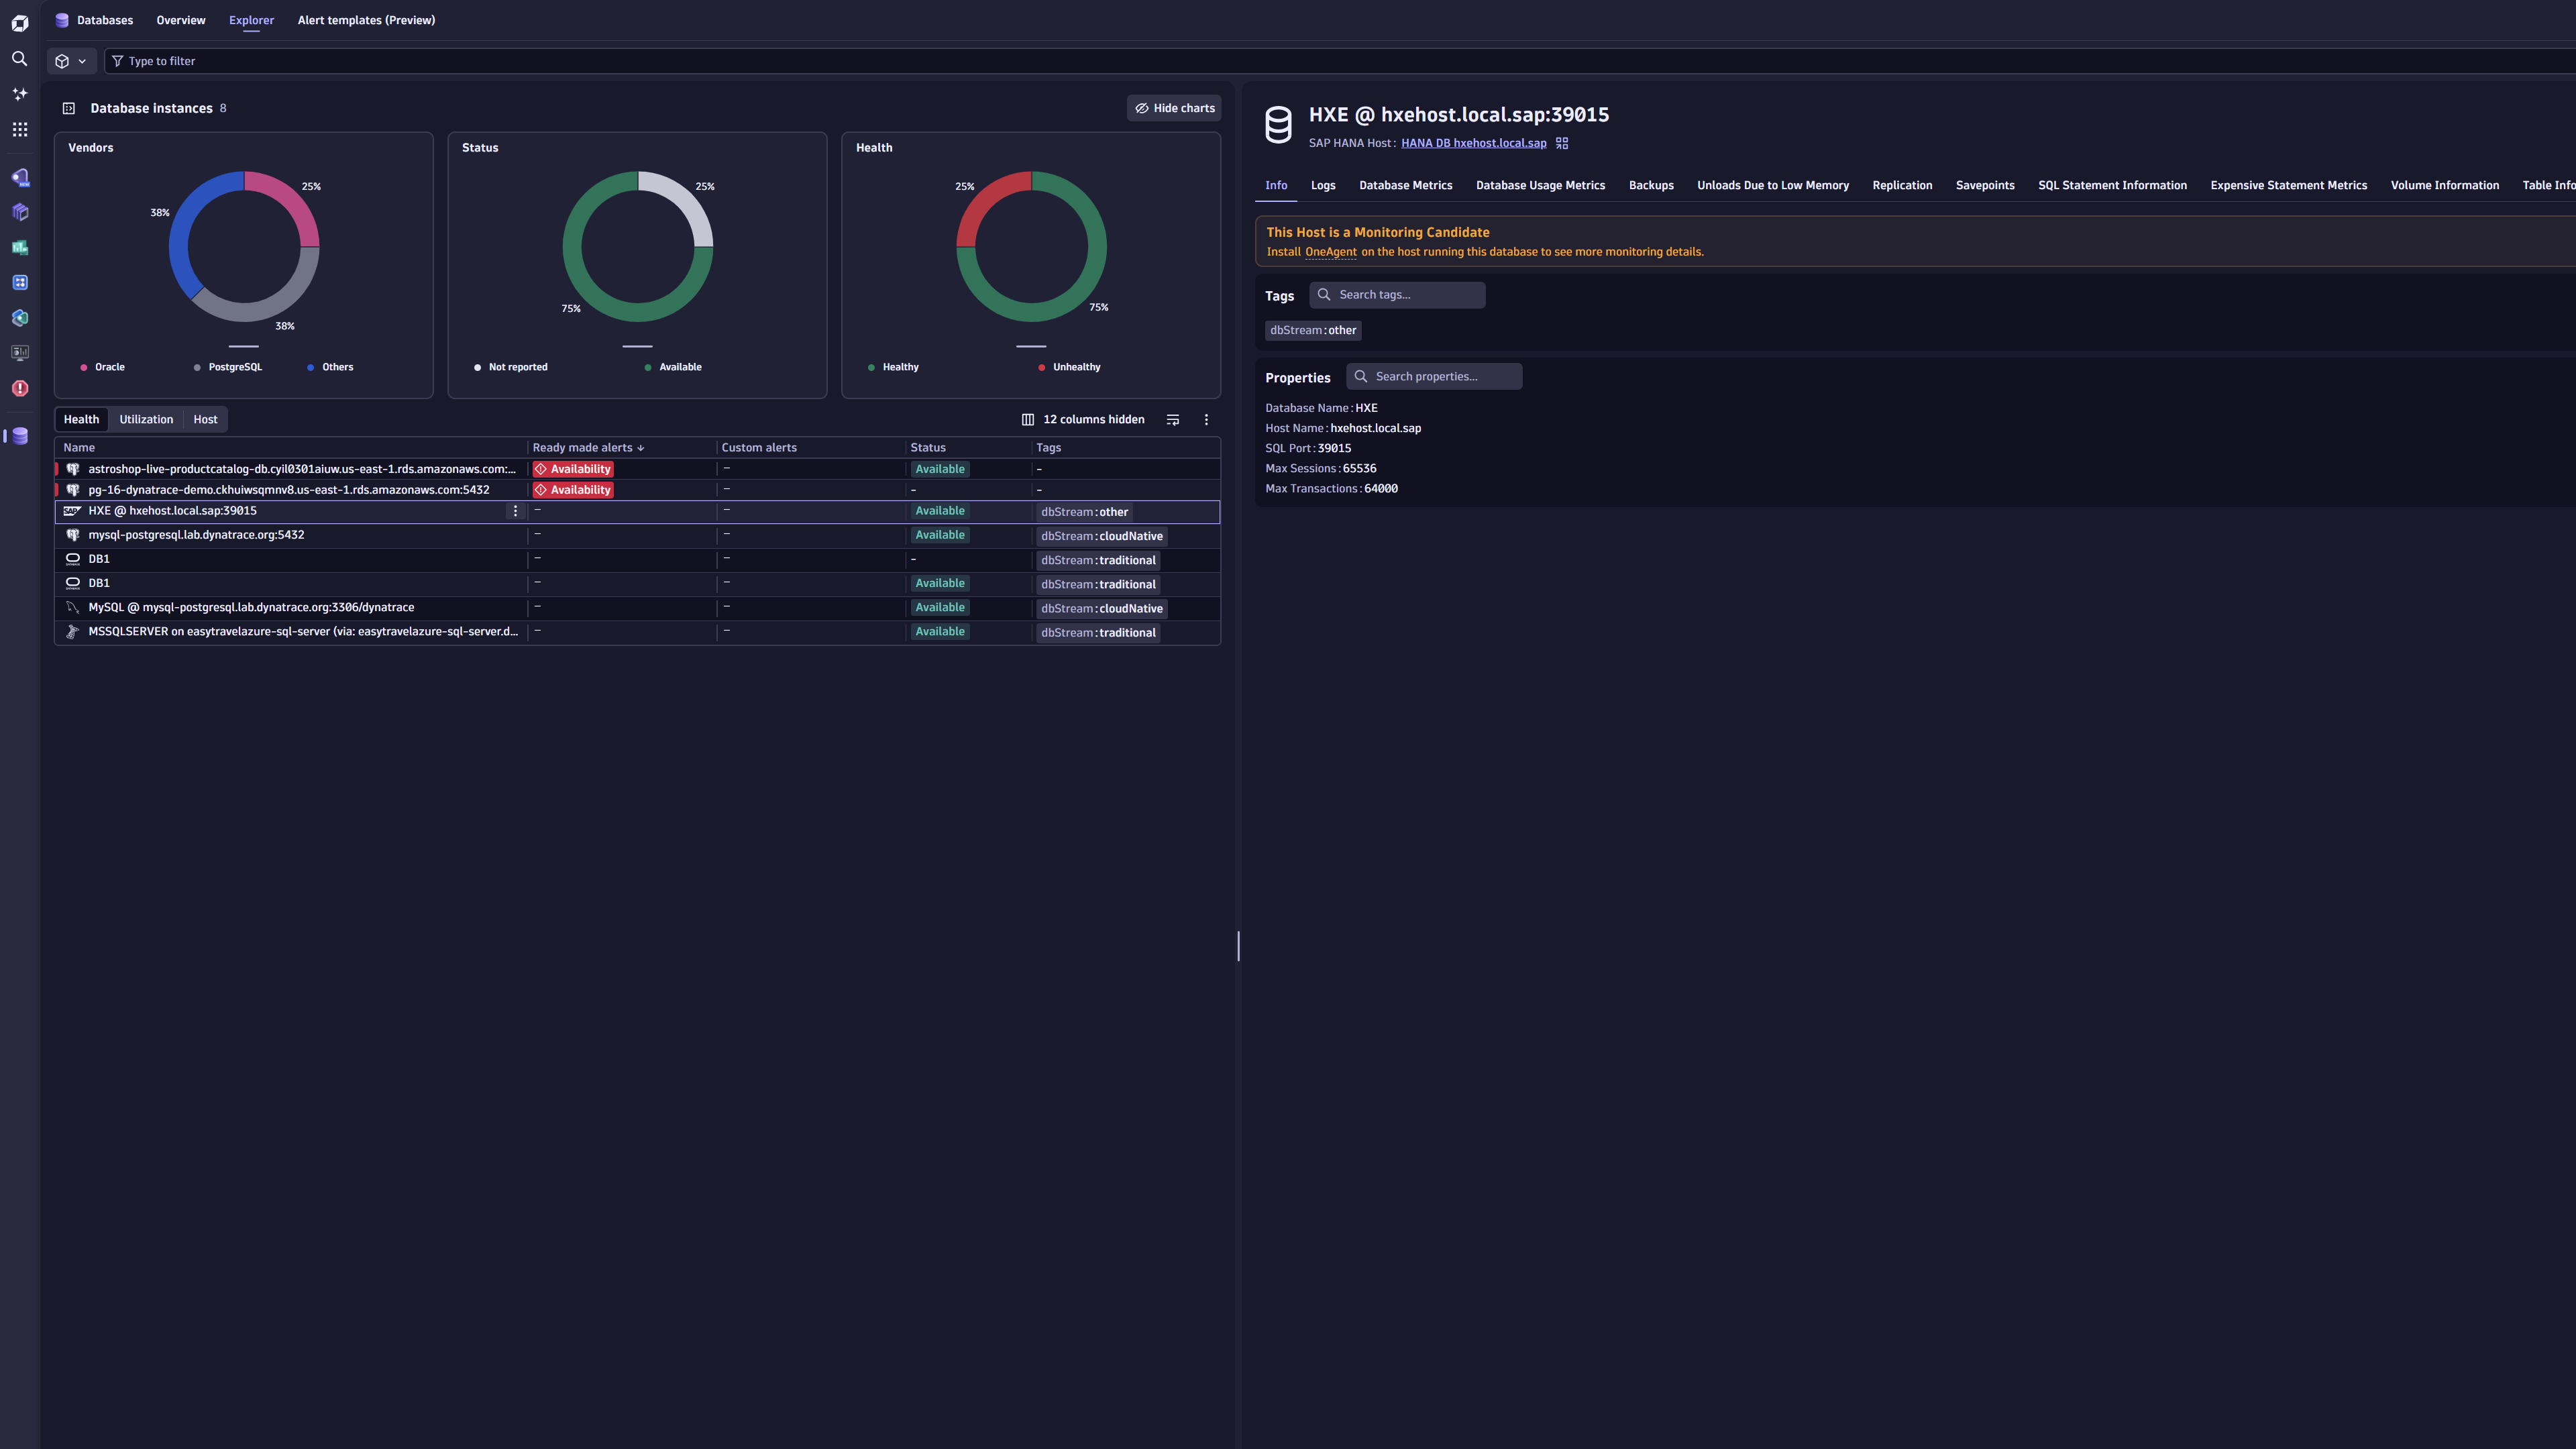
Monitor SAP HANA databases remotely to analyze SQL performance and database health.
Get started
Overview
Monitor SAP HANA databases remotely to analyze SQL performance and database health.
The SAP HANA database monitoring solution is implemented as a Dynatrace ActiveGate extension. The extension queries SAP HANA databases for key performance and health metrics, including infrastructure metrics (CPU, Disk, and Network) as well as details on Backups, Savepoints, Replication, and more. Dynatrace Intelligence analyzes these metrics for anomalies and problems.
Use cases
- Monitor the health state and performance of SAP HANA databases.
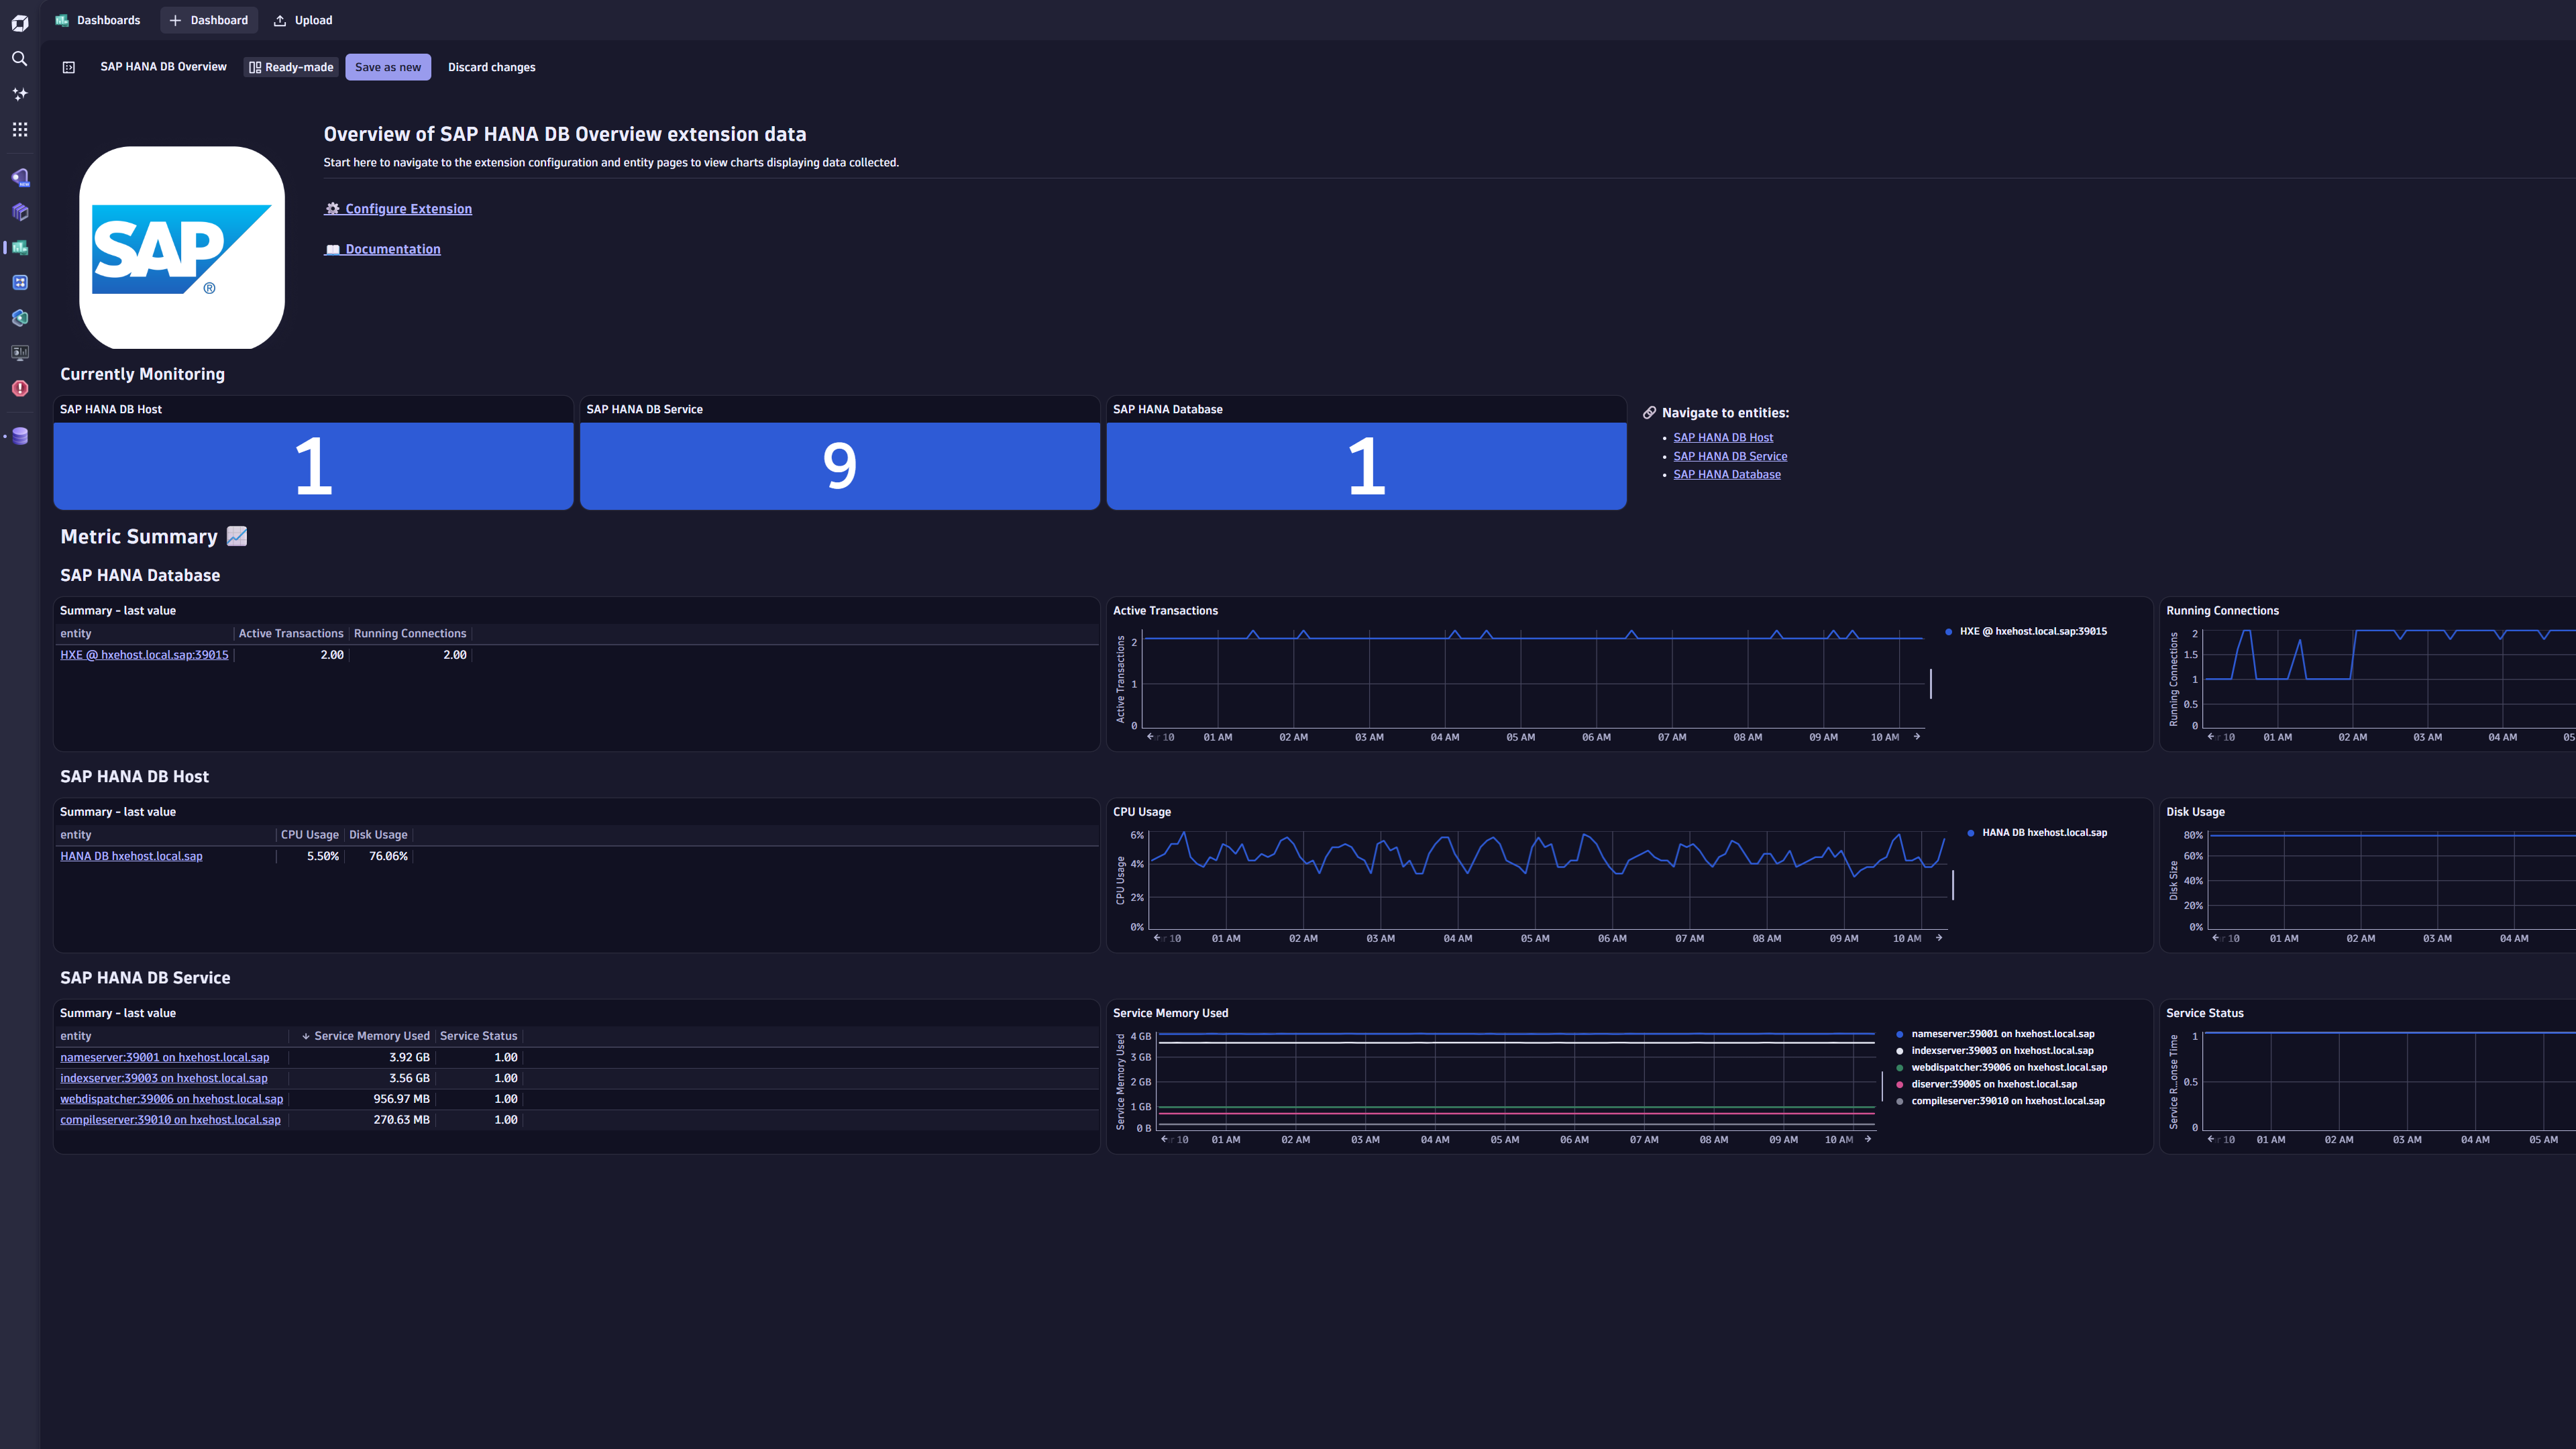
- Monitor infrastructure with a comprehensive dashboard.
- Detect traffic anomalies and alert on them.
- Take preemptive measures to avoid service degradations.
Requirements
-
Designate an ActiveGate group or groups that will remotely connect to your SAP Hana Database server to pull data. All ActiveGates in each group must connect to your SAP HANA database.
-
Download and select SAP HANA DB JDBC driver from Maven Repository.
Add JDBC driver
Manually place the driver JAR file on the ActiveGate host.
To define the SAP HANA Database server, put
ngdbc.jarfile in the following location:Windows:
C:\ProgramData\dynatrace\remotepluginmodule\agent\conf\userdata\libs
Linux:/var/lib/dynatrace/remotepluginmodule/agent/conf/userdata/libs/These are the default directories. The actual location may differ based on your ActiveGate installation and customization.
Where to find the ngdbc.jar file
You can obtain the
ngdbc.jarfile from the SAP HANA Client installation directory:- Windows:
C:\Program Files\SAP\hdbclient\ngdbc.jar - Linux:
/usr/sap/hdbclient/ngdbc.jar
- Windows:
-
Create a dedicated database user in your database instance with necessary permissions. Dynatrace uses this user to run monitoring queries against your SAP HANA database.
- Assign
PUBLICandMONITORINGroles to the user. - To audit log monitoring via the
Audit Logsfeature set, applyGRANT AUDIT READ TO <USER>.
- Assign
Activation and setup
Follow these steps to configure your device for SAP HANA database monitoring.
Add DB instance
-
Go to Dynatrace Hub
 .
. -
Select and install SAP HANA extension. This enables the extension in your monitoring environment.
- Required permission: Change monitoring settings
-
Select Add DB Instance in the
 Databases. This opens the Add DB Instance wizard.
 -
Select SAP HANA section in the wizard.
Select hosting type
Select a hosting type from the options. This choice determines which script generates the necessary database objects later in the process.
- From the Add DB Instance wizard, select the host type that matches your requirement.
- Select Next.
Select ActiveGate group
- Select the ActiveGate group to determine which ActiveGates will run the extension.
- Select Next step.
Create a connection
Set up the connection to your database instance.
- Name the connection, so you can identify it later.
- Add the details in the Configure connection section.
- Provide the following connection details:
- Host
- Port
- Add and select JDBC driver if not already available.
- Provide the following connection details:
- Provide the Authenticate credentials directly or use secure alternatives.
- Basic credentials: With basic authentication, authentication details passed to Dynatrace when activating monitoring configuration are masked to prevent them from being retrieved.
- Credential vault: Use vault credentials to securely store and retrieve database credentials.
- Optionally, enable SSL to establish a secure connection for your configuration, including truststore setup.
- Select Next.
Install instance
- Add manual configurations based on the monitoring requirements.
- Select Create DB instance monitoring.
Details
This extension connects remotely via an ActiveGate to your SAP HANA Database using the provided credentials. It retrieves metrics via the database's Monitoring Views provided by the database itself.
Licensing and costs
The Table Information feature set was added in version 2.0.0.
This feature set is enabled by default for new monitoring configurations. Note that the metrics listed below can incur high licensing costs.
sap.hana.db.service.table.lockssap.hana.db.service.table.recordssap.hana.db.service.table.size
DQL and Logs
The extension ingests the following individually as log messages:
- Out of memory events
- Tracefile information
- Current alerts
- Expensive statements
Feature sets
When activating your extension using a monitoring configuration, you can limit monitoring to one of the feature sets. To work properly, the extension has to collect at least one metric after the activation.
In highly segmented networks, feature sets can reflect the segments of your environment. Then, when you create a monitoring configuration, you can select a feature set and a corresponding ActiveGate group that can connect to this particular segment.
All metrics that aren't categorized into any feature set are considered to be the default and are always reported.
A metric inherits the feature set of a subgroup, which in turn inherits the feature set of a group. Also, the feature set defined on the metric level overrides the feature set defined on the subgroup level, which in turn overrides the feature set defined on the group level.
Trace File Information
| Metric name | Metric key | Description |
|---|
Replication Metrics
| Metric name | Metric key | Description |
|---|---|---|
| Secondary Failover Count | sap.hana.db.service.replication.secondary_failover_count.count | Replication - Number of Secondary Failover Count |
| Log Shipping Delay | sap.hana.db.service.replication.log_shipping_delay | Replication - Number of seconds between Last Log Position and Shipped Log Position |
| Replication Errors | sap.hana.db.service.replication.errors | Replication - Number of Errors |
| Replication Snapshot Age | sap.hana.db.service.replication.snapshot_age | Replication - Age in Seconds of most recent Snapshot |
Host Agent Network Rates
| Metric name | Metric key | Description |
|---|---|---|
| NIC Rate | sap.hana.db.host.network_interface.rate | NIC IO Speeds (both Tx and Rx) |
default
| Metric name | Metric key | Description |
|---|---|---|
| Database Volume Used Size | sap.hana.db.database.volume.used | Database Volume Used Size |
| Database Volume Total Size | sap.hana.db.database.volume.total | Database Volume Total Size |
| HANA Database Limits | sap.hana.db.limits | Database Limits |
| HANA DB Build Version | sap.hana.db.build_version | SAP HANA DB Build Version |
| IP Addresses | sap.hana.db.ip_addresses | IP Address of HANA DB Host |
| Database Availability | sap.hana.db.availability | Database Availability (100 = active, 0 = not active) |
| Max Heap Usage | sap.hana.db.host.max_heap_usage | Max Heap Usage of the Host |
| Global Memory Allocation Limit | sap.hana.db.host.global_memory_allocation_limit | Global Memory Allocation Limit |
| Used Memory | sap.hana.db.host.used_memory | Host Used Memory |
| Used Physical Memory | sap.hana.db.host.used_physical_memory | Host Used Physical Memory |
| Volume Used Size | sap.hana.db.service.volume.used | Used Size of Volume |
| Total Volume Size | sap.hana.db.service.volume.total | Total Size of Volume |
| Service Memory Used | sap.hana.db.service.memory.used | Memory Usage of the Service (Host Process) |
| Service Column Tables Memory Used | sap.hana.db.service.memory.column_tables_memory_used | Column Tables Memory Usage by Service |
| Service Row Store Allocated Size | sap.hana.db.service.memory.row_store_allocated_size | Row Store Allocated Size by Service |
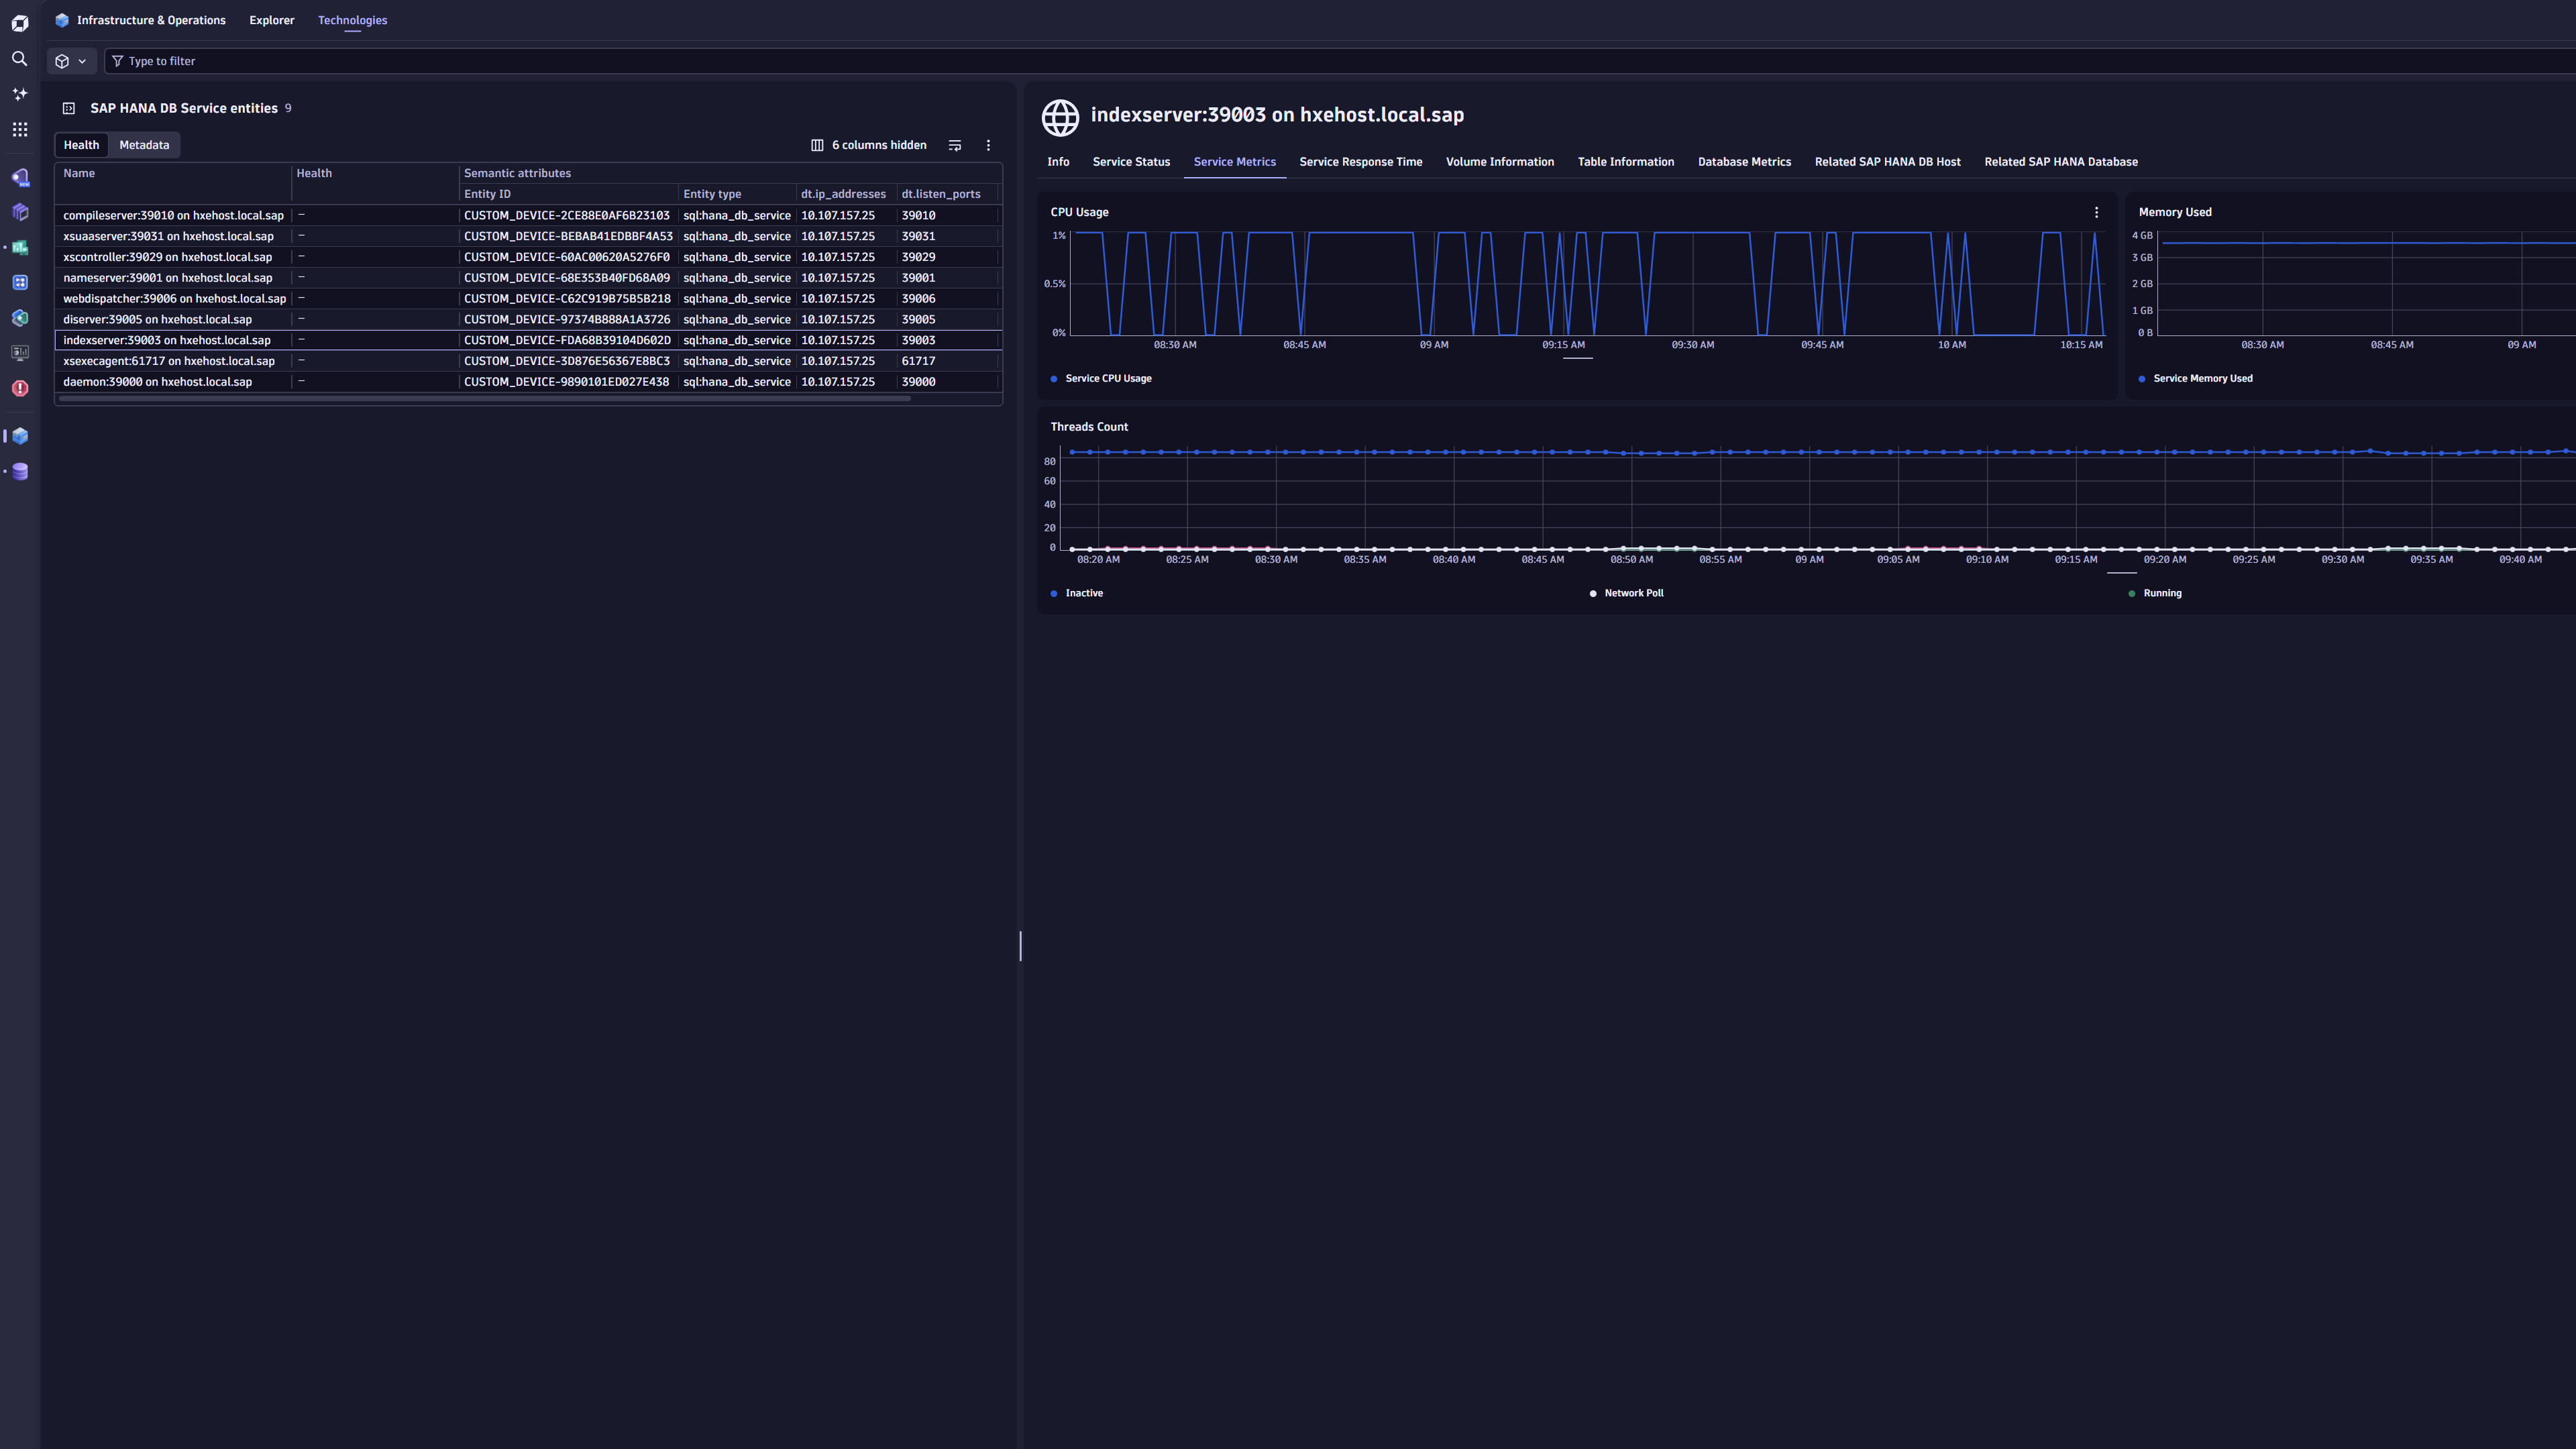
| System CPU Usage | sap.hana.db.service.system_cpu_usage | Rate of OS Kernel/System CPU used by index server |
| Service CPU Usage | sap.hana.db.service.cpu_usage | Service CPU Usage |
| Service Status | sap.hana.db.service.status | Current Service Status |
| Service Threads | sap.hana.db.service.threads | Number of Threads By Type |
| SQL Plan Cache Hit Ratio | sap.hana.db.sql.plan_cache_hit_ratio | Average SQL Plan Cache Hit Ratio |
Disk Size Usage
| Metric name | Metric key | Description |
|---|---|---|
| Disk Usage | sap.hana.db.host.disk_usage | Host Disk Usage |
Service Response Time
| Metric name | Metric key | Description |
|---|---|---|
| Service Response Time | sap.hana.db.service.response_time | Average Response Time of the Service (Host Process) |
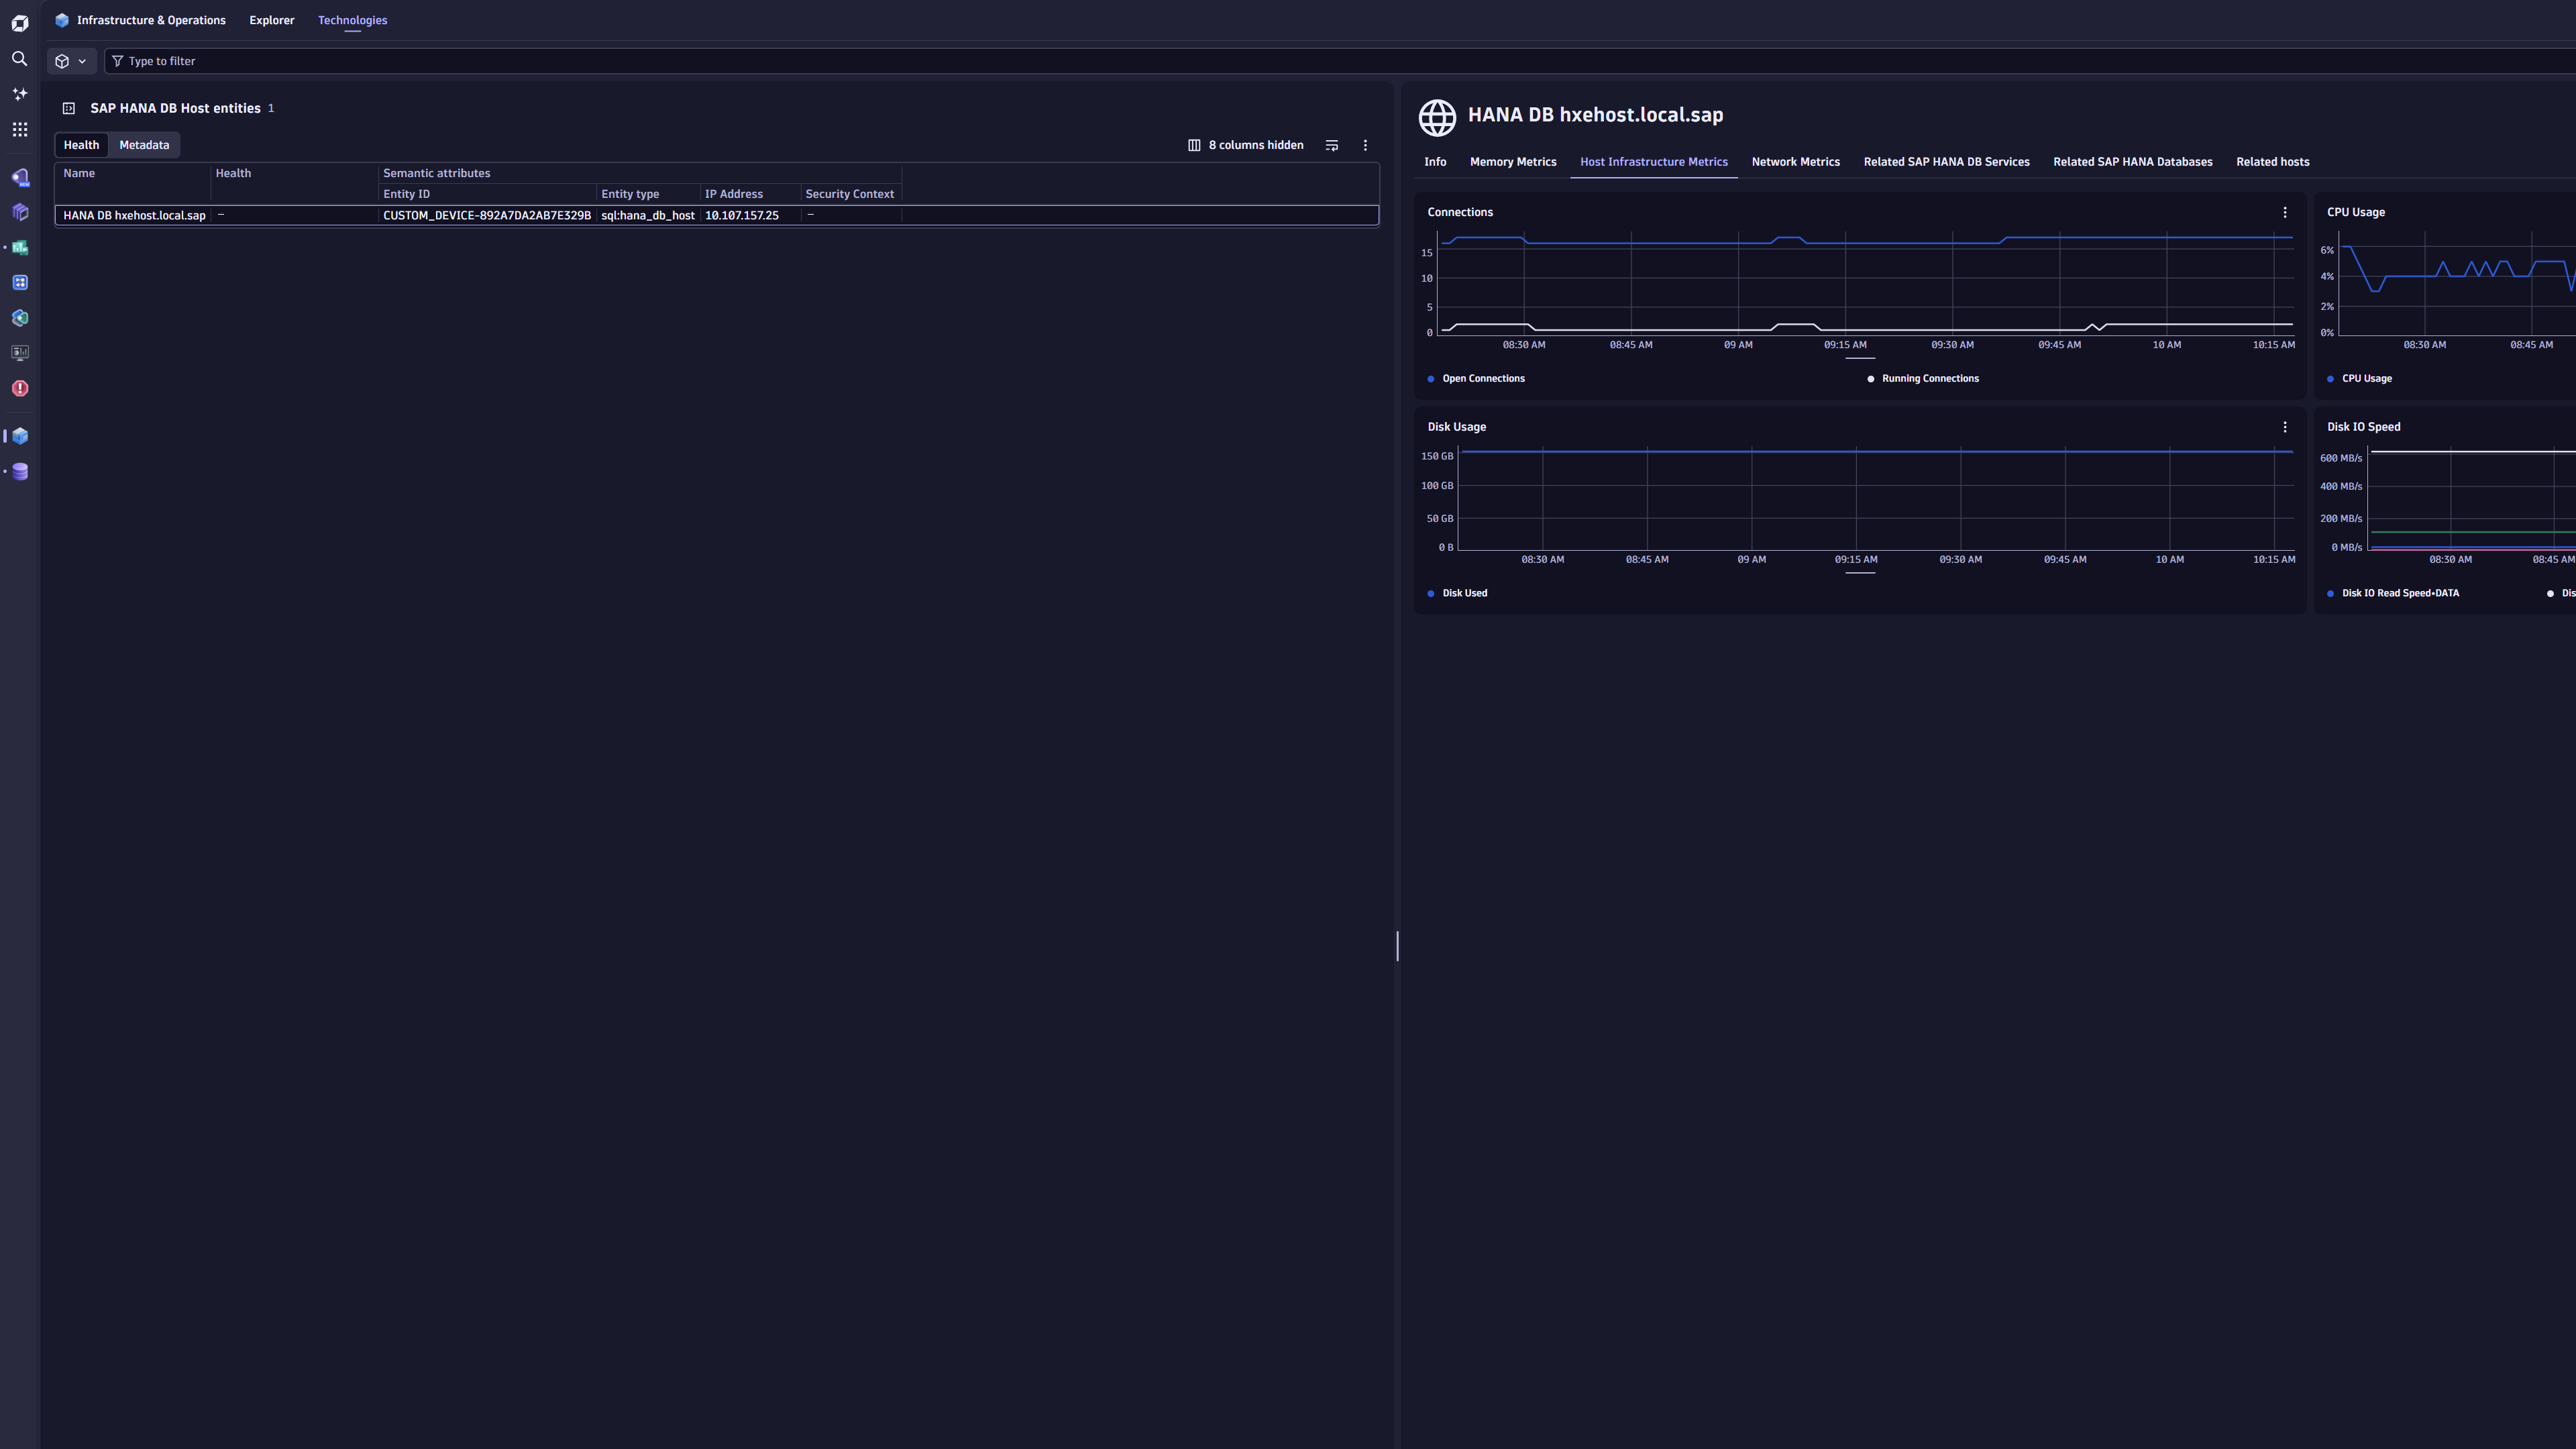
Host Infrastructure Metrics
| Metric name | Metric key | Description |
|---|---|---|
| Connection Usage | sap.hana.db.connection_usage | Used Connection Percentage |
| Transaction Usage | sap.hana.db.transaction_usage | Used Transaction Percentage |
| Active Transactions | sap.hana.db.transactions | Number of active transactions |
| Open Connections | sap.hana.db.host.open_connections | Number of Current Connections without an end time, no matter the connection status (RUNNING/IDLE/QUEUING) |
| Running Connections | sap.hana.db.host.running_connections | Number of Current Connections in the RUNNING state |
| Memory Used | sap.hana.db.host.memory_used | Host Memory Used |
| Memory Size | sap.hana.db.host.memory_size | Host Memory Size |
| Memory Usage | sap.hana.db.host.memory_usage | Host Memory Usage |
| CPU Usage | sap.hana.db.host.cpu | Host CPU Usage |
| Disk Used | sap.hana.db.host.disk_used | Host Disk Used |
| Disk Size | sap.hana.db.host.disk_size | Host Disk Size |
| Disk IO Read Speed | sap.hana.db.host.disk_io_read_speed | Disk IO Read Speed |
| Disk IO Write Speed | sap.hana.db.host.disk_io_write_speed | Disk IO Write Speed |
Host Infrastructure Network Rates
| Metric name | Metric key | Description |
|---|---|---|
| Network In | sap.hana.db.host.network_in | Host Network In |
| Network Out | sap.hana.db.host.network_out | Host Network Out |
Extended Expensive Statement Metrics
| Metric name | Metric key | Description |
|---|---|---|
| Expensive Statements Exceeding Memory Limit | sap.hana.db.sql.expensive_statements_exceeding_memory_limit.count | Number of Expensive SQL Statements that exceed the configured Memory Limit |
| Expensive Statements Exceeding Duration Limit | sap.hana.db.sql.expensive_statements_duration_limit.count | Number of Expensive SQL Statements that exceed the configured Duration Limit |
| Expensive Statements Exceeding Memory Limit | sap.hana.db.sql.expensive_statements_exceeding_memory_limit | Number of Expensive SQL Statements that exceed the configured Memory Limit |
| Expensive Statements Exceeding Duration Limit | sap.hana.db.sql.expensive_statements_duration_limit | Number of Expensive SQL Statements that exceed the configured Duration Limit |
Table Size vs Allocation Limit Usage
| Metric name | Metric key | Description |
|---|---|---|
| Table Size vs Allocated Limit Ratio | sap.hana.db.total_table_size_vs_allocation_limit_ratio | Ratio of used disk space by DB tables vs the Allocated Limit |
HANA License
| Metric name | Metric key | Description |
|---|---|---|
| Limit | sap.hana.db.license.limit | License Information including Licensed Size in GB |
Schema Disk Metrics
| Metric name | Metric key | Description |
|---|---|---|
| Disk Size By Schema | sap.hana.db.schema.disk_used_size | Absolute disk usage per schema |
| Disk Usage By Schema | sap.hana.db.schema.total_disk_size_percentage | Relative disk usage per schema |
Expensive Statements
| Metric name | Metric key | Description |
|---|
Base Metrics
| Metric name | Metric key | Description |
|---|---|---|
| Tracefile Count | sap.hana.db.tracefiles | Number of diagnostic files |
| Service Max Merge Dog Thread Duration | sap.hana.db.service.max_merge_dog_thread_duration | Max Duration of the Merge Dog Thread |
| Blocked Transactions | sap.hana.db.service.blocked_transactions | Number of Blocked Transactions |
| Current Transaction Locks | sap.hana.db.service.current_transaction_locks | Number of current transaction locks |
| Minimum SQL Plan Cache Hit Ratio | sap.hana.db.sql.min_sql_plan_cache_hit_ratio | Minimum SQL Plan Cache Hit Percentage |
Current Alerts
| Metric name | Metric key | Description |
|---|
Unloads Due to Low Memory
| Metric name | Metric key | Description |
|---|---|---|
| Low Memory Unloads | sap.hana.db.service.low_memory_unloads | Number of Unloads due to Low Memory |
SQL Plan Cache Size
| Metric name | Metric key | Description |
|---|---|---|
| SQL Plan Cache Size | sap.hana.db.current_sql_plan_cache_size | Current Number of SQL Plans in Cache |
Out Of Memory Events
| Metric name | Metric key | Description |
|---|
Expensive Statement Metrics
| Metric name | Metric key | Description |
|---|---|---|
| Total Expensive Statements | sap.hana.db.sql.total_expensive_statements | Total Number of Expensive SQL Statements |
Host Temp Heap Usage
| Metric name | Metric key | Description |
|---|---|---|
| Heap Temp Memory Usage | sap.hana.db.host.heap_temp_memory_usage | Heap - Temporary Memory Usage |
Audit Logs
| Metric name | Metric key | Description |
|---|
Savepoint Metrics
| Metric name | Metric key | Description |
|---|---|---|
| Savepoints Count | sap.hana.db.service.savepoints.count | Number of Savepoints |
| Savepoint Critical Phase Duration | sap.hana.db.service.savepoint_critical_phase_duration | Duration of Critical Phase in Savepoint creation |
| Savepoint Time Since Previous | sap.hana.db.service.savepoint_time_since_previous | Time since Previous Savepoint |
Active Prepared Statements
| Metric name | Metric key | Description |
|---|---|---|
| Active Statements | sap.hana.db.current_active_prepared_statements | Number of Current Active Prepared Statements |
Backup Metrics
| Metric name | Metric key | Description |
|---|---|---|
| Backup Count | sap.hana.db.backups | Number of Backups |
| Backup Size | sap.hana.db.backup.size | Estimated backup size |
| Backup Time Since Previous | sap.hana.db.backup.time_since_previous | Seconds since Previous Backup Type was taken. |
| Backup Duration | sap.hana.db.backup.duration | How long the different backup type took. |
| Failure Count | sap.hana.db.backup.failures.count | Backup Failure Count |
Table Information
| Metric name | Metric key | Description |
|---|---|---|
| Table Locks | sap.hana.db.service.table.locks | Number of Locks On a Table |
| Record Count | sap.hana.db.service.table.records | Number of Records in a Table |
| Table Size | sap.hana.db.service.table.size | Size of a Table |
FAQ
What is the Custom Metric Usage of this extension?
The formula for consumption of the extension is:
Per database and host: 56 + Schema Disk Metrics Feature Set + Table Information Feature Set + (6 * <# of Services>)
Where:
- Schema Disk Metrics Feature Set =
2 * <# of Schemas> - Table Information Feature Set =
3 * <# of Schemas> * <Avg # of Tables per Schema> - The
# of Servicesis typically around 9, including processes such ascompileserver,indexserver,nameserver,webdispatcher, andxs*processes.