Ingest NetFlow records into Dynatrace
- Latest Dynatrace
- How-to guide
- 2-min read
- Published Oct 06, 2025
Network observability provides the necessary visibility to understand how applications interact with the underlying network. It allows teams to identify and address issues more effectively by starting with device health monitoring and extending to flow data collection—such as NetFlow—to track network usage. This approach actively supports performance optimization, enhances security, and streamlines troubleshooting efforts.
This guide shows you how to ingest NetFlow records into Dynatrace by setting up the collector and using  Dashboards and
  Notebooks to analyze flow data.
Why monitor network flow with Dynatrace?
Ingesting network flows into Dynatrace immediately puts this data in context. The data contained in the network flows complements supported network use cases by linking flow volume and directions to devices and interfaces. The network flow data can be compared with process-to-process data to help solve network-induced application problems.
How does Dynatrace as a platform support NetFlow ingestion?
Dynatrace supports network flow protocols such as NetFlow, sFlow, and IPFIX through a fully supported version of the OpenTelemetry Collector. A dedicated network flow receiver enables seamless ingestion of flow data into the Dynatrace platform for analysis and visualization.
Prerequisites
- A Dynatrace Collector distribution with NetFlow receiver.
- The Dynatrace API endpoint URL to which the data should be exported.
- An API token with the Ingest logs (
logs.ingest) and Ingest metrics (metrics.ingest) scopes. For details, see OpenTelemetry Collector self-monitoring.
See Collector Deployment and Collector Configuration on how to set up your Collector with the configuration below.
Steps
In this example, we deploy using Docker to keep the demonstration simple. For production use cases, we recommend deploying as a gateway on a Kubernetes cluster. For details, see Configure OpenTelemetry Collector for Kubernetes monitoring.
-
To configure a Dynatrace Collector instance, create a file called
otel-collector-config.yamland add the following configuration:receivers:netflow:scheme: netflowport: 2055sockets: 16workers: 32netflow/sflow:scheme: sflowport: 6343sockets: 16workers: 32processors:batch:send_batch_size: 2000timeout: 30sexporters:otlphttp:endpoint: "${env:DT_ENDPOINT}"headers:Authorization: "Api-Token ${env:DT_API_TOKEN}"service:pipelines:logs:receivers: [netflow, netflow/sflow]processors: [batch]exporters: [otlphttp]telemetry:logs:level: debugCheck the NetFlow receiver documentation for the available configuration options.
-
Create an
.envfile to add theDT_ENDPOINTandDT_API_TOKENvariables.DT_ENDPOINTis the Dynatrace API server endpoint. It contains the base URL of the Dynatrace API endpoint. For example,https://{your-environment-id}.live.dynatrace.com/api/v2/otlp. For more details, see Integrate OneAgent on Azure App Service for Linux and containers.DT_API_TOKENcontains the API token.
Ensure your
.envfile is properly secured and not exposed to unauthorized access, as it contains sensitive information. -
Create an access token by going to Access Tokens > Generate new token and selecting Ingest logs as a scope.
-
Run the Collector image in Docker using the following command:
docker run -p 2055:2055 --env-file ./.dt_token.env -v $(pwd)/otel-collector-config.yaml:/etc/otelcol/otel-collector-config.yaml ghcr.io/dynatrace/dynatrace-otel-collector/dynatrace-otel-collector:0.33.0 --config=/etc/otelcol/otel-collector-config.yamlOnce the process is completed, you can start running and processing data.
If you want the process to run in the background, you can kill it and run again with the
-doption. -
Direct your network devices to send NetFlow records to the Collector.
The network device configuration is vendor-specific. It must indicate the Dynatrace endpoint's IP address and the matching UDP port.
Data visualization and analysis
Log analysis
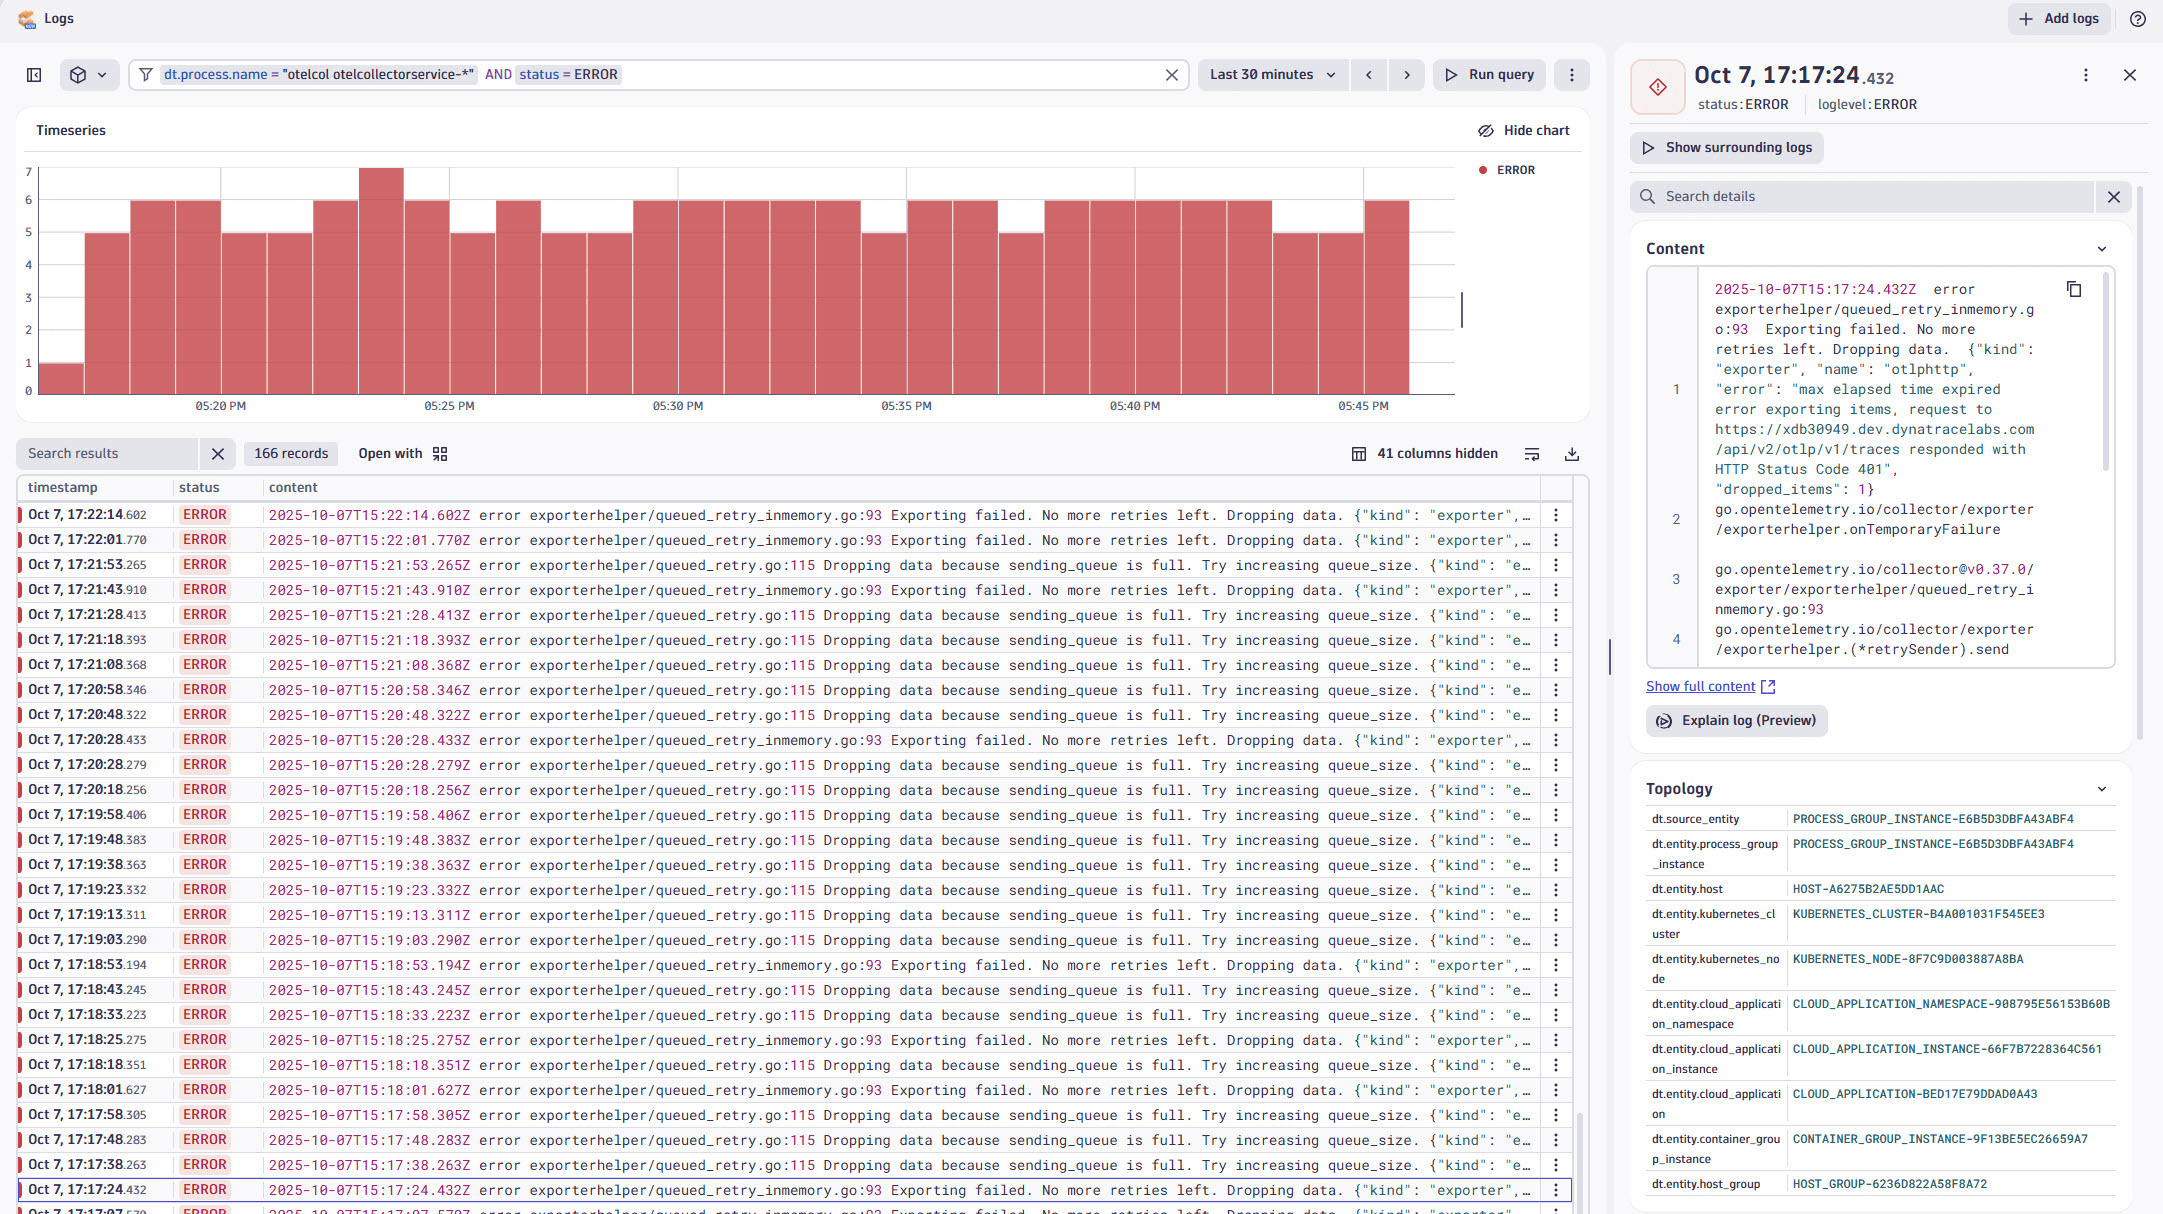
NetFlow data is ingested as log records, which can be queried and visualized using DQL. You can use  Logs to look for container logs captured by OneAgent for the Collector:
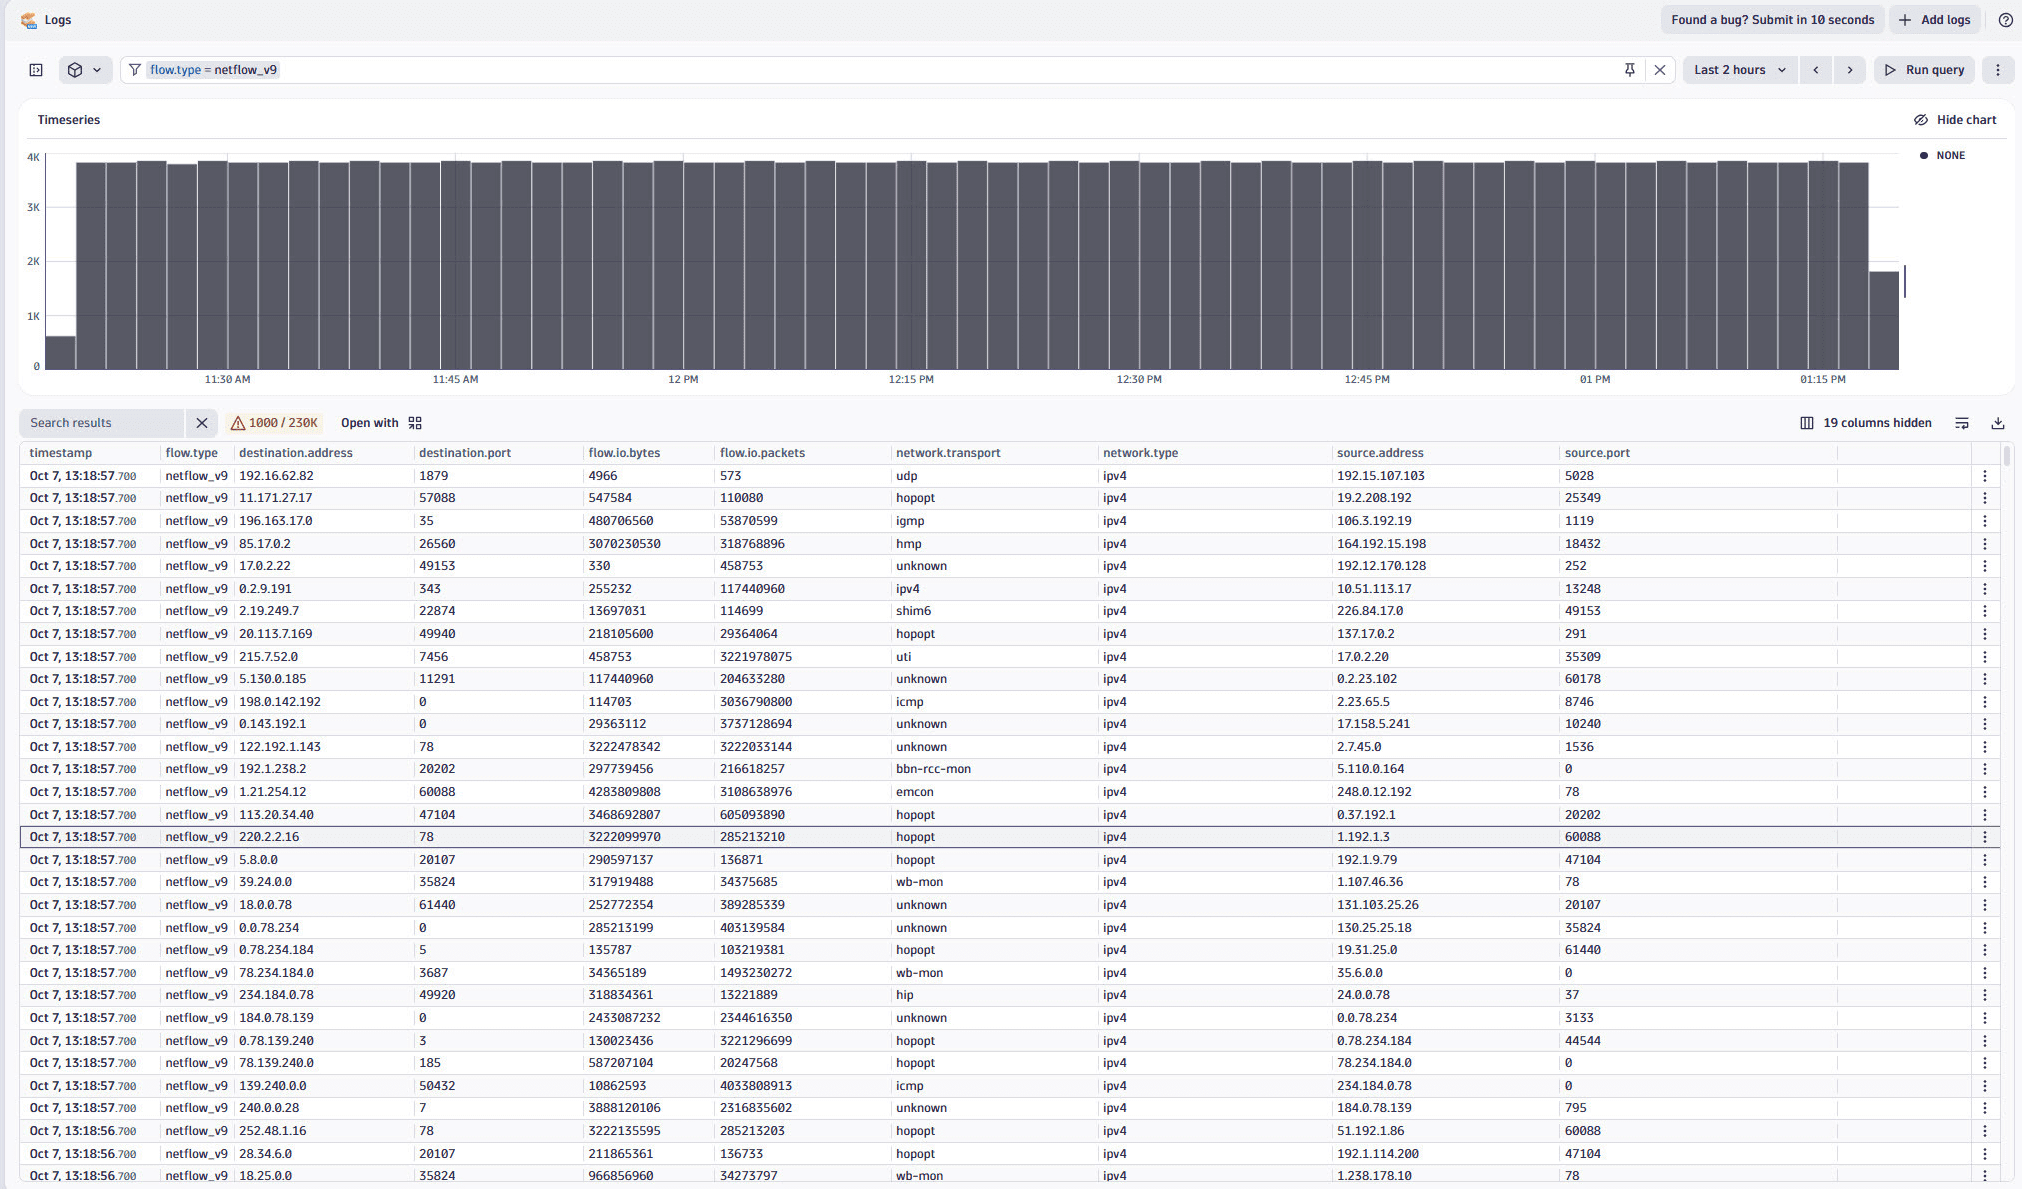
Similarly, Logs can help you see that traffic is indeed flowing:
Dashboards
Dashboards provides a ready-made NetFlow Overview dashboard as an entry point to explore and visualize NetFlow data. It includes pre-configured charts and metrics to analyze network traffic, such as top sources, destinations, conversations, and port usage.
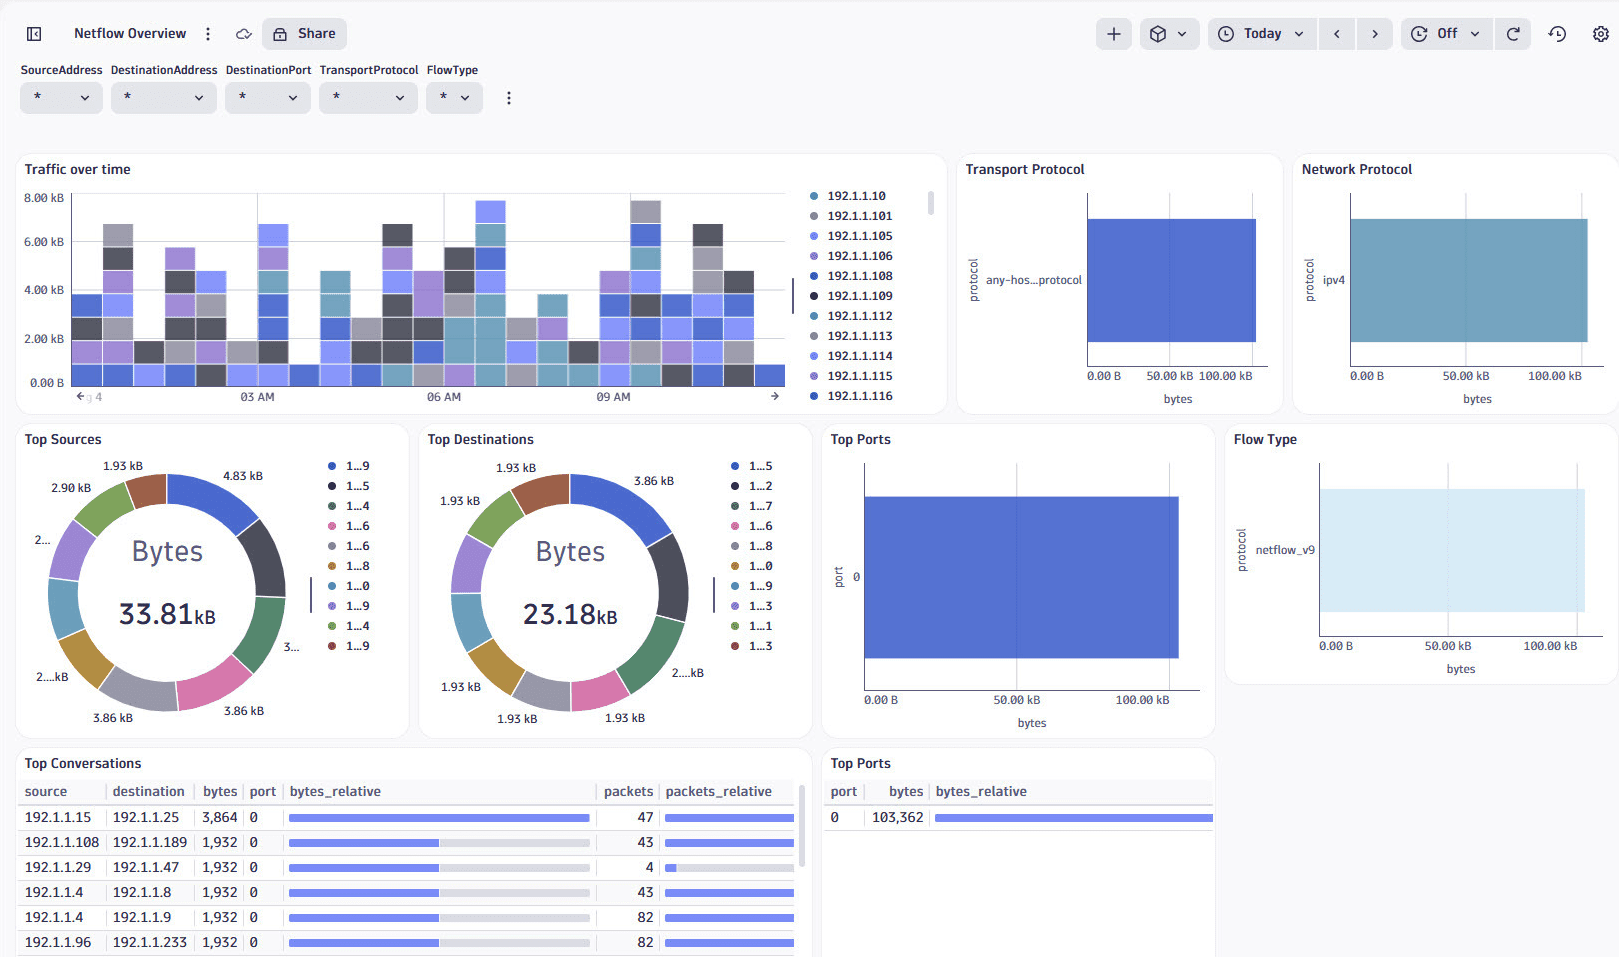
The dashboard can be used as a base for further customizations. You can also create custom dashboards to visualize NetFlow data using various chart types.
Notebooks
Notebooks allows you to run queries and visualize NetFlow data interactively. You can open a new notebook from Logs by going to Open with and selecting Notebooks.
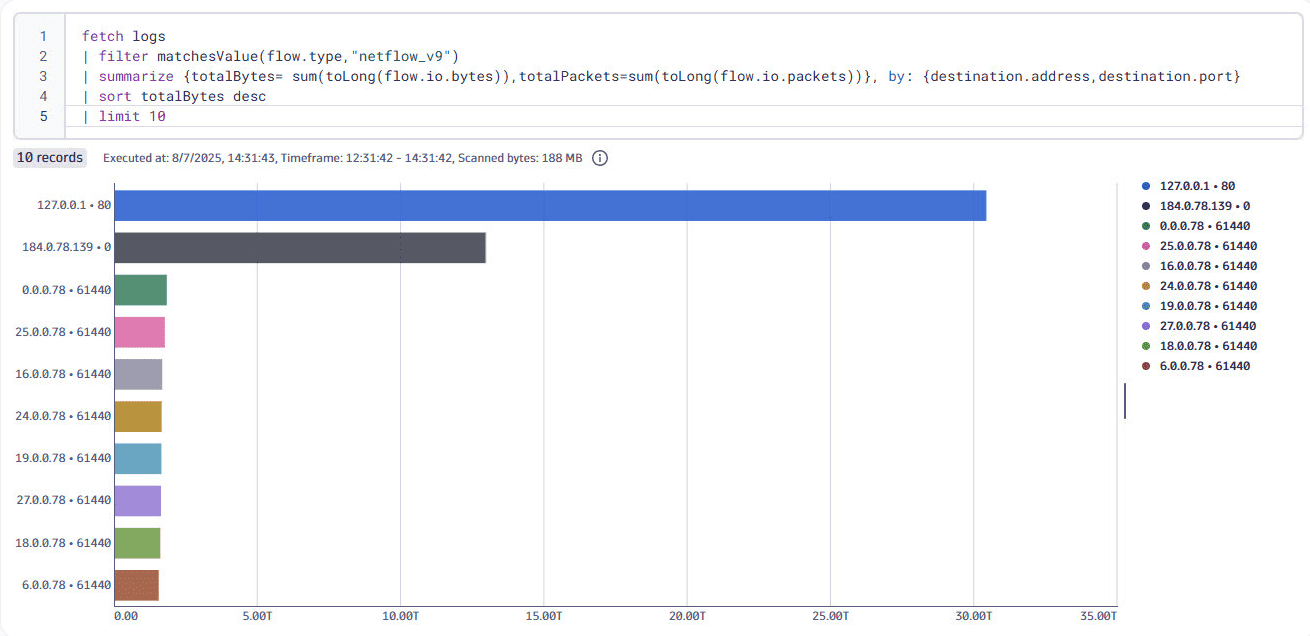
DQL query example
Using this DQL query, you can get a summary of the bytes by destination IP and port:
fetch logs| filter matchesValue(flow.type, "netflow_v9")| summarize {totalBytes= sum(toLong(flow.io.bytes)),totalPackets=sum(toLong(flow.io.packets))}, by: {destination.address,destination.port}| sort totalBytes desc| limit 10