Kubernetes Monitoring Statistics extension
- Latest Dynatrace
- Extension
- Published Oct 27, 2025
Troubleshoot your Dynatrace Kubernetes monitoring and Prometheus integration.
Get started
Overview
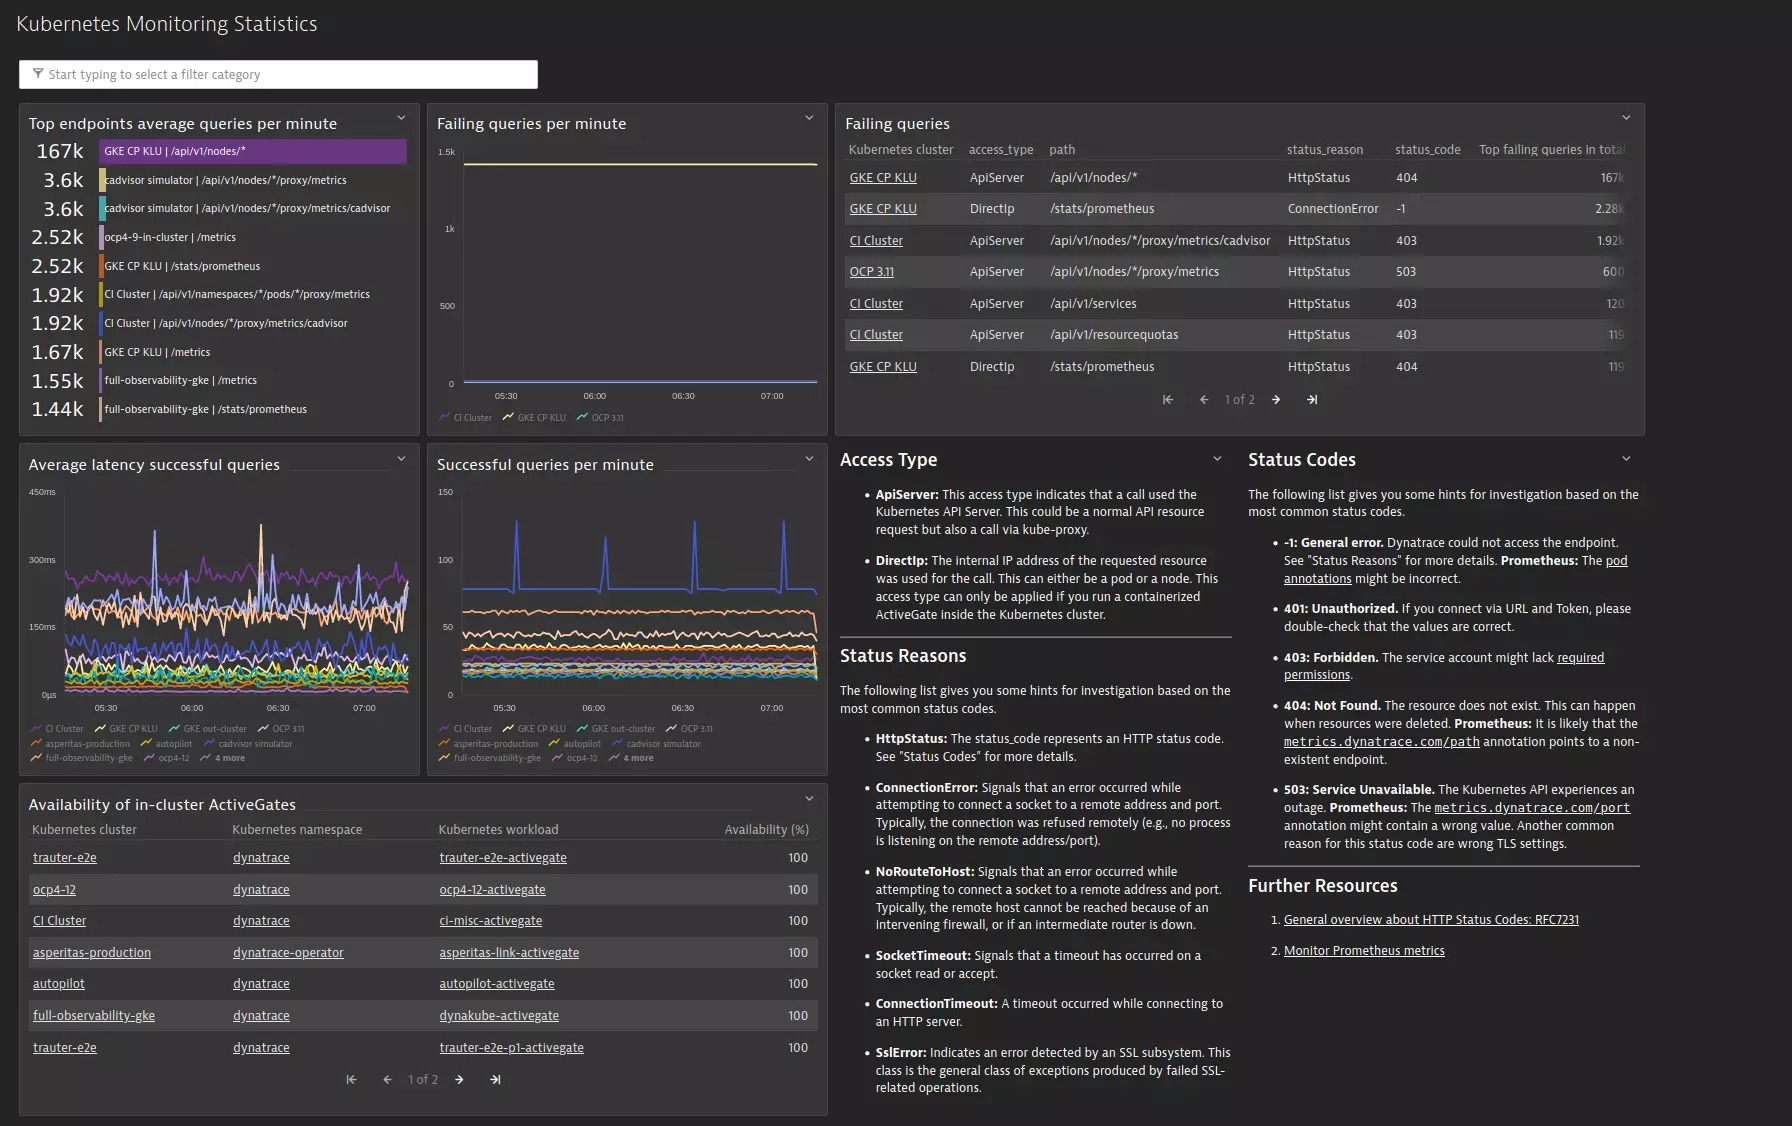
Investigate Kubernetes API server interactions with this ready-made dashboard.
Troubleshoot your Kubernetes and Prometheus integration setup with a ready-made dashboard. The extension allows you to investigate interactions between Dynatrace and the Kubernetes API server.
Use cases
- Alerts you about unusual behavior of the Kubernetes API, such as slow response times. These alerts help you during troubleshooting of your Prometheus integration in Kubernetes.
- Provides you with self-monitoring statistics for all the Kubernetes clusters you already monitor within your Dynatrace environment.
- Troubleshoot your Kubernetes monitoring setup.
- Troubleshoot your Prometheus integration setup.
- Get detailed insights into queries from Dynatrace to the Kubernetes API.
- Receive alerts when your Kubernetes monitoring setup experiences issues.
- Get alerted on slow response times of your Kubernetes API.
If you want to monitor additional Kubernetes environments, please refer to our Kubernetes extension.
Compatibility information
- Cluster version 1.236+
- ActiveGate version 1.235+
Activation and setup
To enable the extension, find Kubernetes Monitoring Statistics in the Dynatrace Hub.
Once you have enabled the extension, you need to set up custom events:
- In your Dynatrace environment, navigate to Settings > Anomaly detection > Custom events for alerting.
- Find the following Kubernetes Monitoring Statistics events:
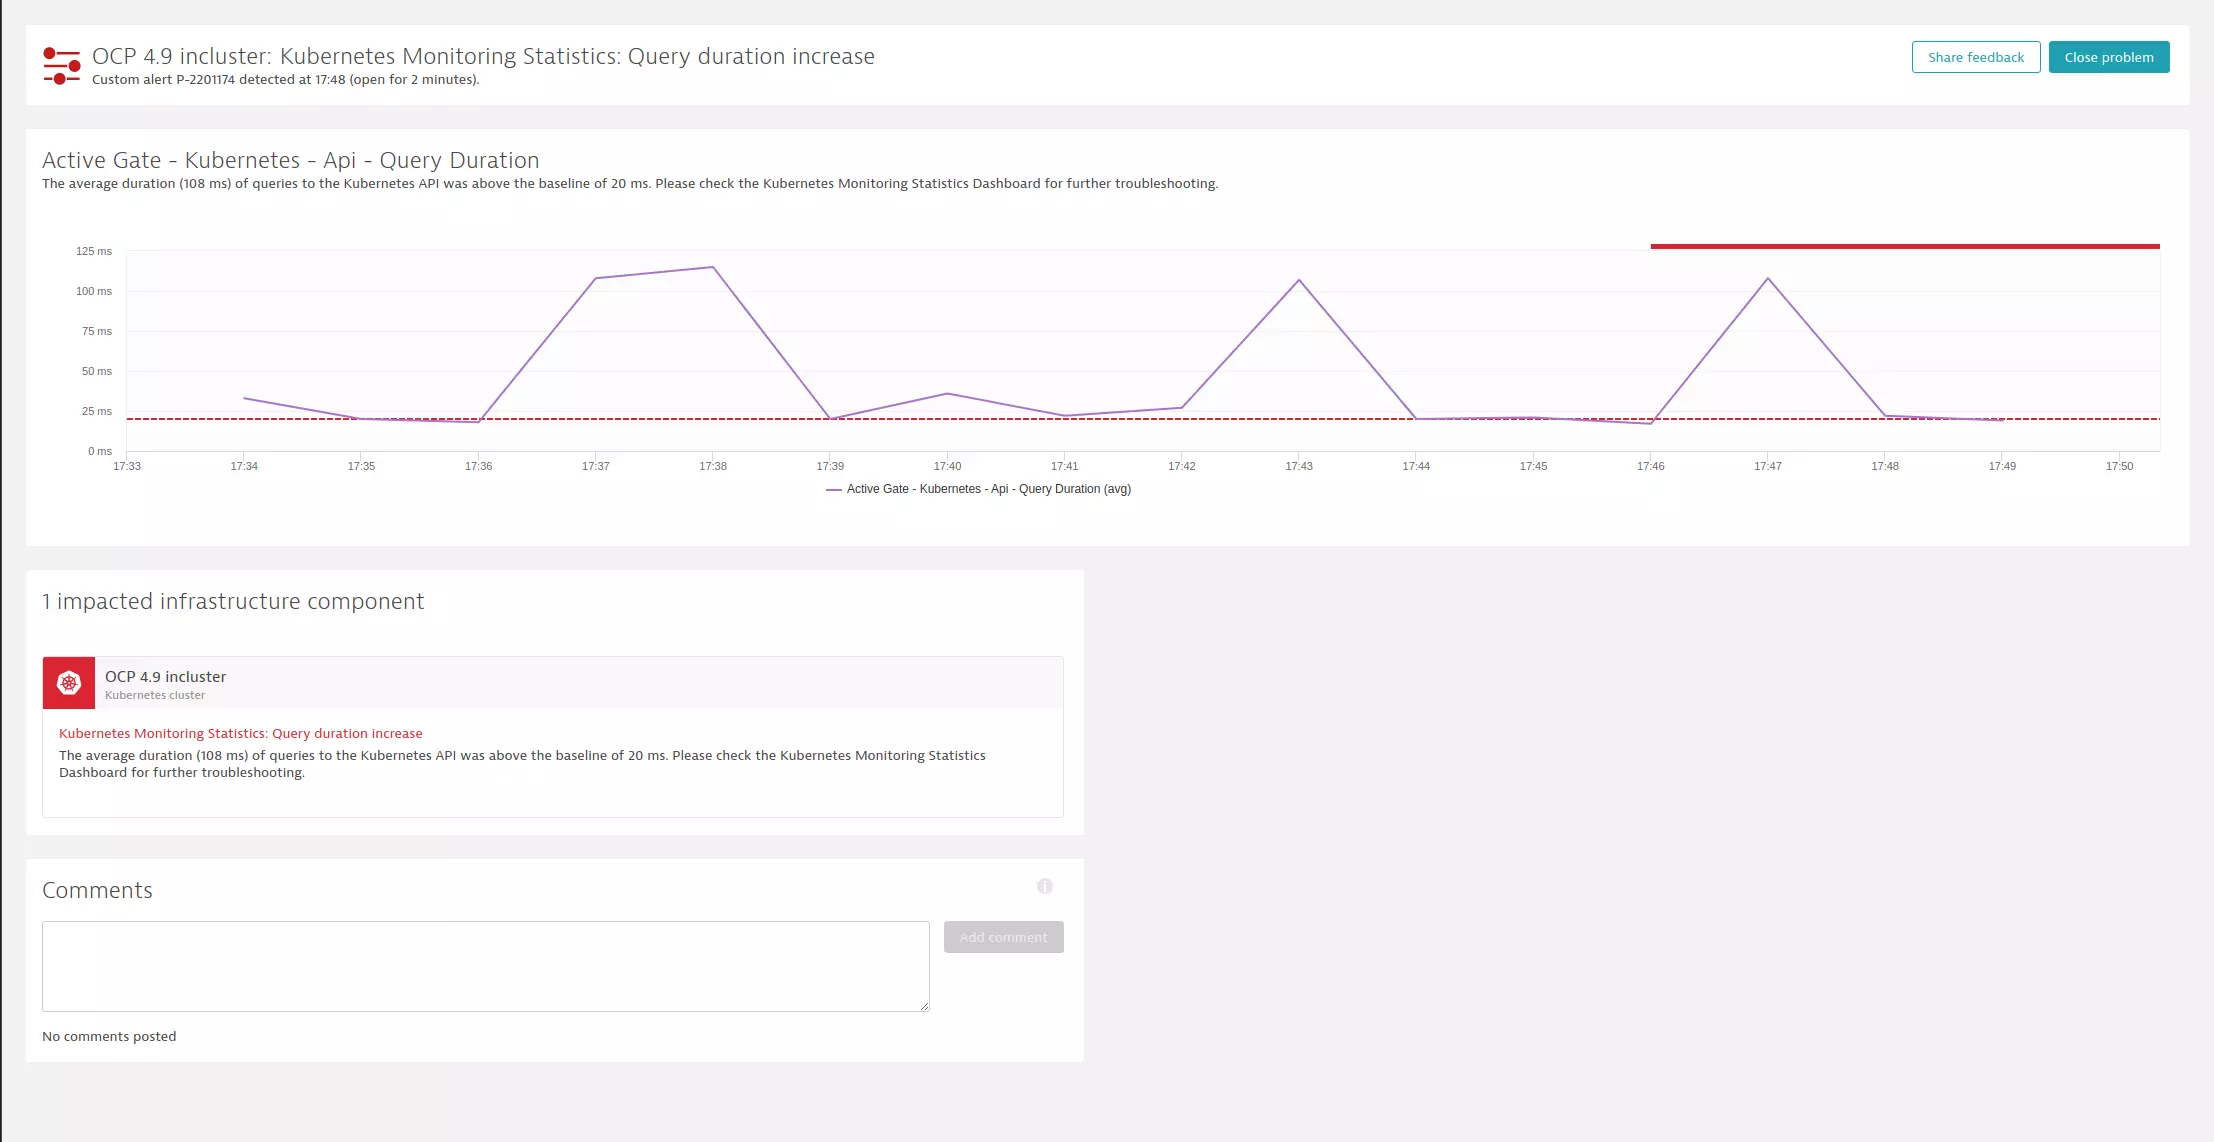
- Query duration increase: Notifies you if we observe an unusual increase in response times of the Kubernetes API.
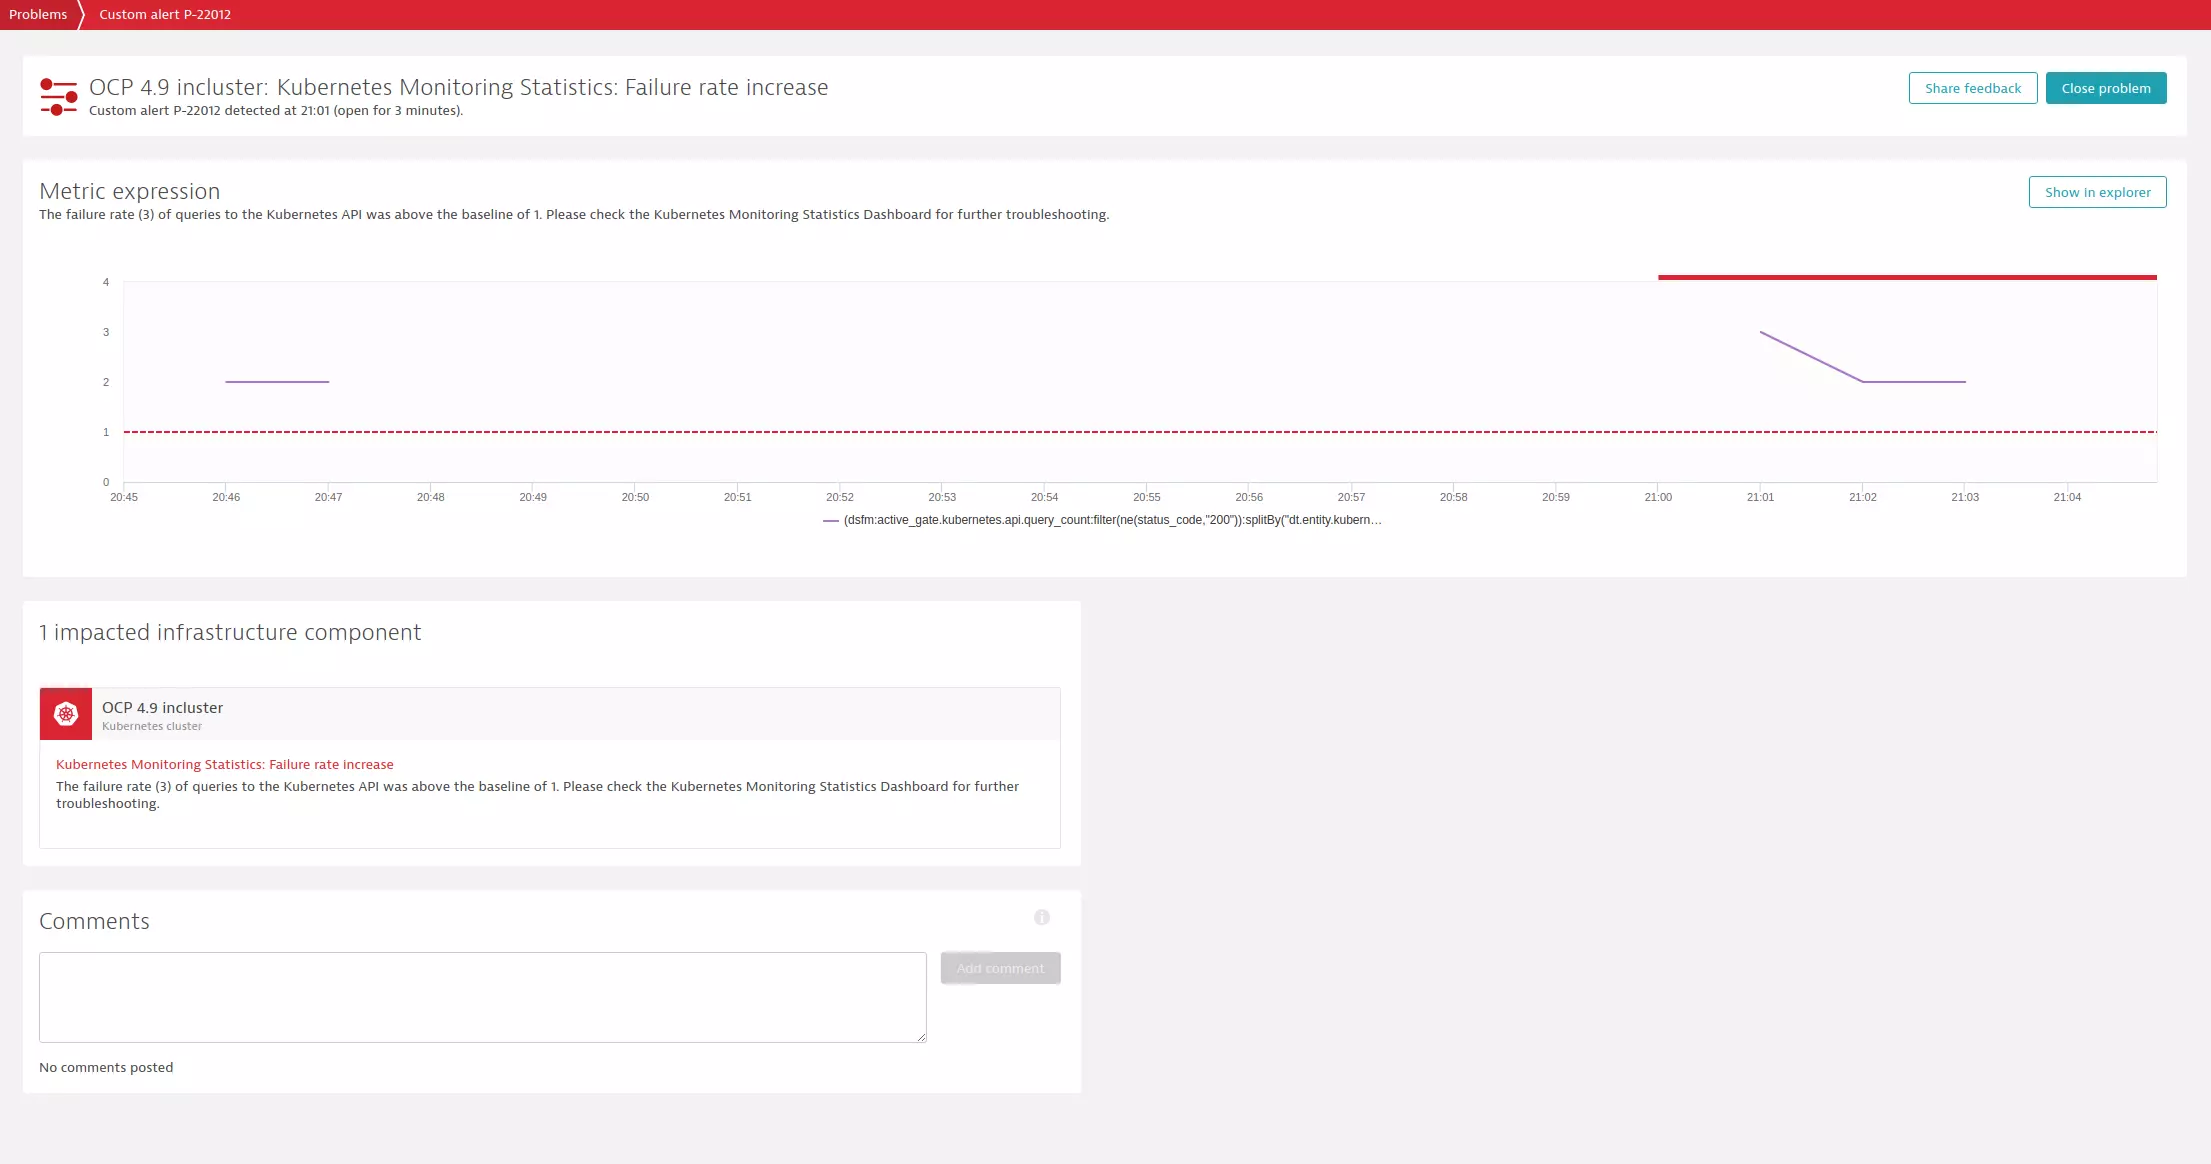
- Failure rate increase: Notifies you if we observe an unusual high rate of failing requests to the Kubernetes API.
- If necessary, select Edit to customize the event conditions.
- Activate an alert to get problem notifications.
Feature sets
When activating your extension using monitoring configuration, you can limit monitoring to one of the feature sets. To work properly the extension has to collect at least one metric after the activation.
In highly segmented networks, feature sets can reflect the segments of your environment. Then, when you create a monitoring configuration, you can select a feature set and a corresponding ActiveGate group that can connect to this particular segment.
All metrics that aren't categorized into any feature set are considered to be the default and are always reported.
A metric inherits the feature set of a subgroup, which in turn inherits the feature set of a group. Also, the feature set defined on the metric level overrides the feature set defined on the subgroup level, which in turn overrides the feature set defined on the group level.
