InterSystems IRIS (Remote) extension
- Latest Dynatrace
- Extension
- Published Oct 27, 2025
Get started
Overview
Gain insights into the performance of your InterSystems IRIS instances.
Use this extension to connect to and collect data from the InterSystems IRIS REST API.
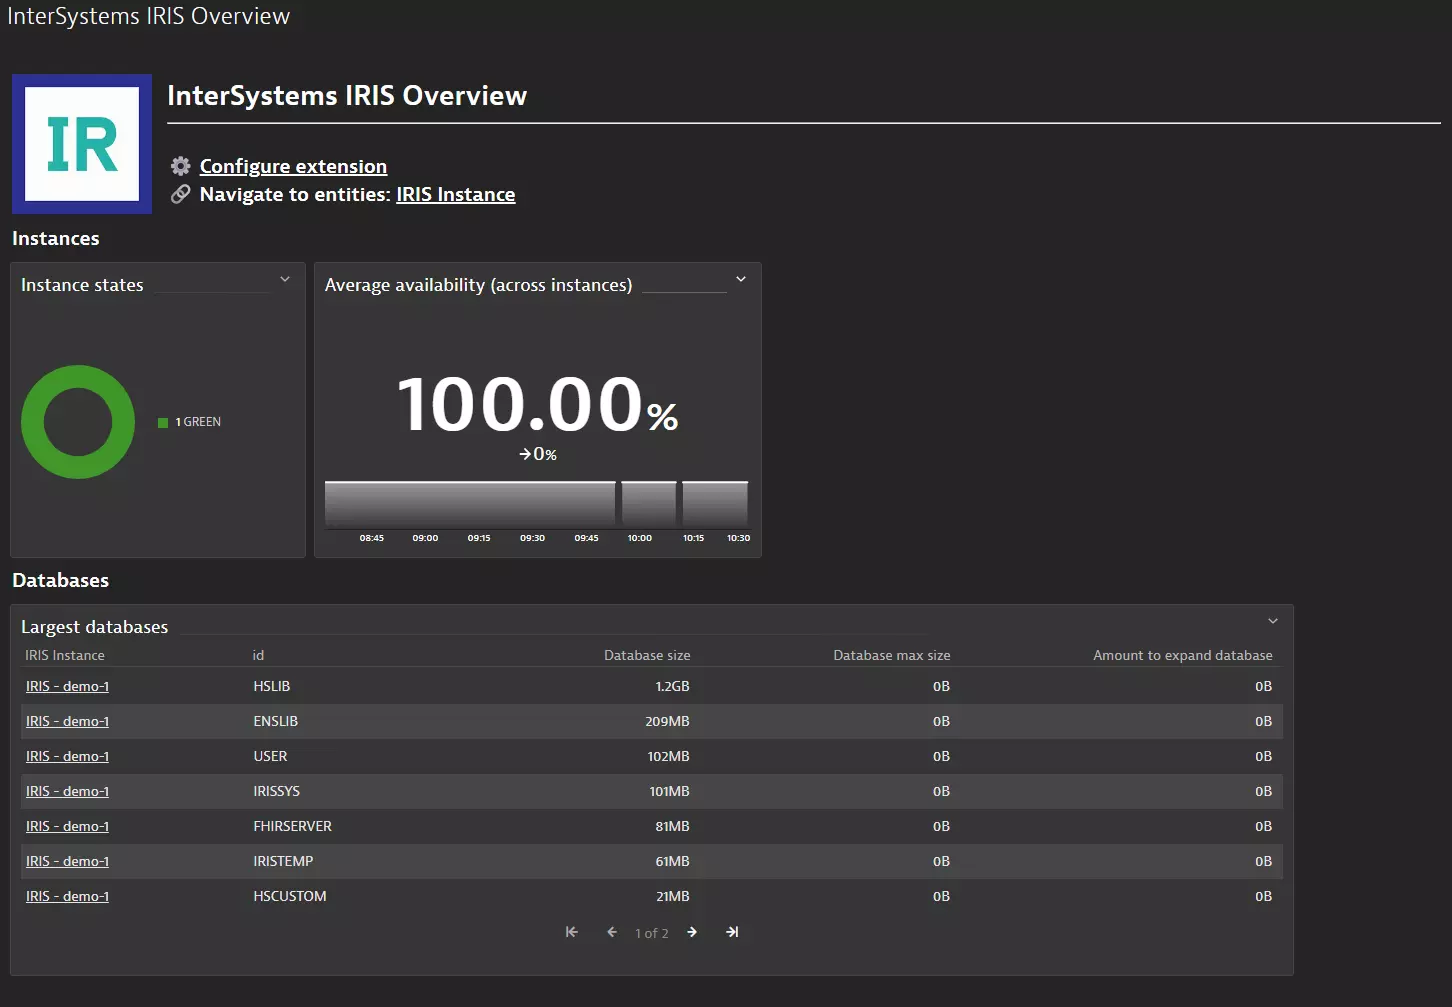
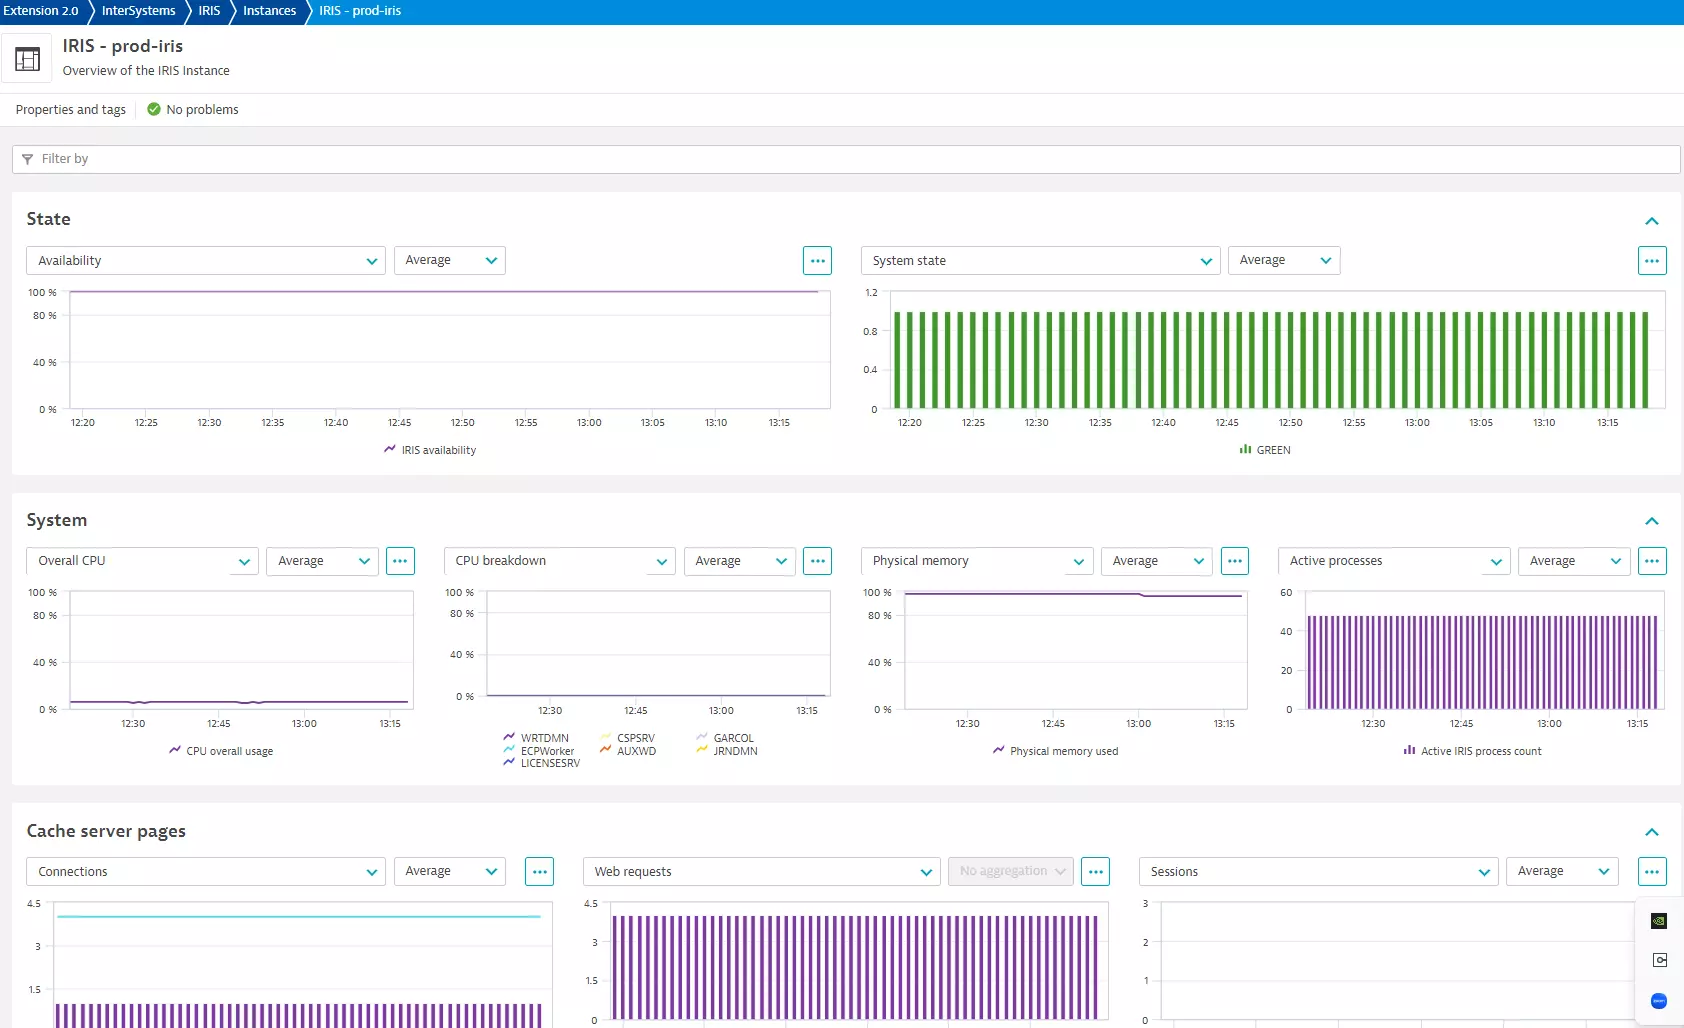
An InterSystems IRIS overview dashboard is included with the extension. This includes links to access the IRIS instance entities that are detected.
Use cases
- View metrics and events in context with your OneAgent collected data in the Dynatrace UI.
- Use powerful charting and dashboarding features.
- Allow the Davis® AI causation engine to generate baselines and alert you when anomalies are detected in designated metrics.
Requirements
- The IRIS
/api/monitorendpoint is reachable. - If authentication is enabled, you have the necessary user credentials to reach metrics and alerts API endpoints.
Activation and setup
To enable the extension, find InterSystems IRIS (Remote) in the Dynatrace Hub.
Once activated in your environment you can create monitoring configurations. Each monitoring configuration can have up to 100 IRIS instances configured.
-
First, select the desired ActiveGate group that will run the monitoring configuration.
-
For each cluster, configure a IRIS instance endpoint:
- URL: The full URL to the OnTap monitor REST API, such as
http://<irisinstance>:80/api/monitor/. - Alias: An alias for this instance. (By default, this is the hostname in the URL).
- Username: Optional username for authentication.
- Password: Optional password for authentication.
- URL: The full URL to the OnTap monitor REST API, such as
-
At the monitoring configuration level, the following configurations apply to all endpoints:
-
Proxy:
- Address: The address to reach the proxy.
- Proxy username: If authentication is required.
- Proxy password: If authentication is required.
-
Verify SSL certificate: If connected to an HTTPS endpoint the certificate is verified.
-
-
The Log level is set at the monitoring configuration level and applies to all endpoints. The default log level is
INFODEBUGis only needed when investigating issues with support. -
Finally, enable the desired feature sets.
Details
Capabilities
Metrics are associated with different feature sets that can be enabled or disabled as needed. Metrics are collected once per minute.
Default metrics
The following metrics cannot be disabled:
- IRIS availability: The availability of the configured API as seen by the extension.
- CPU percent used: Percent of CPU usage by InterSystems IRIS process type.
- CPU overall usage: Percent of CPU usage for all programs within the operating system.
- Physical memory used: Percent of physical memory (RAM) currently in use.
- Percent used of max page file space: Percent of maximum allocated page file space used.
- Physical database blocks read from disk rate: Physical database blocks read from disk per second.
- Physical database blocks written to disk rate: Physical database blocks written to disk per second.
- Active IRIS process count: Total number of active InterSystems IRIS processes.
- System state: Current reported system state (
GREEN,RED,YELLOW, orHUNG). - Open transactions: Number of open transactions on the current instance.
- Average duration of open transactions: Average duration of open transactions on the current instance.
- IRIS cache efficiency: Ratio of global references to physical reads and writes, as a percent.
- Longest open transaction duration: Duration of longest currently open transaction on the current instance.
Cache server pages
- Web requests: Number of web requests served by the web gateway server.
- Current web server gateway connections: Number of current connections to this server by the web gateway server.
- Current connections processing a request: Number of current connections to this server by the web gateway server that are processing a web request.
- Connections reserved for state-aware apps: Number of current connections to this server by the web gateway server that are reserved for state-aware applications (Preserve mode
1). - Web gateway server latency: Amount of time to obtain a response from the web gateway server when fetching
iris_csp_metrics. - Active web sessions: Number of currently active web session IDs on this server.
Database
- Amount to expand database: Amount by which to expand the database.
- Free space: Free space available in database. This value is updated once per day.
- IRIS DB latency: Amount of time to complete a random read from the database.
- Database max size: Maximum size to which the database can grow.
- Database size: Size of the database.
- Database directory space free: Free space available on the database directory's storage volume.
- IRIS disk percent full: Percent of space filled on the database directory's storage volume.
Enterprise cache protocol
- Current ECP active client connections: Total number of active client connections on this ECP application server.
- Max client connections from this ECP app server: Maximum active client connections from this ECP application server.
- ECP active client connections rate: Total active client connections to this ECP data server per second.
- Synchronized ECP servers: Number of servers that were synchronized when this ECP application server synchronized with its configured ECP data servers.
- ECP server latency: Latency between the ECP application server and the ECP data server.
- Max client connections to this ECP data server: Maximum active client connections to this ECP data server.
Global resources
- Aseizes on global resource rate: Number of Aseizes on the global resource, per second.
- Nseizes on global resource rate: Number of Nseizes on the global resource, per second.
- Refs to globals on local DBs rate: Number of references to globals located in local databases, per second.
- Refs to globals on remote DBs rate: Number of references to globals located in remote databases, per second.
- Seizes on global resource rate: Number of seizes on the global resource per second.
- Updates to globals on local DBs rate: Number of updates (
SETandKILLcommands) to globals located on local databases, per second. - Updates to globals on remote DBs rate: Number of updates (
SETandKILLcommands) to globals located on remote databases, per second.
Journal
- Journal block write rate: Journal blocks written to disk, per second.
- Journal entries per second: Journal entries, per second.
- Free space on journal directory: Free space available on each journal directory's storage volume, in megabytes.
- Journal file size: Current size of each journal file, in megabytes.
License
- Licenses not in use: Number of licenses not currently in use.
- Licenses in use: Number of licenses currently in use.
- Licenses percent used: Percent of licenses currently in use.
Object
- Asiezes on object resource rate: Number of Aseizes on the object resource, per second.
- Objects deleted rate: Number of objects deleted, per second.
- Objects referenced rate: Number of object references per second, in process memory.
- Objects loaded from disk rate: Number of objects loaded from disk, per second, not in shared memory.
- Number of objects loaded from disk per second, not in shared memory: Number of object references not found in memory, per second.
- Initialized objects rate: Number of objects initialized per second.
- Siezes on object resource rate: Number of seizes on the object resource per second.
Routine
- Asiezes on routine resource rate: Number of Aseizes on the routine resource per second.
- Routine calls to globals on remote DBs rate: Number of local routine calls per second to globals located on remote databases, per second.
- Routine call memory misses rate: Number of routines calls not found in memory, per second.
- Remote routine calls rate: Number of remote routine calls, per second.
- Routines locally loaded or saved to disk rate: Number of routines locally loaded from or saved to disk, per second.
- Routines remotely loaded or saved to disk rate: Number of routines remotely loaded from or saved to disk, per second.
- Seizes on the routine resource rate: Number of seizes on the routine resource, per second.
System alerting & monitoring
- Time to collect iris_db sensors: Amount of time it took to collect iris_db* sensors.
- Time to collect iris_jrn sensors: Amount of time it took to collect iris_jrn* sensors.
- Time to collect iris_sql sensors: Amount of time it took to collect iris_sql* sensors.
- Time to collect iris_wqm sensors: Amount of time it took to collect iris_wqm* sensors.
System alerts
- Alerts posted to messages log: The number of alerts posted to the messages log.
- New system alerts available: Whether new alerts are available on the
/api/monitor/alertsendpoint.
If you have the 'system-alerts' feature set enabled, the alerts API endpoint will be polled and the alerts reported in Dynatrace as log events.
Work queue management
- Average running worker jobs: Average number of worker jobs running logic that are not blocked.
- Average commands in WQM category rate: Average number of commands executed in this work queue management category, per second.
- Average global references in WQM category rate: Average number of global references run in this work queue management category, per second.
- Max active workers since last log entry: Maximum number of active workers since the last log entry was recorded.
- Max entries in MQM queue since last log: Maximum number of entries in the queue of this work queue management category since the last log.
- Average idle worker jobs: Average number of idle worker jobs waiting for a group to connect to and do work for.
Write daemon
- DB buffers written in current cycle and also prior: Number of database buffers the write daemon wrote during the most recent cycle that were also written in the prior cycle.
- DB buffers written in recent cycle: Number of database buffers the write daemon wrote during its most recent cycle.
- Write daemon cycle completion time: Amount of time the most recent write daemon cycle took to complete.
- Processes holding global buffers: Number of processes actively holding global buffers at start of the most recent write daemon cycle.
- Size of database buffers written in recent cycle: Size of database buffers the write daemon wrote during its most recent cycle.
- Write daemon inactive time before cycle: Amount of time that the write daemon was inactive before its most recent cycle began.
- In-memory buffers used: Number of in-memory buffers the write daemon used at the start of its most recent cycle.
- In-memory buffers written: Number of in-memory buffers the write daemon wrote during its most recent cycle.
- Time writing to WIJ file: Amount of time the write daemon spent writing to the WIJ file during its most recent cycle.
- Time writing buffers to DBs: Amount of time the write daemon spent writing buffers to databases during its most recent cycle.
Write image journal
- WIJ physical block writes per second: WIJ physical block writes per second.
Undocumented metrics
The list of known or documented metrics in IRIS is available in the InterSystems documentation.
It is possible that there are additional metrics on the Prometheus style page that we collect these metrics from. If you enable this feature set, undocumented metrics will be collected and reported but without any metadata (such as display name and unit). They will still be available for charting and alerting as needed. If you would like to configure metadata for these you can do so by editing them in the Metrics page.
Log events
This extension will report log events in the following situations:
- When there are alerts available on the IRIS API alerts endpoint and the system alerts feature set is enabled.
- When the extension cannot connect to the configured IRIS API endpoint. An event is reported each minute until the issue is resolved and a successful connection occurs.
Licensing and cost
The use of this extension incurs consumption of your Dynatrace license based on the data that the extension ingests. The details of license consumption will depend on which licensing model you are using, whether DPS or a Classic License.
Metrics
Metrics powered by Grail (DPS)
License consumption is based on the number of metric data points ingested. The following formula will provide approximate annual data points ingested assuming all feature sets are enabled:
(64 + (1 x processTypes) + (5 x ipAddress:port) + (7 x databases) + (2 x journalTypes) + (3 x smhPurpose) + (7 x namespaces) + (6 x wqmCategories)) x 60 min x 24 h x 365 days data points/year
Classic licensing
For Dynatrace classic licenses, metric ingestion consumes Davis Data Units (DDUs) at the rate of .001 DDUs per metric data point. For more information, see DDUs for metrics.
To estimate annual DDU consumption, multiply the result of the formula in Metrics powered by Grail (DPS) by .001.
Logs
Log Management and Analytics (DPS)
License consumption is based on the size (in bytes) of data ingested, processed, retained, and queried. Therefore, there is not a single formula to estimate the total consumption from this extension.
For more information about the consumption of Log Management and Analytics, see Logs powered by Grail (DPS).
Classic license
For Dynatrace classic licenses, log record ingestion consumes Davis Data Units (DDUs) at the rate of 100 DDUs per gigabyte of log records ingested (0.0005 DDUs per ingested log record).
Multiply the estimated number of ingested log records by .0005 to estimate DDU usage from log records.
Feature sets
When activating your extension using monitoring configuration, you can limit monitoring to one of the feature sets. To work properly the extension has to collect at least one metric after the activation.
In highly segmented networks, feature sets can reflect the segments of your environment. Then, when you create a monitoring configuration, you can select a feature set and a corresponding ActiveGate group that can connect to this particular segment.
All metrics that aren't categorized into any feature set are considered to be the default and are always reported.
A metric inherits the feature set of a subgroup, which in turn inherits the feature set of a group. Also, the feature set defined on the metric level overrides the feature set defined on the subgroup level, which in turn overrides the feature set defined on the group level.
write-daemon
| Metric name | Metric key | Description |
|---|---|---|
| DB buffers written in current cycle and also prior | iris_wd_buffer_redirty | Number of database buffers the write daemon wrote during the most recent cycle that were also written in prior cycle |
| DB buffers written in recent cycle | iris_wd_buffer_write | Number of database buffers the write daemon wrote during its most recent cycle |
| Write daemon cycle completion time | iris_wd_cycle_time | Amount of time the most recent write daemon cycle took to complete |
| Processes holding global buffers | iris_wd_proc_in_global | Number of processes actively holding global buffers at start of the most recent write daemon cycle |
| Size of database buffers written in recent cycle | iris_wd_size_write | Size of database buffers the write daemon wrote during its most recent cycle |
| Write daemon inactive time before cycle | iris_wd_sleep | Amount of time that the write daemon was inactive before its most recent cycle began |
| In-memory buffers used | iris_wd_temp_queue | Number of in-memory buffers the write daemon used at the start of its most recent cycle |
| In-memory buffers written | iris_wd_temp_write | Number of in-memory buffers the write daemon wrote during its most recent cycle |
| Time writing to WIJ file | iris_wdwij_time | Amount of time the write daemon spent writing to the WIJ file during its most recent cycle |
| Time writing buffers to DBs | iris_wd_write_time | Amount of time the write daemon spent writing buffers to databases during its most recent cycle |
system-alerts
| Metric name | Metric key | Description |
|---|---|---|
| Alerts posted to messages log | iris_system_alerts.count | The number of alerts posted to the messages log |
| New system alerts available | iris_system_alerts_new | Whether new alerts are available on the /api/monitor/alerts endpoint |
cache-server-pages
| Metric name | Metric key | Description |
|---|---|---|
| Web requests | iris_csp_activity.count | Number of web requests served by the Web Gateway Server |
| Current web server gateway connections | iris_csp_actual_connections | Number of current connections to this server by the Web Gateway Server |
| Current connections processing a request | iris_csp_in_use_connections | Number of current connections to this server by the Web Gateway Server that are processing a web request |
| Connections reserved for state-aware apps | iris_csp_private_connections | Number of current connections to this server by the Web Gateway Server that are reserved for state-aware applications (Preserve mode 1) |
| Web gateway server latency | iris_csp_gateway_latency | Amount of time to obtain a response from the Web Gateway Server when fetching iris_csp_ metrics |
| Active web sessions | iris_csp_sessions | Number of currently active web session IDs on this server |
work-queue-management
| Metric name | Metric key | Description |
|---|---|---|
| Average running worker jobs | iris_wqm_active_worker_jobs | Average number of worker jobs running logic that are not blocked |
| Average commands in WQM category rate | iris_wqm_commands_per_sec | Average number of commands executed in this Work Queue Management category, per second |
| Average global references in WQM category rate | iris_wqm_globals_per_sec | Average number of global references run in this Work Queue Management category, per second |
| Max active workers since last log entry | iris_wqm_max_active_worker_jobs | Maximum number of active workers since the last log entry was recorded |
| Max entries in MQM queue since last log | iris_wqm_max_work_queue_depth | Maximum number of entries in the queue of this Work Queue Management category since the last log |
| Average idle worker jobs | iris_wqm_waiting_worker_jobs | Average number of idle worker jobs waiting for a group to connect to and do work for |
license
| Metric name | Metric key | Description |
|---|---|---|
| Licenses not in use | iris_license_available | Number of licenses not currently in use |
| Licenses in use | iris_license_consumed | Number of licenses currently in use |
| Licenses percent used | iris_license_percent_used | Percent of licenses currently in use |
sql
| Metric name | Metric key | Description |
|---|---|---|
| SQL statements executing | iris_sql_active_queries | The number of SQL statements currently executing |
| 95th percentile elapsed time for sql executing | iris_sql_active_queries_95_percentile | For the current set of active SQL statements, the 95th percentile elapsed time since a statement began executing |
| 99th percentile elapsed time for sql executing | iris_sql_active_queries_99_percentile | For the current set of active SQL statements, the 99th percentile elapsed time since a statement began executing |
| Number of ObjectScript commands performing SQL rate | iris_sql_commands_per_second | Average number of ObjectScript commands executed to perform SQL queries, per second |
| Average SQL runtime | iris_sql_queries_avg_runtime | Average SQL statement runtime |
| SQL runtime standard deviation | iris_sql_queries_avg_runtime_std_dev | Standard deviation of the average SQL statement runtime |
| SQL query rate | iris_sql_queries_per_second | Average number of SQL statements, per second |
undocumented-metrics
| Metric name | Metric key | Description |
|---|
enterprise-cache-protocol
| Metric name | Metric key | Description |
|---|---|---|
| Current ECP active client connections | iris_ecp_conn | Total number of active client connections on this ECP application server |
| Max client connections from this ECP app server | iris_ecp_conn_max | Maximum active client connections from this ECP application server |
| Synchronized ECP servers | iris_ecp_connections | Number of servers synchronized when this ECP application server synchronizes with its configured ECP data servers |
| ECP server latency | iris_ecp_latency | Latency between the ECP application server and the ECP data server |
| ECP active client connections rate | iris_ecps_conn | Total active client connections to this ECP data server per second |
| Max client connections to this ECP data server | iris_ecps_conn_max | Maximum active client connections to this ECP data server |
global-resource
| Metric name | Metric key | Description |
|---|---|---|
| Aseizes on global resource rate | iris_glo_a_seize_per_sec | Number of Aseizes on the global resource per second |
| Nseizes on global resource rate | iris_glo_n_seize_per_sec | Number of Nseizes on the global resource per second |
| Refs to globals on local DBs rate | iris_glo_ref_per_sec | Number of references to globals located on local databases per second |
| Refs to globals on remote DBs rate | iris_glo_ref_rem_per_sec | Number of references to globals located on remote databases per second |
| Seizes on global resource rate | iris_glo_seize_per_sec | Number of seizes on the global resource per second |
| Updates to globals on local DBs rate | iris_glo_update_per_sec | Number of updates (SET and KILL commands) to globals located on local databases per second |
| Updates to globals on remote DBs rate | iris_glo_update_rem_per_sec | Number of updates (SET and KILL commands) to globals located on remote databases per second |
system-alerting-and-monitoring
| Metric name | Metric key | Description |
|---|---|---|
| Time to collect iris_db sensors | iris_sam_get_db_sensors_seconds | Amount of time it took to collect iris_db* sensors |
| Time to collect iris_jrn sensors | iris_sam_get_jrn_sensors_seconds | Amount of time it took to collect iris_jrn* sensors |
| Time to collect iris_sql sensors | iris_sam_get_sql_sensors_seconds | Amount of time it took to collect iris_sql* sensors |
| Time to collect iris_wqm sensors | iris_sam_get_wqm_sensors_seconds | Amount of time it took to collect iris_wqm* sensors |
object
| Metric name | Metric key | Description |
|---|---|---|
| Asiezes on object resource rate | iris_obj_a_seize_per_sec | Number of Aseizes on the object resource per second |
| Objects deleted rate | iris_obj_del_per_sec | Number of objects deleted per second |
| Objects referenced rate | iris_obj_hit_per_sec | Number of object references per second, in process memory |
| Objects loaded from disk rate | iris_obj_load_per_sec | Number of objects loaded from disk per second, not in shared memory |
| Object references not found in mem rate | iris_obj_miss_per_sec | Number of object references not found in memory per second |
| Initialized objects rate | iris_obj_new_per_sec | Number of objects initialized per second |
| Siezes on object resource rate | iris_obj_seize_per_sec | Number of seizes on the object resource per second |
write-image-jounal
| Metric name | Metric key | Description |
|---|---|---|
| WIJ physical block writes per second | iris_wij_writes_per_sec | WIJ physical block writes per second |
routine
| Metric name | Metric key | Description |
|---|---|---|
| Asiezes on routine resource rate | iris_rtn_a_seize_per_sec | Number of Aseizes on the routine resource per second |
| Routine calls to globals on remote DBs rate | iris_rtn_call_local_per_sec | Number of local routine calls per second to globals located on remote databases per second |
| Routine call memory misses rate | iris_rtn_call_miss_per_sec | Number of routines calls not found in memory per second |
| Remote routine calls rate | iris_rtn_call_remote_per_sec | Number of remote routine calls per second |
| Routines locally loaded or saved to disk rate | iris_rtn_load_per_sec | Number of routines locally loaded from or saved to disk per second |
| Routines remotely loaded or saved to disk rate | iris_rtn_load_rem_per_sec | Number of routines remotely loaded from or saved to disk per second |
| Seizes on the routine resource rate | iris_rtn_seize_per_sec | Number of seizes on the routine resource per second |
default
| Metric name | Metric key | Description |
|---|---|---|
| IRIS availability | iris_availability | The availability of the configured API as seen by the extension |
| CPU percent used | iris_cpu_pct | Percent of CPU usage by InterSystems IRIS process type |
| CPU overall usage | iris_cpu_usage | Percent of CPU usage for all programs on the operating system |
| Physical memory used | iris_phys_mem_percent_used | Percent of physical memory (RAM) currently in use |
| Percent used of max page file space | iris_page_space_percent_used | Percent of maximum allocated page file space used |
| Physical database blocks read from disk rate | iris_phys_reads_per_sec | Physical database blocks read from disk per second |
| Physical database blocks written to disk rate | iris_phys_writes_per_sec | Physical database blocks written to disk per second |
| Active IRIS process count | iris_process_count.gauge | Total number of active InterSystems IRIS processes |
| System state | iris_system_state | Current reported system state (GREEN, RED, YELLOW, or HUNG) |
| Open transactions | iris_trans_open_count.gauge | Number of open transactions on the current instance |
| Average duration of open transactions | iris_trans_open_secs | Average duration of open transactions on the current instance |
| Longest open transaction duration | iris_trans_open_secs_max | Duration of longest currently open transaction on the current instance |
| IRIS cache efficiency | iris_cache_efficiency | Ratio of global references to physical reads and writes, as a percent |
shared-memory
| Metric name | Metric key | Description |
|---|---|---|
| Shared memory available by purpose | iris_smh_available | Shared memory available by purpose |
| Shared memory full percentage by purpose | iris_smh_percent_full | Percent of allocated shared memory in use by purpose |
| Instance total shared memory allocated | iris_smh_total | Shared memory allocated for current instance |
| Instance shared memory in use percentage | iris_smh_total_percent_full | Percent of allocated shared memory in use for current instance |
| Shared memory percentage used by purpose | iris_smh_used | Shared memory in use by purpose |
journal
| Metric name | Metric key | Description |
|---|---|---|
| Journal block write rate | iris_jrn_block_per_sec | Journal blocks written to disk per second |
| Journal entries per second | iris_jrn_entry_per_sec | Journal entries per second |
| Free space on journal directory | iris_jrn_free_space | Free space available on each journal directory's storage volume, in megabytes |
| Journal file size | iris_jrn_size | Current size of each journal file, in megabytes |
database
| Metric name | Metric key | Description |
|---|---|---|
| Amount to expand database | iris_db_expansion_size_mb | Amount by which to expand database |
| Free space | iris_db_free_space | Free space available in database (updated once per day) |
| IRIS DB latency | iris_db_latency | Amount of time to complete a random read from database |
| Database max size | iris_db_max_size_mb | Maximum size to which database can grow |
| Database size | iris_db_size_mb | Size of database |
| Database directory space free | iris_directory_space | Free space available on the database directory’s storage volume |
| IRIS disk percent full | iris_disk_percent_full | Percent of space filled on the database directory’s storage volume |
FAQ and troubleshooting
How do I configure metadata for custom metrics?
If the undocumented metrics feature set is enabled, the extension will collect custom and any undocumented IRIS metrics available on the metrics API page. As these metrics are unknown in advance, they will be missing metadata such as a display name, description, and unit. They will be usable as-is, but if you'd like, you can configure metadata for these yourself.
For more information, see Metrics browser.
Log event with title "Database `<database>` will be unable to expand!"
A database may enter a corrupted state if it attempts to expand beyond its maximum size.
A log event with the title "Database <database> will be unable to expand!" will be reported if the following equation is true: maximum size - current size < expansion size of the database.
Error when collection metrics or events
If there is an error when collecting metrics or events, a log event/log record will be reported and is visible on the IRIS instance entity. It contains details about the error.
