CoreDNS (2.0) extension
- Latest Dynatrace
- Extension
- Published Oct 27, 2025
Collect important data from your CoreDNS processes.
Get started
Overview
Integrate CoreDNS, an open source DNS server.
CoreDNS is an open source DNS server, based on plugins provided by all major cloud vendors. CoreDNS also integrates with Kubernetes. Dynatrace can either connect to the Prometheus endpoint locally via OneAgent or collect metrics from an exposed endpoint remotely via an ActiveGate.
Use cases
- Collect metrics related to your CoreDNS processes:
- Caching
- Forwarding
- Query volumes
- Performance
- Golang metrics
- Have CoreDNS data presented in context with your OneAgent collected information
Compatibility information
- Dynatrace OneAgent/ActiveGate version 1.279+
- Active Prometheus plugin in CoreDNS
- CoreDNS 1.0.0 - 1.11.X
- Note that metrics from the forward plugin in CoreDNS recently changed in 1.11.0. The extension collects these latest metric keys as opposed to the deprecated ones.
Activation and setup
Start by activating this extension in your environment either by using the in-product Hub or via the Extensions Manager app. Then create a monitoring configuration using either the local (OneAgent) or remote (ActiveGate) activation approach. Using the local approach is highly recommended as this will allow for the establishment of relationships between the detected CoreDNS process entity and the host on which it is running.
To create configurations for a group of OneAgent monitored hosts you can use things like host groups, management zones, and tags to supply a single configuration that applies to all of them. This is recommended for cases when the same Prometheus endpoint url (e.g. <http://localhost:9153/metric>s) applies.
For a local activation the default path will be http://localhost:9153/metrics but if you have a different configuration in your Corefile you may need to adjust the port.
For CoreDNS running in a container (using the default port) you can use: http://<container-ip-address>:9153/metrics.
For CoreDNS running as a Kubernetes Service (using the default port) you can use: http://<dns-service-ip-address>:9153/metrics.
Details
Entities
Using this extension will create CoreDNS process entities (prometheus:coredns_process). If you run this as a local extension (recommended) you will see relationships formed (runs_on) to the host where the CoreDNS process is running. This relationship is also used to show some data from the OneAgent detected CoreDNS Process Group Instance on the Unified Analysis screen for the extension entity as well as vice versa. If using a remote activation you will see a standalone entity without relationships to other entities in the Dynatrace detected topology.
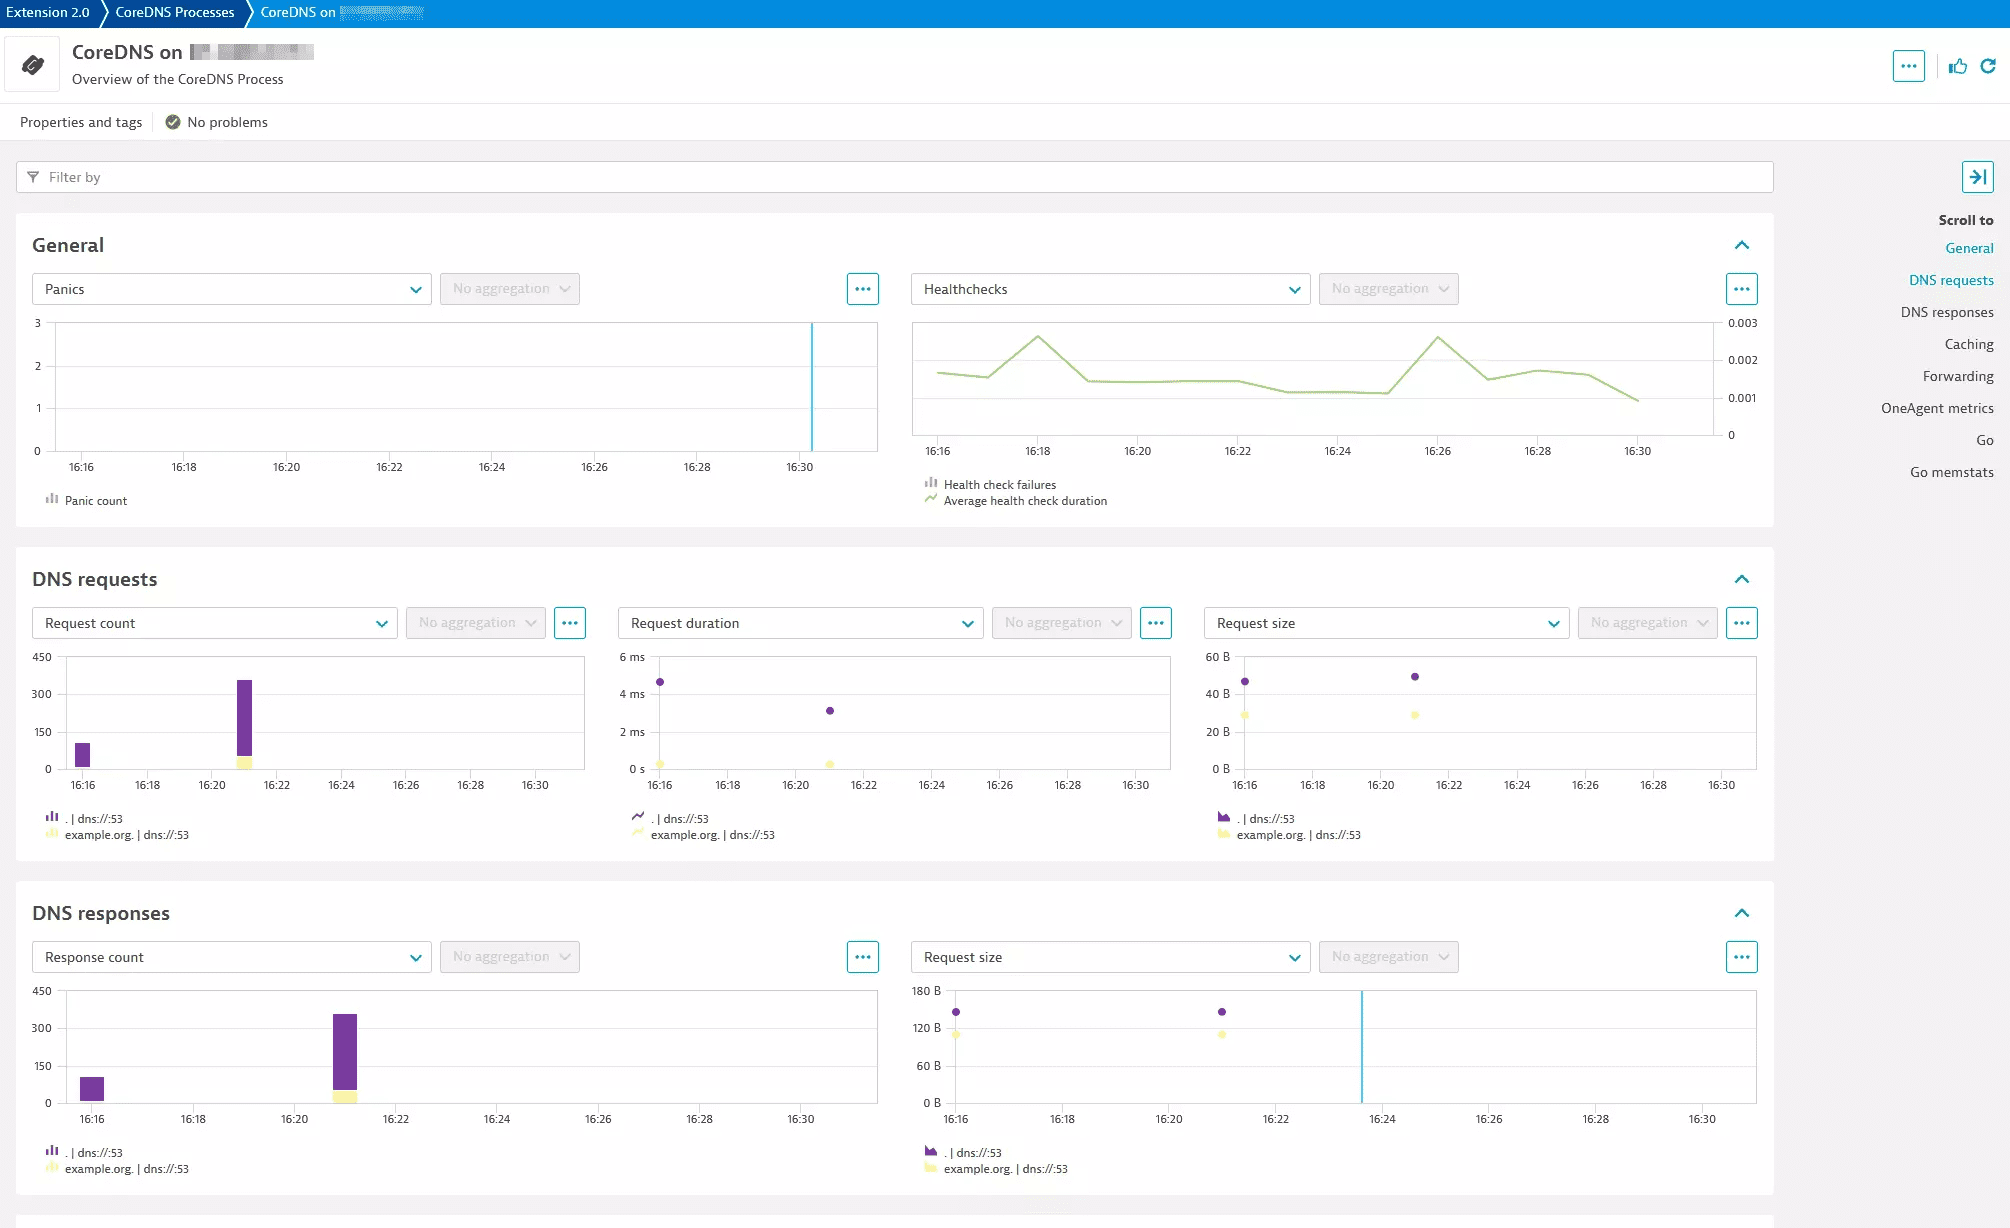
The included dashboard (CoreDNS Monitoring Overview) is a good entry point for accessing these entities.
Metrics
Various metrics related to CoreDNS (and Golang) are included depending on which feature set you activate. View the feature set details to see which metrics are included. Some of these are 'histogram' type metrics. To collect the individual buckets you must enable that in the Advanced settings. You do not need this if you are just interested in averages.
Additionally, there are a number of 'calculated' metrics listed below:
- Average proxy request duration (
func:coredns_proxy_connection_cache_hit_rate) - Proxy cache hit rate (
func:coredns_proxy_connection_cache_hit_rate) - Average DNS request duration (
func:coredns_average_request_duration) - Average DNS request size (
func:coredns_average_request_size) - Average DNS response size (
func:coredns_average_response_size) - Average health check duration (
func:coredns_average_health_check_duration) - Cache hit rate (
func:coredns_cache_hit_rate)
Events for alerting
This extension includes 1 preconfigured event for alerting. You must enable this before it will be active. If you want to make changes to it you should copy it and modify the copy as otherwise it may be overwritten in future updates.
- CoreDNS Panics Detected: At least one panic was detected in 3 of the last 5 minutes.
Licensing and cost
There is no charge for obtaining the extension, only for the data that the extension ingests. The details of license consumption will depend on which licensing model you are using. This will either be Dynatrace classic licensing or the Dynatrace Platform Subscription (DPS) model.
Metrics
License consumption is based on the number of metric data points ingested. The following formula will provide approximate annual data points ingested. Note that this is only an approximation as the true numbers will depend heavily on the traffic you experience.
Default: (12 + (2 * <proto> * <proxy_name> * <to>) + (2 * <proxy_name> * <rcode> * <to>) + (2 * <proto> * <server> * <zone>) + (2 * <plugin> * <rcode> * <server> * <zone>) + (2 * <proto> * <server> * <zone>) + (2 * <server> * <zone>) + (3 * <server> * <type> * <zone>)) * 60 minutes * 24 hours * 365 days data points per year
Go Metrics: 29 * 60 minutes * 24 hours * 365 days data points per year
Classic licensing
In the Dynatrace classic licensing model, metric ingestion will consume Davis Data Units (DDUs) at the rate of .001 DDUs per metric data point.
Multiply the above formula for annual data points by .001 to estimate annual DDU usage.
Feature sets
When activating your extension using monitoring configuration, you can limit monitoring to one of the feature sets. To work properly the extension has to collect at least one metric after the activation.
In highly segmented networks, feature sets can reflect the segments of your environment. Then, when you create a monitoring configuration, you can select a feature set and a corresponding ActiveGate group that can connect to this particular segment.
All metrics that aren't categorized into any feature set are considered to be the default and are always reported.
A metric inherits the feature set of a subgroup, which in turn inherits the feature set of a group. Also, the feature set defined on the metric level overrides the feature set defined on the subgroup level, which in turn overrides the feature set defined on the group level.
goMetrics
| Metric name | Metric key | Description |
|---|---|---|
| Stack memory obtained from OS | go_memstats_stack_sys_bytes | Number of bytes obtained from system for stack allocator |
| Go threads | go_threads | Number of OS threads created |
| Memory obtained from OS | go_memstats_sys_bytes | Number of bytes obtained from system |
| Stack span in-use size | go_memstats_stack_inuse_bytes | Number of bytes in use by the stack allocator |
| Misc off-heap memory allocations | go_memstats_other_sys_bytes | Number of bytes used for other system allocations |
| Target heap size of next GC cycle | go_memstats_next_gc_bytes | Number of heap bytes when next garbage collection will take place |
| Memory obtained for mspan structres | go_memstats_mspan_sys_bytes | Number of bytes used for mspan structures obtained from system |
| Allocated mspan structure size | go_memstats_mspan_inuse_bytes | Number of bytes in use by mspan structures |
| Memory obtained for mcache structres | go_memstats_mcache_sys_bytes | Number of bytes used for mcache structures obtained from system |
| Mcache allocated structure size | go_memstats_mcache_inuse_bytes | Number of bytes in use by mcache structures |
| Allocations for heap objects | go_memstats_mallocs_total.count | Total number of mallocs |
| Pointer lookups | go_memstats_lookups_total.count | Total number of pointer lookups |
| Heap memory obtained from OS | go_memstats_heap_sys_bytes | Number of heap bytes obtained from system |
| Physical memory returned to OS | go_memstats_heap_released_bytes | Number of heap bytes released to OS |
| Allocated heap objects | go_memstats_heap_objects | Number of allocated objects |
| In-use span size | go_memstats_heap_inuse_bytes | Number of heap bytes that are in use |
| Idle (unused) span size | go_memstats_heap_idle_bytes | Number of heap bytes waiting to be used |
| Allocated bytes | go_memstats_heap_alloc_bytes | Number of heap bytes allocated and still in use |
| Cumulative count of heap objects freed | go_memstats_frees_total.count | Total number of frees |
| Profiling bucket hash table size | go_memstats_buck_hash_sys_bytes | Number of bytes used by the profiling bucket hash table |
| Number of goroutines | go_goroutines | Number of goroutines that currently exist |
| GC duration | go_gc_duration_seconds | A summary of the pause duration of garbage collection cycles |
| Size of memory in garbage collection metadata | go_memstats_gc_sys_bytes | Number of bytes used for garbage collection system metadata |
default
| Metric name | Metric key | Description |
|---|---|---|
| Enabled plugin | coredns_plugin_enabled | Constant value indicating enabled plugins on a per server and zone basis |
| Panic count | coredns_panics_total.count | The number of panics |
| Health check failures | coredns_health_request_failures_total.count | The number of times the health check failed |
| Health request duration histogram | coredns_health_request_duration_seconds | Metrics will be accessible as keys: coredns_health_request_duration_seconds_bucket.count, coredns_health_request_duration_seconds_count, and coredns_health_request_duration_seconds_sum.count |
| Forward max concurrent rejects | coredns_forward_max_concurrent_rejects_total.count | The number of queries rejected because the concurrent queries were at maximum |
| Failed healthchecks per upstream | coredns_proxy_healthcheck_failures_total.count | Count of failed health checks per upstream |
| Connection cache hits per upstream | coredns_proxy_conn_cache_hits_total.count | Number of connection cache hits per upstream and protoco |
| Connection cache misses per upstream | coredns_proxy_conn_cache_misses_total.count | Number of connection cache misses per upstream and protocol |
| Proxy request duration histogram | coredns_proxy_request_duration_seconds | Metrics will be accessible as keys: coredns_proxy_request_duration_seconds_bucket.count, coredns_proxy_request_duration_seconds_count, and coredns_proxy_request_duration_seconds_sum.count |
| Response size histogram | coredns_dns_response_size_bytes | Metrics will be accessible as keys: coredns_dns_response_size_bytes_bucket.count, coredns_dns_response_size_bytes_count, and coredns_dns_response_size_bytes_sum.count |
| DNS responses | coredns_dns_responses_total.count | The number of DNS responses by status code |
| Request size histogram | coredns_dns_request_size_bytes | Metrics will be accessible as keys: coredns_dns_request_size_bytes_bucket.count, coredns_dns_request_size_bytes_count, and coredns_dns_request_size_bytes_sum.count |
| Request duration histogram | coredns_dns_request_duration_seconds | Metrics will be accessible as keys: coredns_dns_request_duration_seconds_bucket.count, coredns_dns_request_duration_seconds_count, and coredns_dns_request_duration_seconds_sum.count |
| DNS query count | coredns_dns_requests_total.count | The number of DNS requests made per zone, protocol, and family |
| Cache size | coredns_cache_entries | The number of elements in the cache |
| Cache hits | coredns_cache_hits_total.count | The number of cache hits |
| Cache misses | coredns_cache_misses_total.count | The number of cache misses |
| CoreDNS build info | coredns_build_info | A metric with a constant '1' value labeled by version, revision, and goversion from which CoreDNS was built |
