Apache Spark extension
- Latest Dynatrace
- Extension
- Published Oct 27, 2025
Enhanced insights for Spark Components
Get started
Overview
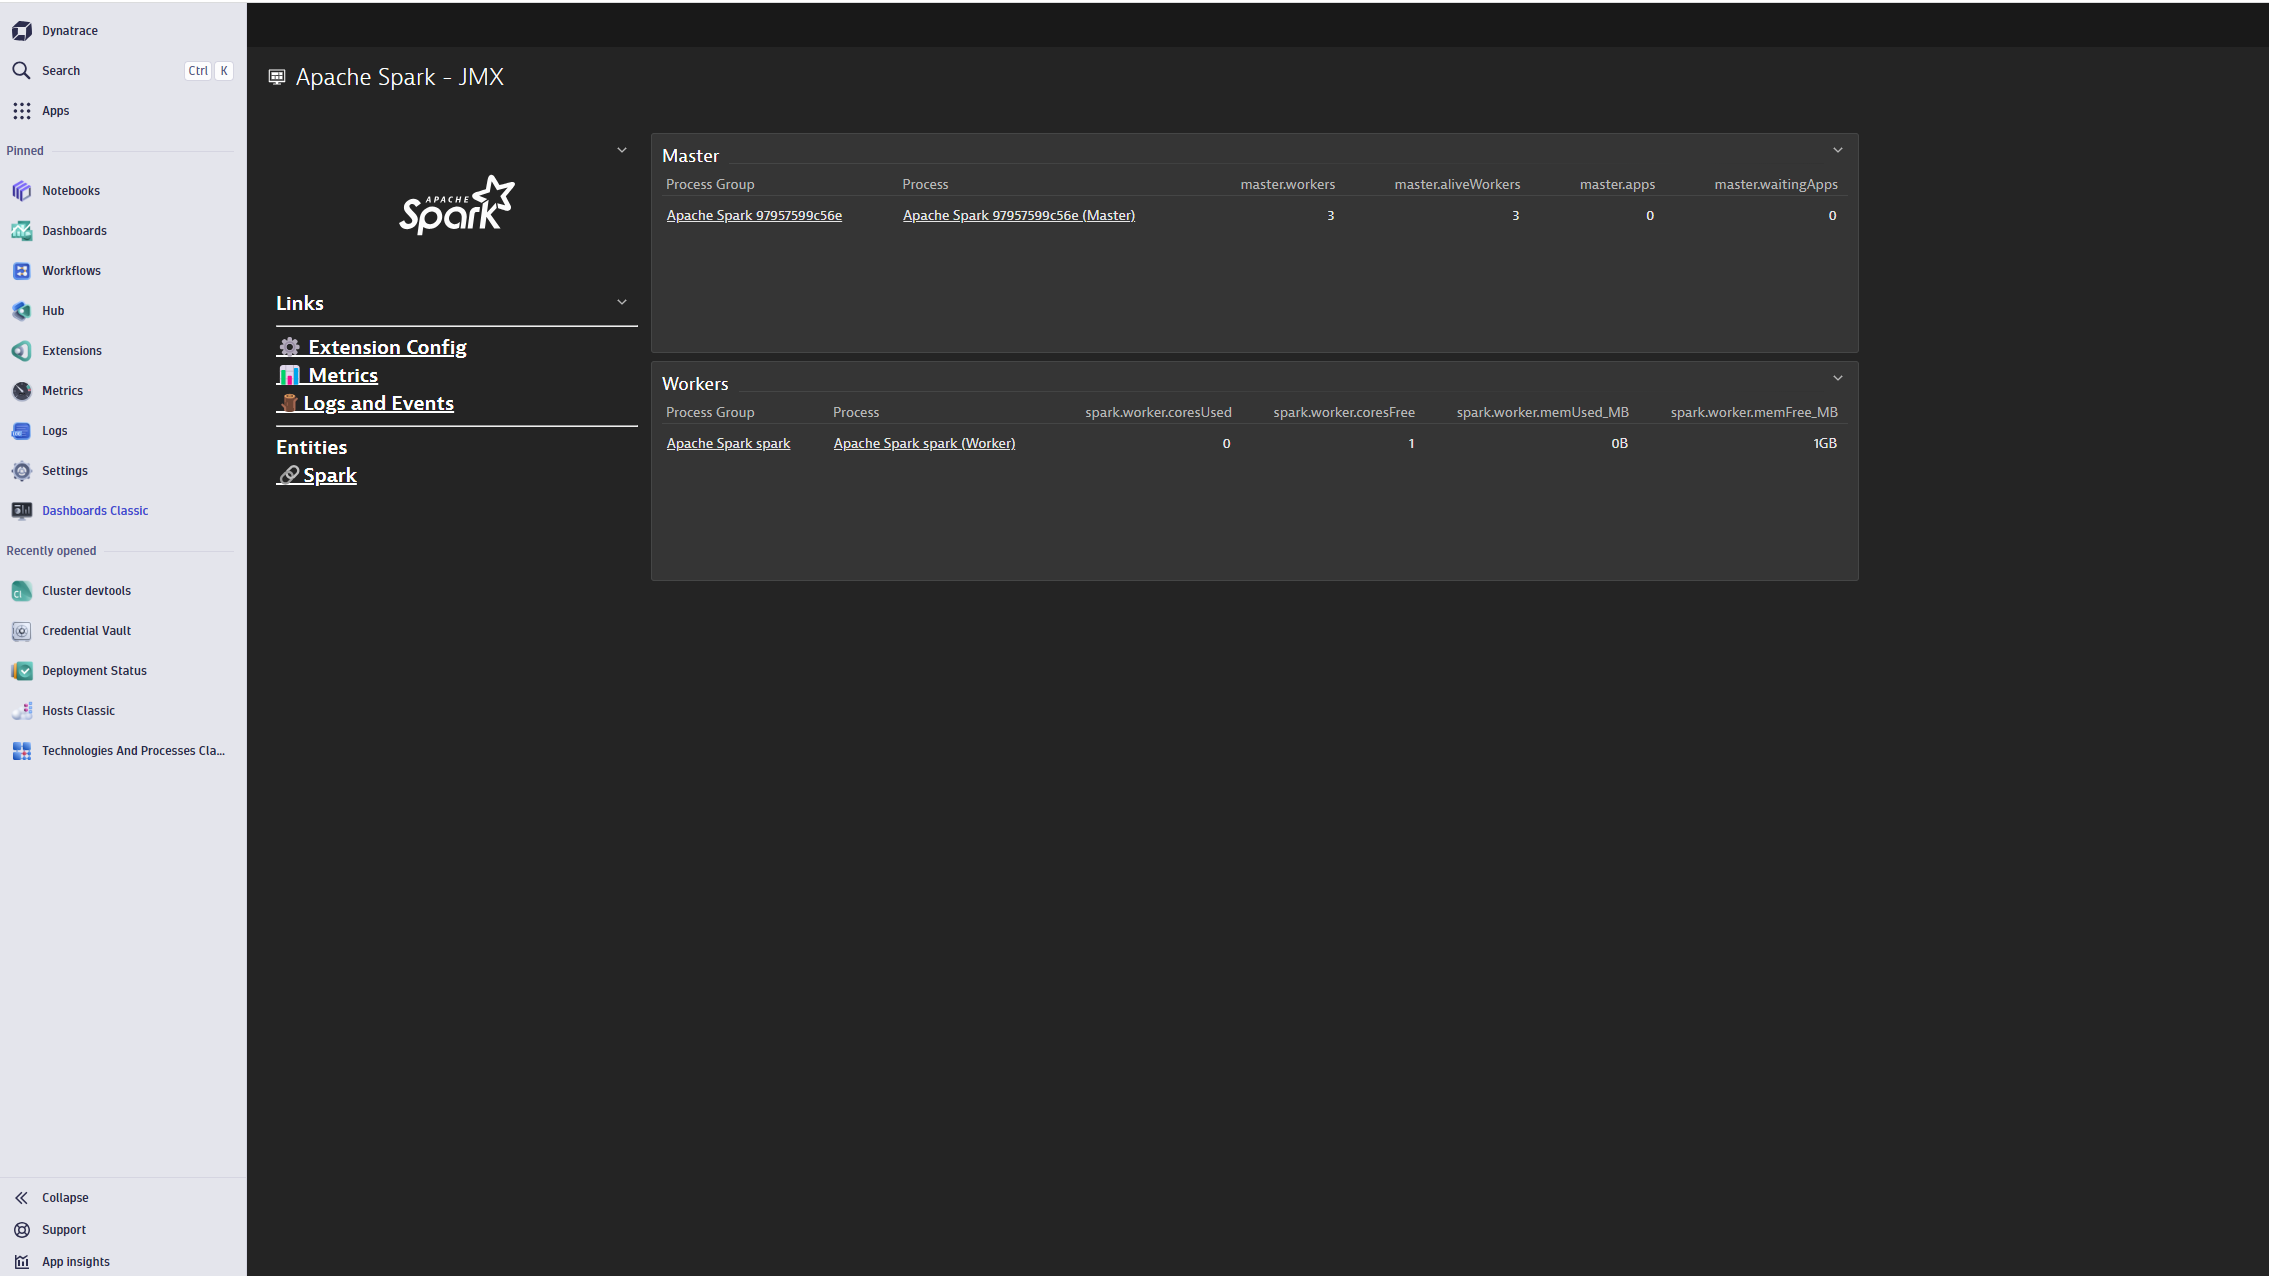
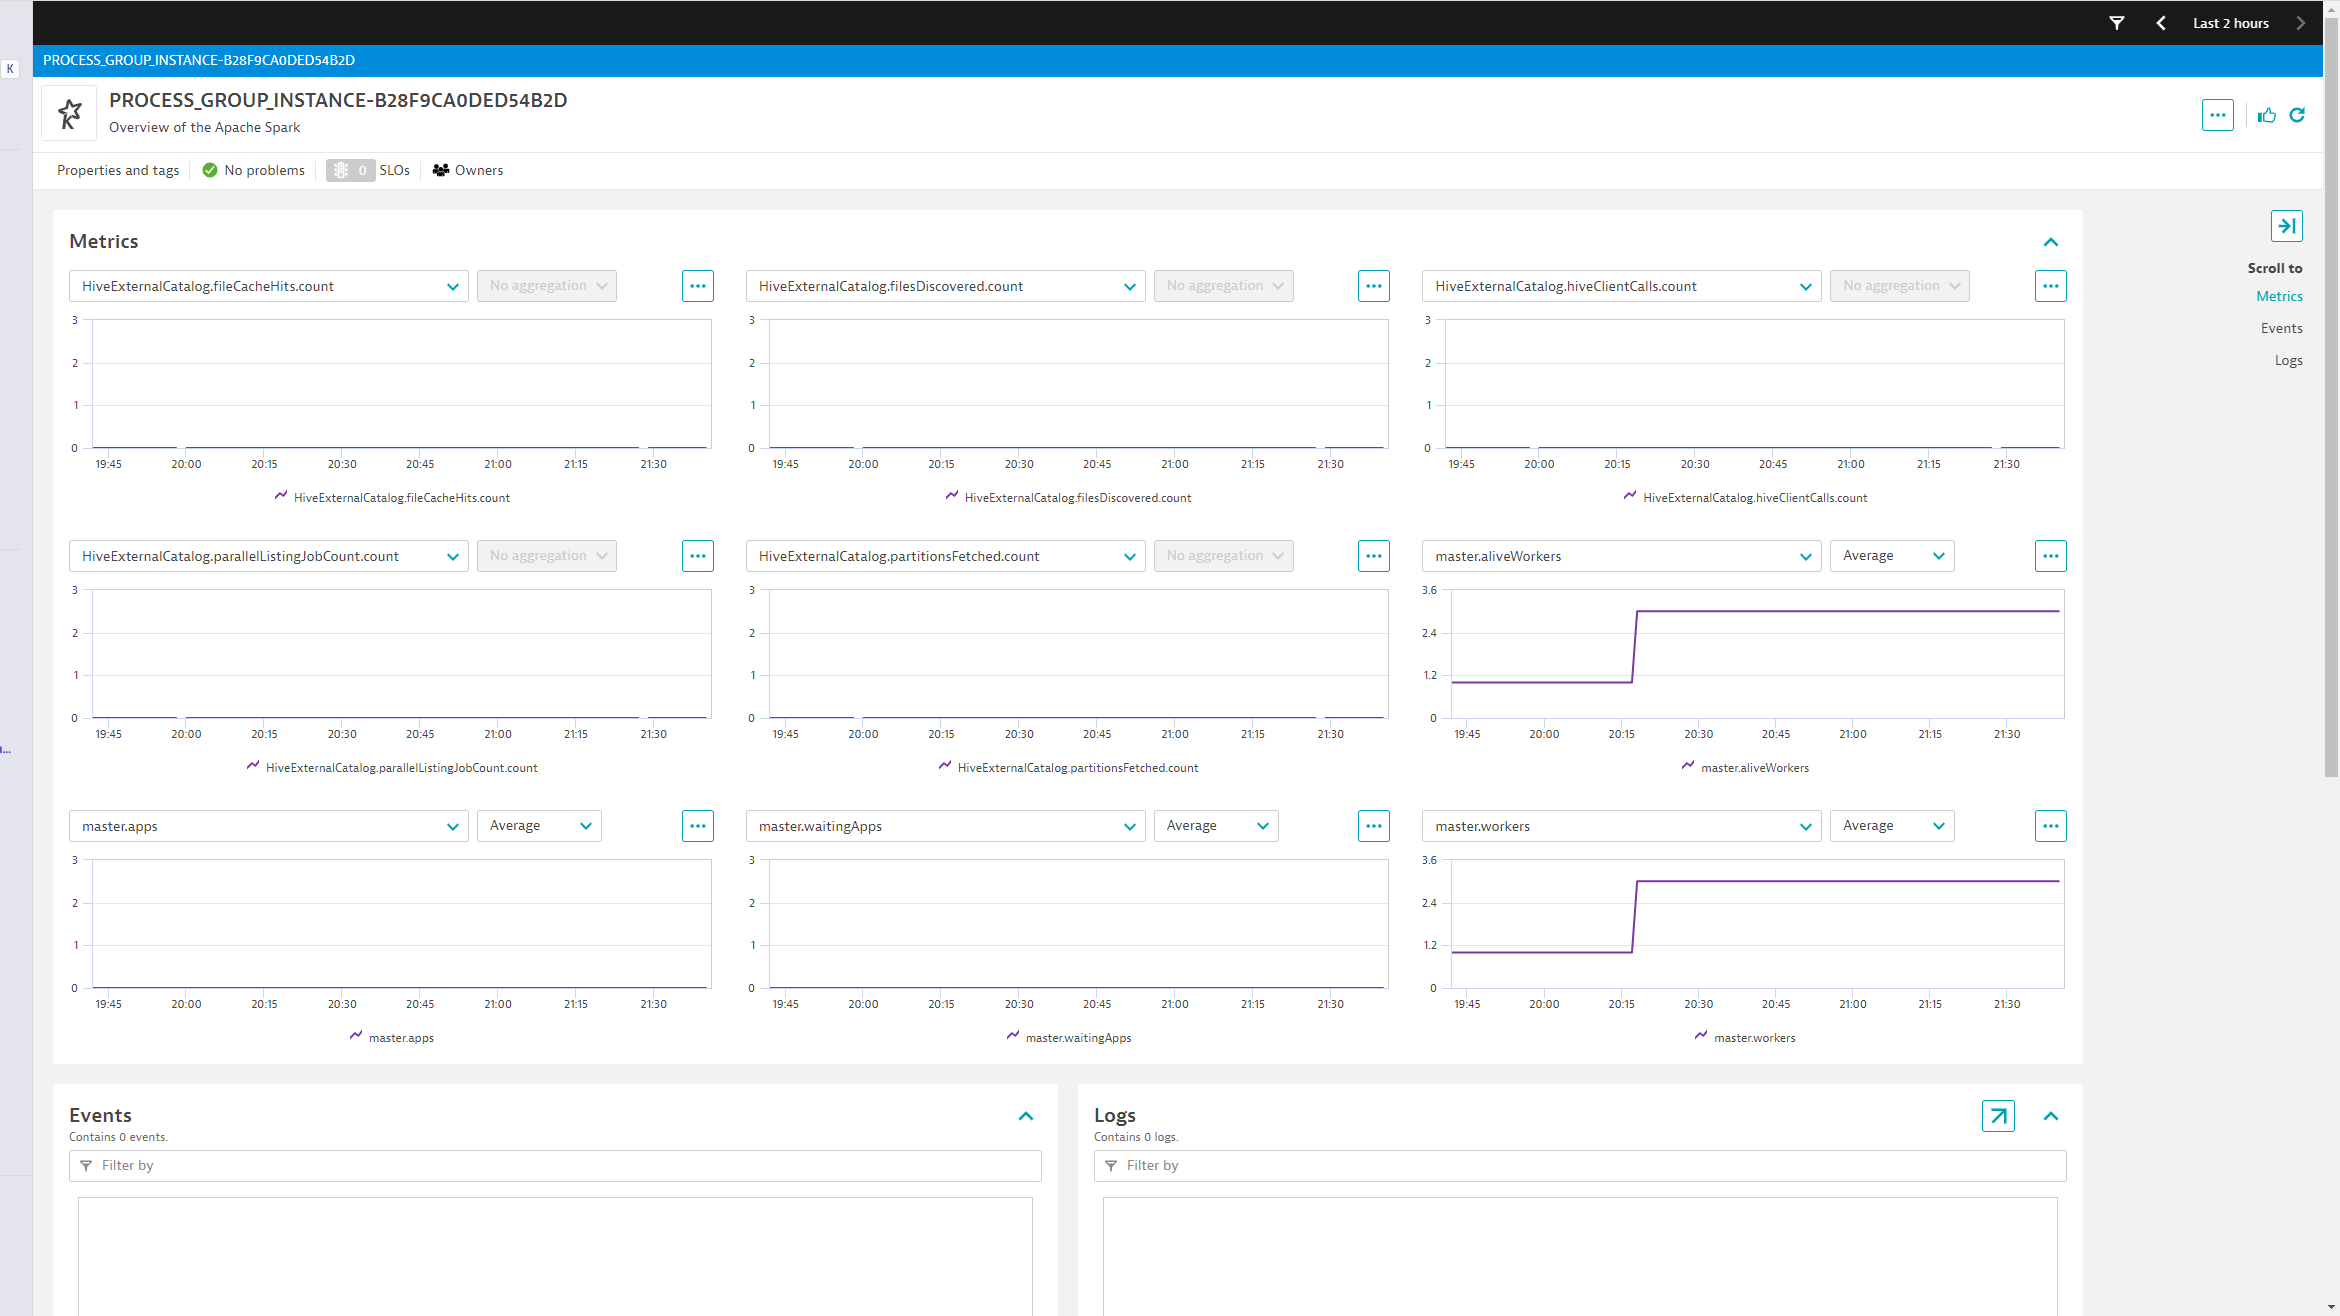
Apache Spark collects JMX metrics to provide insights into spark performance.
JMX metrics provide insights into resource usage, job and application status, and performance of your spark components.
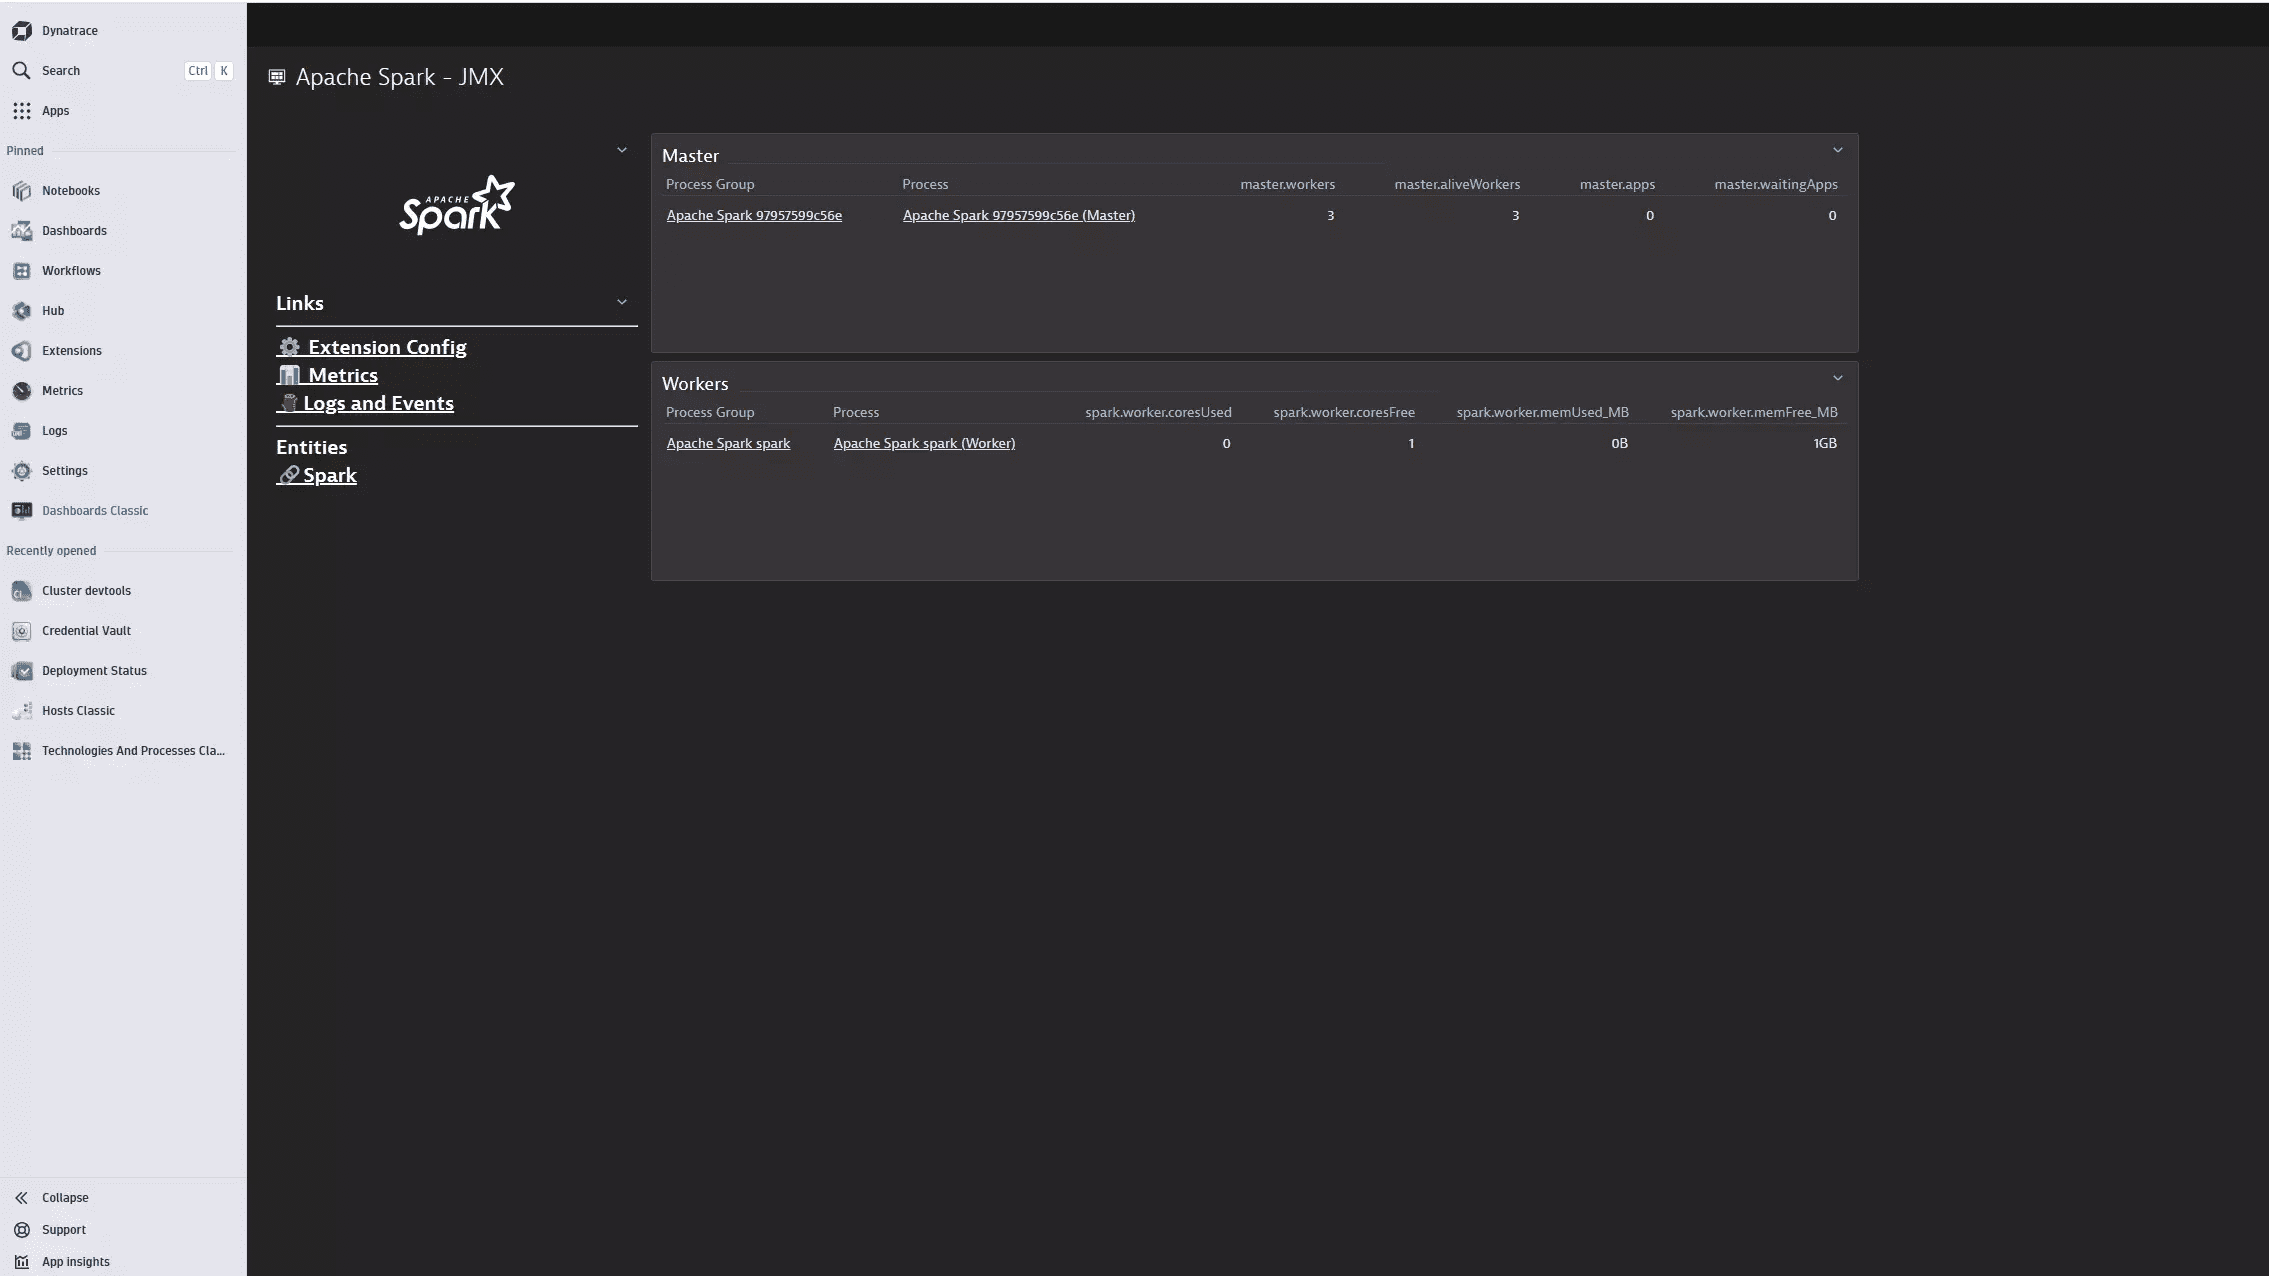
Apache Spark metrics are presented alongside other infrastructure measurements, enabling in-depth cluster performance analysis of both current and historical data.
Use cases
The extension enables insights into the overall health of Spark component instances.
Requirements
Dynatrace Activate this extension in your Dynatrace environment from the in-product Hub and simply select which OneAgents to enable this on.
Spark You must configure the required component metrics to be reported to the JMX sink.
- The metrics system is configured via a configuration file that Spark expects to be present at
$SPARK_HOME/conf/metrics.propertiesFor example, you can enable metric collection to the JmxSink for the master, worker, driver and executor components with a command such as:
cat << EOF > $SPARK_HOME/conf/metrics.properties*.sink.jmx.class=org.apache.spark.metrics.sink.JmxSinkmaster.source.jvm.class=org.apache.spark.metrics.source.JvmSourceworker.source.jvm.class=org.apache.spark.metrics.source.JvmSourcedriver.source.jvm.class=org.apache.spark.metrics.source.JvmSourceexecutor.source.jvm.class=org.apache.spark.metrics.source.JvmSourceEOF
Refer to the Spark documentation for more details
Compatibility information
- Dynatrace OneAgent 1.275+
- Linux or Windows OS
- Spark version 3.x
- Spark JMX metrics are enabled
Details
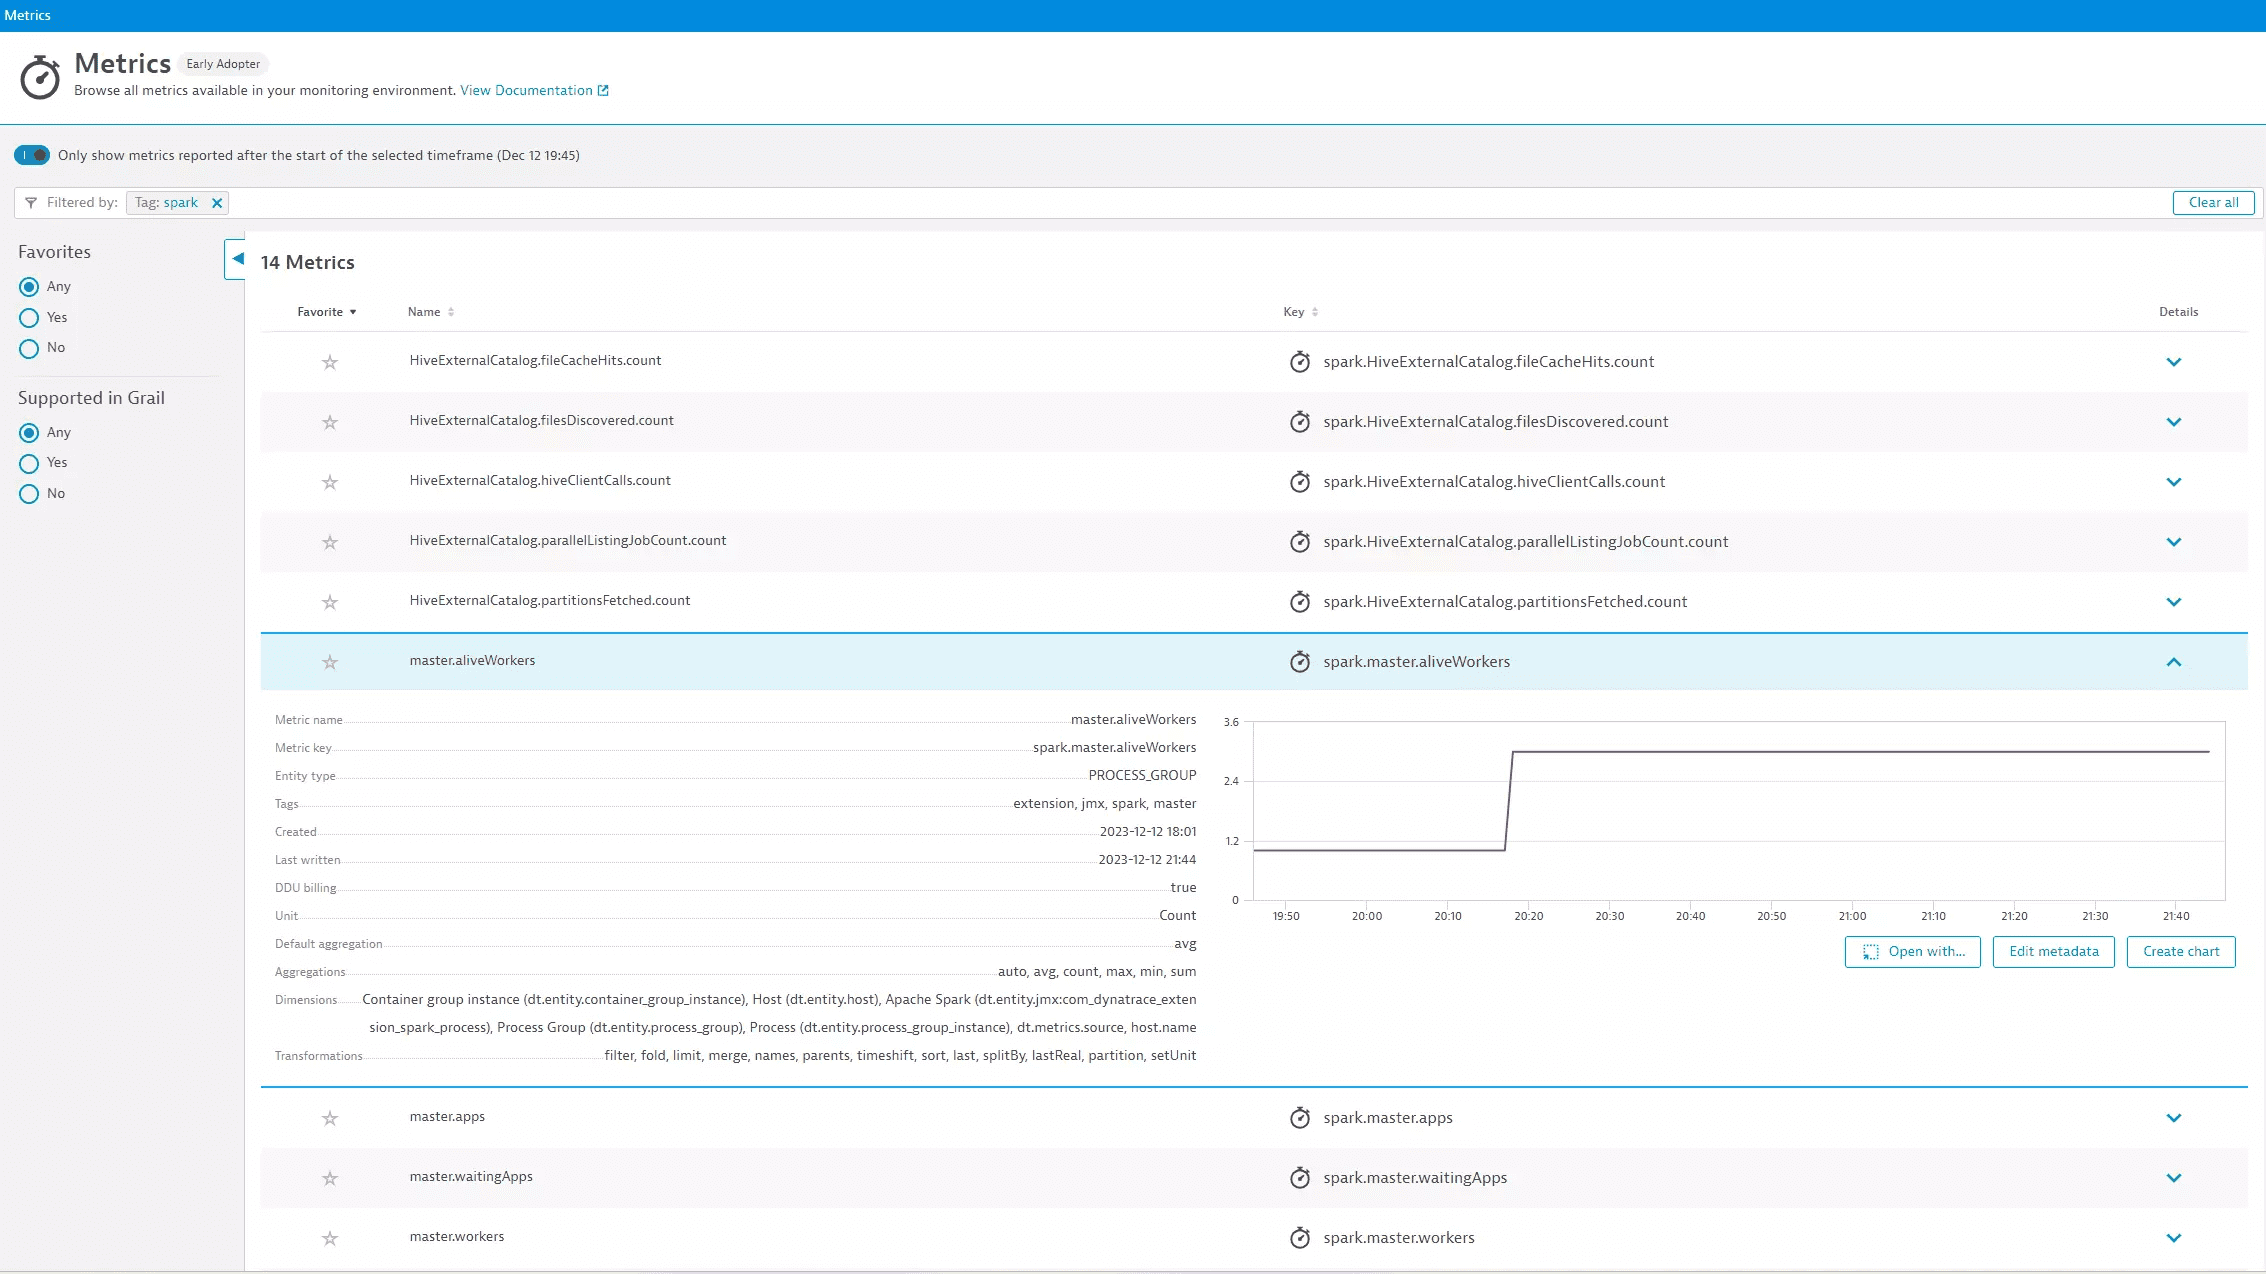
This extension can query and collect almost all component instance and namespace metrics as defined in Spark Metric Providers
- Driver
- Executor
- applicationMaster (YARN)
- mesos_cluster
- master
- ApplicationSource (Spark standalone)
- worker
- shuffleservice
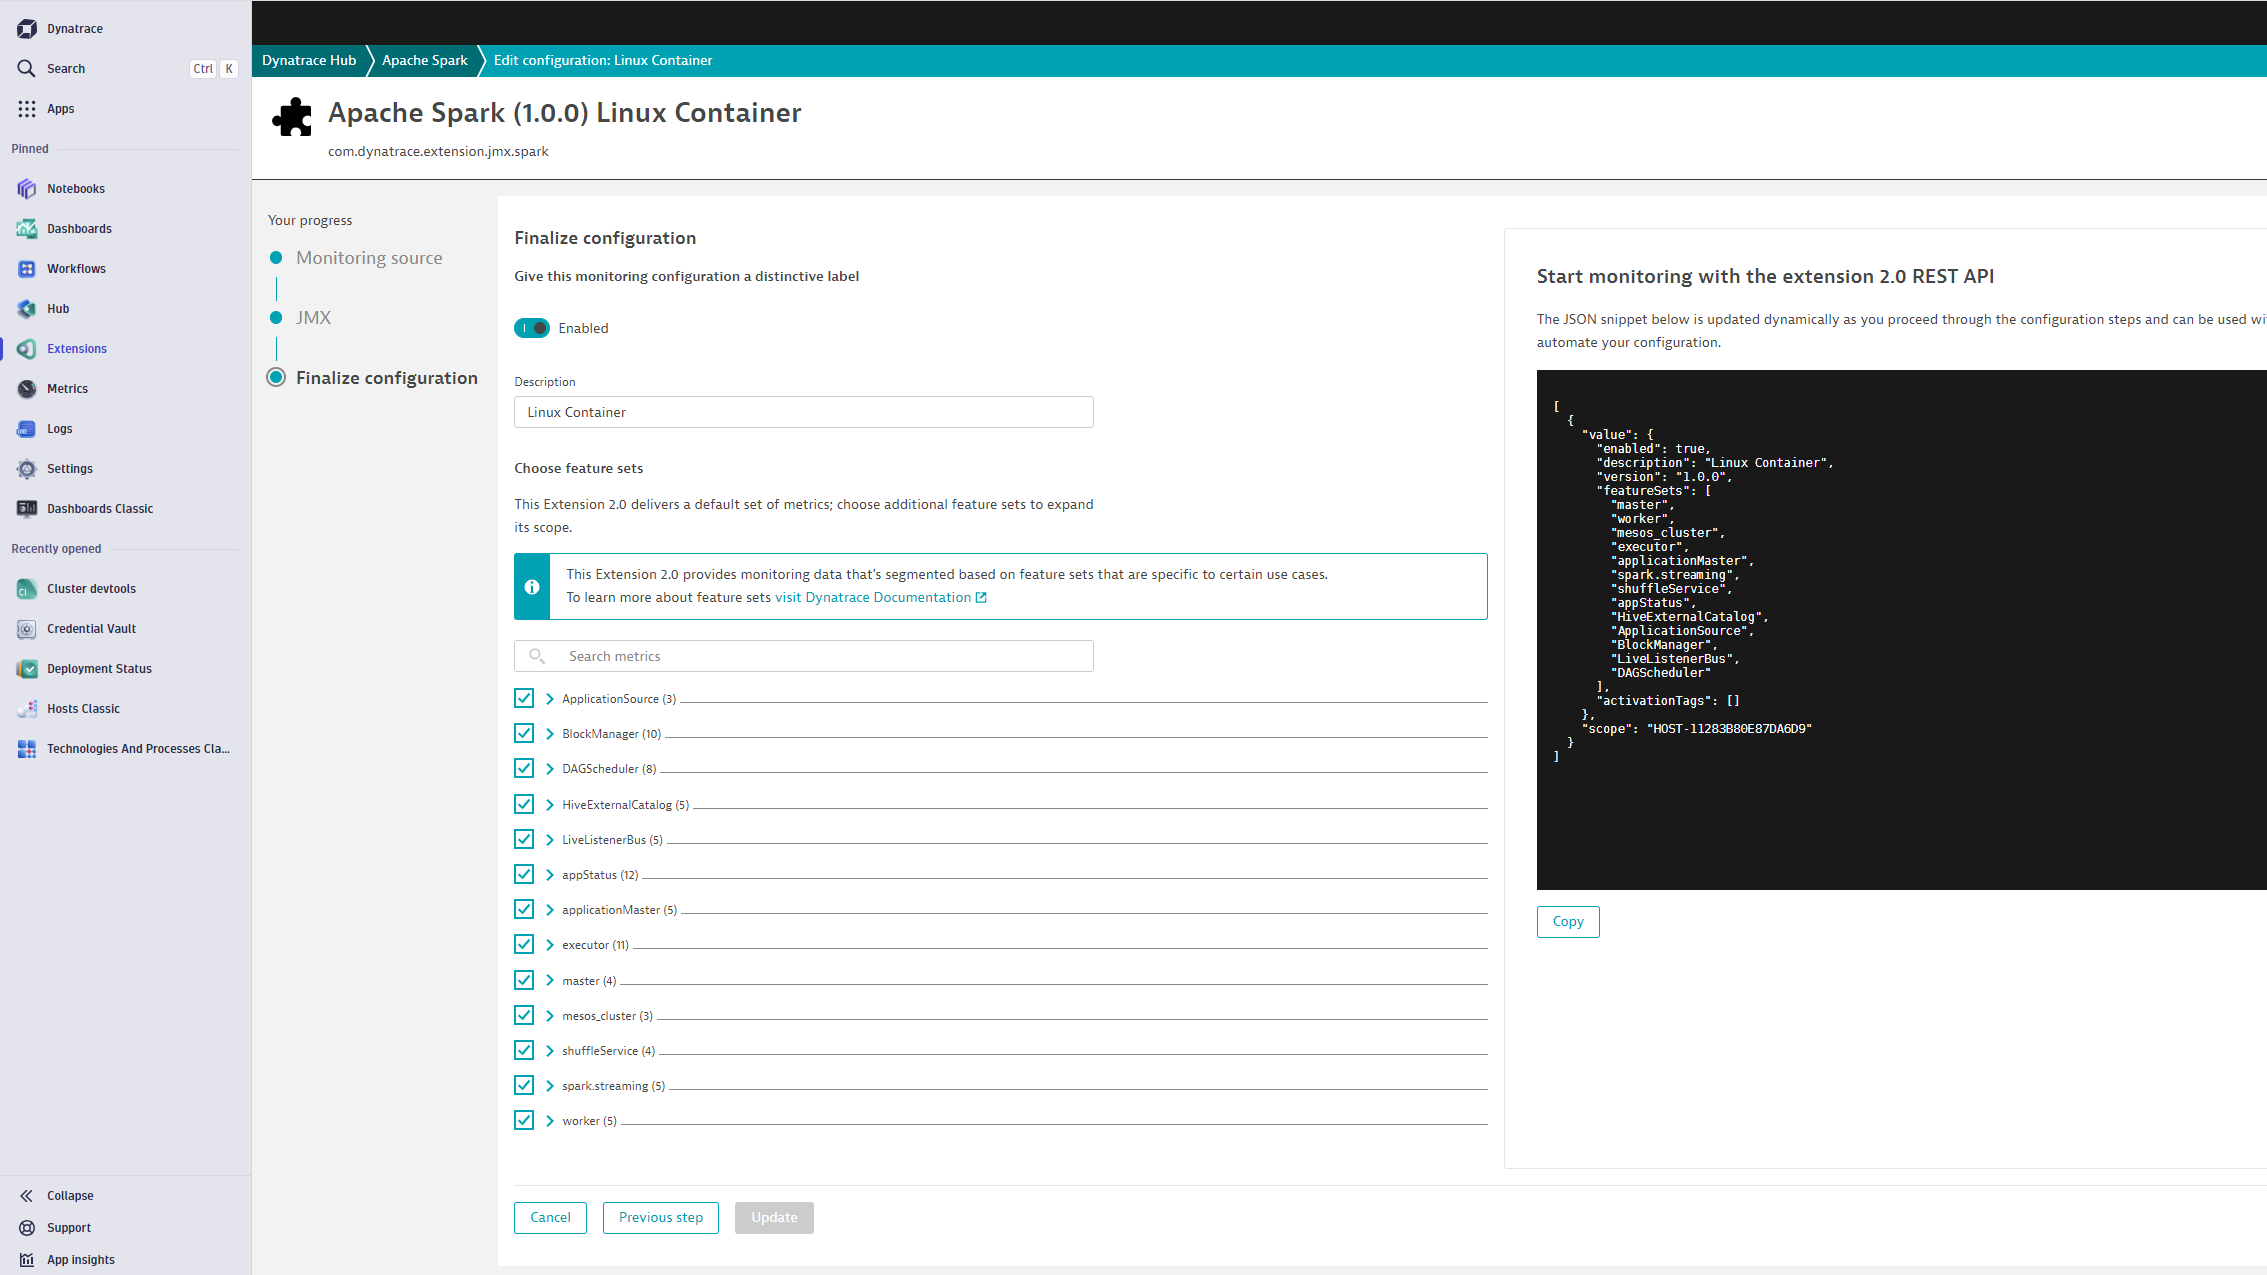
Feature sets
When activating your extension using monitoring configuration, you can limit monitoring to one of the feature sets. To work properly the extension has to collect at least one metric after the activation.
In highly segmented networks, feature sets can reflect the segments of your environment. Then, when you create a monitoring configuration, you can select a feature set and a corresponding ActiveGate group that can connect to this particular segment.
All metrics that aren't categorized into any feature set are considered to be the default and are always reported.
A metric inherits the feature set of a subgroup, which in turn inherits the feature set of a group. Also, the feature set defined on the metric level overrides the feature set defined on the subgroup level, which in turn overrides the feature set defined on the group level.
| Metric name | Metric key | Description |
|---|---|---|
| master.workers | spark.master.workers | — |
| master.aliveWorkers | spark.master.aliveWorkers | — |
| master.apps | spark.master.apps | — |
| master.waitingApps | spark.master.waitingApps | — |
| Metric name | Metric key | Description |
|---|---|---|
| worker.executors | spark.worker.executors | — |
| spark.worker.coresUsed | spark.worker.coresUsed | — |
| spark.worker.memUsed_MB | spark.worker.memUsed_MB | — |
| spark.worker.coresFree | spark.worker.coresFree | — |
| spark.worker.memFree_MB | spark.worker.memFree_MB | — |
| Metric name | Metric key | Description |
|---|---|---|
| mesos_cluster.waitingDrivers | spark.mesos_cluster.waitingDrivers | — |
| mesos_cluster.launchedDrivers | spark.mesos_cluster.launchedDrivers | — |
| mesos_cluster.retryDrivers | spark.mesos_cluster.retryDrivers | — |
| Metric name | Metric key | Description |
|---|---|---|
| executor.bytesRead.count | spark.executor.bytesRead.count | — |
| executor.bytesWritten.count | spark.executor.bytesWritten.count | — |
| executor.cpuTime.count | spark.executor.cpuTime.count | — |
| executor.filesystem.file.largeRead_ops | spark.executor.filesystem.file.largeRead_ops | — |
| spark.executor.filesystem.file.read_bytes | spark.executor.filesystem.file.read_bytes | — |
| spark.executor.filesystem.file.read_ops | spark.executor.filesystem.file.read_ops | — |
| spark.executor.filesystem.file.write_bytes | spark.executor.filesystem.file.write_bytes | — |
| executor.filesystem.file.write_ops | spark.executor.filesystem.file.write_ops | — |
| executor.recordsRead.count | spark.executor.recordsRead.count | — |
| executor.recordsWritten.count | spark.executor.recordsWritten.count | — |
| executor.succeededTasks.count | spark.executor.succeededTasks.count | — |
| Metric name | Metric key | Description |
|---|---|---|
| applicationMaster.numContainersPendingAllocate | spark.applicationMaster.numContainersPendingAllocate | — |
| spark.applicationMaster.numExecutorsFailed | spark.applicationMaster.numExecutorsFailed | — |
| applicationMaster.numExecutorsRunning | spark.applicationMaster.numExecutorsRunning | — |
| applicationMaster.numLocalityAwareTasks | spark.applicationMaster.numLocalityAwareTasks | — |
| applicationMaster.numReleasedContainers | spark.applicationMaster.numReleasedContainers | — |
| Metric name | Metric key | Description |
|---|---|---|
| streaming.inputRate-total | spark.streaming.inputRate-total | — |
| streaming.latency | spark.streaming.latency | — |
| streaming.processingRate-total | spark.streaming.processingRate-total | — |
| streaming.states-rowsTotal | spark.streaming.states-rowsTotal | — |
| streaming.states-usedBytes | spark.streaming.states-usedBytes | — |
| Metric name | Metric key | Description |
|---|---|---|
| shuffleService.numActiveConnections.count | spark.shuffleService.numActiveConnections.count | — |
| shuffleService.numRegisteredConnections.count | spark.shuffleService.numRegisteredConnections.count | — |
| shuffleService.numCaughtExceptions.count | spark.shuffleService.numCaughtExceptions.count | — |
| shuffleService.registeredExecutorsSize | spark.shuffleService.registeredExecutorsSize | — |
| Metric name | Metric key | Description |
|---|---|---|
| appStatus.stages.failedStages.count | spark.appStatus.stages.failedStages.count | — |
| appStatus.stages.skippedStages.count | spark.appStatus.stages.skippedStages.count | — |
| appStatus.stages.completedStages.count | spark.appStatus.stages.completedStages.count | — |
| appStatus.tasks.excludedExecutors.count | spark.appStatus.tasks.excludedExecutors.count | — |
| appStatus.tasks.completedTasks.count | spark.appStatus.tasks.completedTasks.count | — |
| appStatus.tasks.failedTasks.count | spark.appStatus.tasks.failedTasks.count | — |
| appStatus.tasks.killedTasks.count | spark.appStatus.tasks.killedTasks.count | — |
| appStatus.tasks.skippedTasks.count | spark.appStatus.tasks.skippedTasks.count | — |
| spark.appStatus.tasks.unexcludedExecutors.count | spark.appStatus.tasks.unexcludedExecutors.count | — |
| appStatus.jobs.succeededJobs.count | spark.appStatus.jobs.succeededJobs.count | — |
| appStatus.jobs.failedJobs.count | spark.appStatus.jobs.failedJobs.count | — |
| appStatus.jobs.jobDuration | spark.appStatus.jobs.jobDuration | — |
| Metric name | Metric key | Description |
|---|---|---|
| BlockManager.disk.diskSpaceUsed_MB | spark.BlockManager.disk.diskSpaceUsed_MB | — |
| BlockManager.memory.maxMem_MB | spark.BlockManager.memory.maxMem_MB | — |
| BlockManager.memory.maxOffHeapMem_MB | spark.BlockManager.memory.maxOffHeapMem_MB | — |
| BlockManager.memory.maxOnHeapMem_MB | spark.BlockManager.memory.maxOnHeapMem_MB | — |
| BlockManager.memory.memUsed_MB | spark.BlockManager.memory.memUsed_MB | — |
| BlockManager.memory.offHeapMemUsed_MB | spark.BlockManager.memory.offHeapMemUsed_MB | — |
| BlockManager.memory.onHeapMemUsed_MB | spark.BlockManager.memory.onHeapMemUsed_MB | — |
| BlockManager.memory.remainingMem_MB | spark.BlockManager.memory.remainingMem_MB | — |
| BlockManager.memory.remainingOffHeapMem_MB | spark.BlockManager.memory.remainingOffHeapMem_MB | — |
| BlockManager.memory.remainingOnHeapMem_MB | spark.BlockManager.memory.remainingOnHeapMem_MB | — |
| Metric name | Metric key | Description |
|---|---|---|
| ApplicationSource.status | spark.ApplicationSource.status | — |
| ApplicationSource.runtime_ms | spark.ApplicationSource.runtime_ms | — |
| ApplicationSource.cores | spark.ApplicationSource.cores | — |
| Metric name | Metric key | Description |
|---|---|---|
| HiveExternalCatalog.fileCacheHits.count | spark.HiveExternalCatalog.fileCacheHits.count | — |
| HiveExternalCatalog.filesDiscovered.count | spark.HiveExternalCatalog.filesDiscovered.count | — |
| HiveExternalCatalog.hiveClientCalls.count | spark.HiveExternalCatalog.hiveClientCalls.count | — |
| HiveExternalCatalog.parallelListingJobCount.count | spark.HiveExternalCatalog.parallelListingJobCount.count | — |
| HiveExternalCatalog.partitionsFetched.count | spark.HiveExternalCatalog.partitionsFetched.count | — |
| Metric name | Metric key | Description |
|---|---|---|
| LiveListenerBus.numEventsPosted.count | spark.LiveListenerBus.numEventsPosted.count | — |
| LiveListenerBus.queue.appStatus.numDroppedEvents.count | spark.LiveListenerBus.queue.appStatus.numDroppedEvents.count | — |
| LiveListenerBus.queue.appStatus.size | spark.LiveListenerBus.queue.appStatus.size | — |
| LiveListenerBus.queue.eventLog.numDroppedEvents.count | spark.LiveListenerBus.queue.eventLog.numDroppedEvents.count | — |
| LiveListenerBus.queue.eventLog.size | spark.LiveListenerBus.queue.eventLog.size | — |
| Metric name | Metric key | Description |
|---|---|---|
| DAGScheduler.job.activeJobs | spark.DAGScheduler.job.activeJobs | — |
| DAGScheduler.job.allJobs | spark.DAGScheduler.job.allJobs | — |
| DAGScheduler.messageProcessingTime.count | spark.DAGScheduler.messageProcessingTime.count | — |
| DAGScheduler.messageProcessingTime.oneminuterate | spark.DAGScheduler.messageProcessingTime.oneminuterate | — |
| DAGScheduler.messageProcessingTime.mean | spark.DAGScheduler.messageProcessingTime.mean | — |
| DAGScheduler.stage.failedStages | spark.DAGScheduler.stage.failedStages | — |
| spark.DAGScheduler.stage.runningStages | spark.DAGScheduler.stage.runningStages | — |
| DAGScheduler.stage.waitingStages | spark.DAGScheduler.stage.waitingStages | — |
