OpenAI Observability
- Latest Dynatrace
- Tutorial
- 6-min read
Dynatrace enables enterprises to automatically collect, visualize and alert on OpenAI Agent, API request consumption, latency, and stability information in combination with all other services used to build their AI application. This includes OpenAI and Azure OpenAI services, such as GPT-5.2, Codex, DALL-E, or ChatGPT.
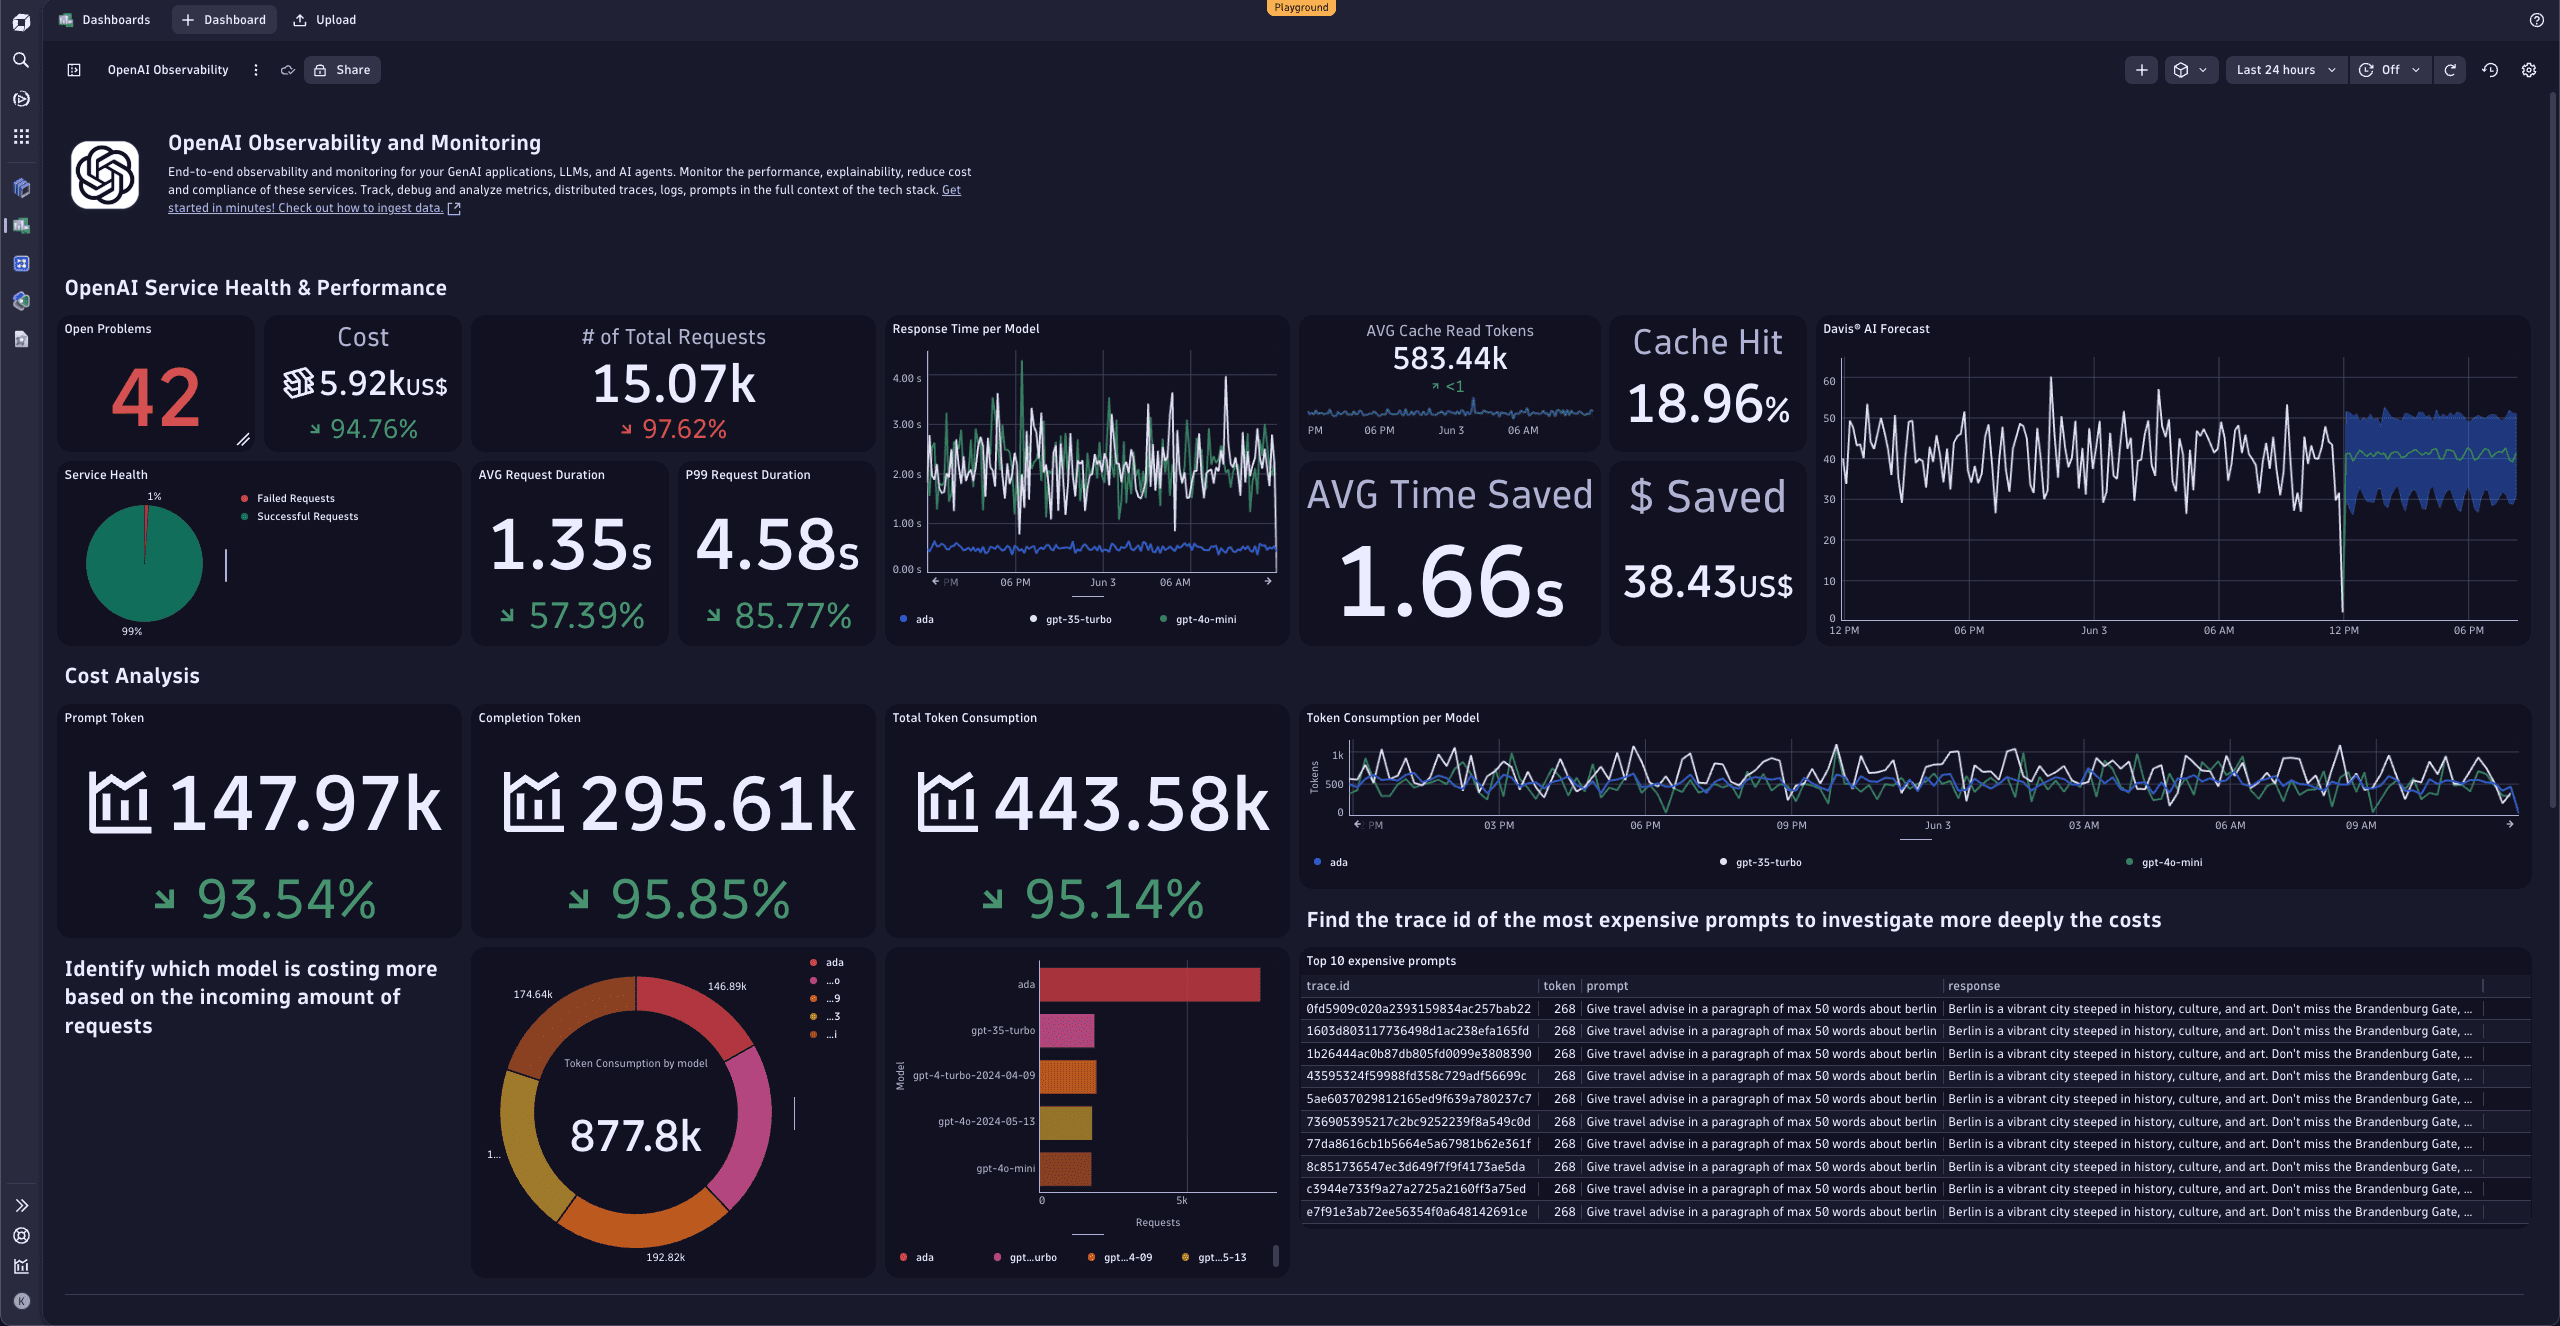
The example dashboard below visualizes OpenAI token consumption, showing critical SLOs for latency and availability as well as the most important OpenAI generative AI service metrics, such as response time, error count, and overall number of requests.
Dynatrace with OpenTelemetry or OpenLLMetry helps to:
- Reveal the full context of used technologies.
- Shows the service interaction topology.
- Analyzes security vulnerabilities.
- Observes metrics, traces, logs, and business events in real time.
The sections below show how to:
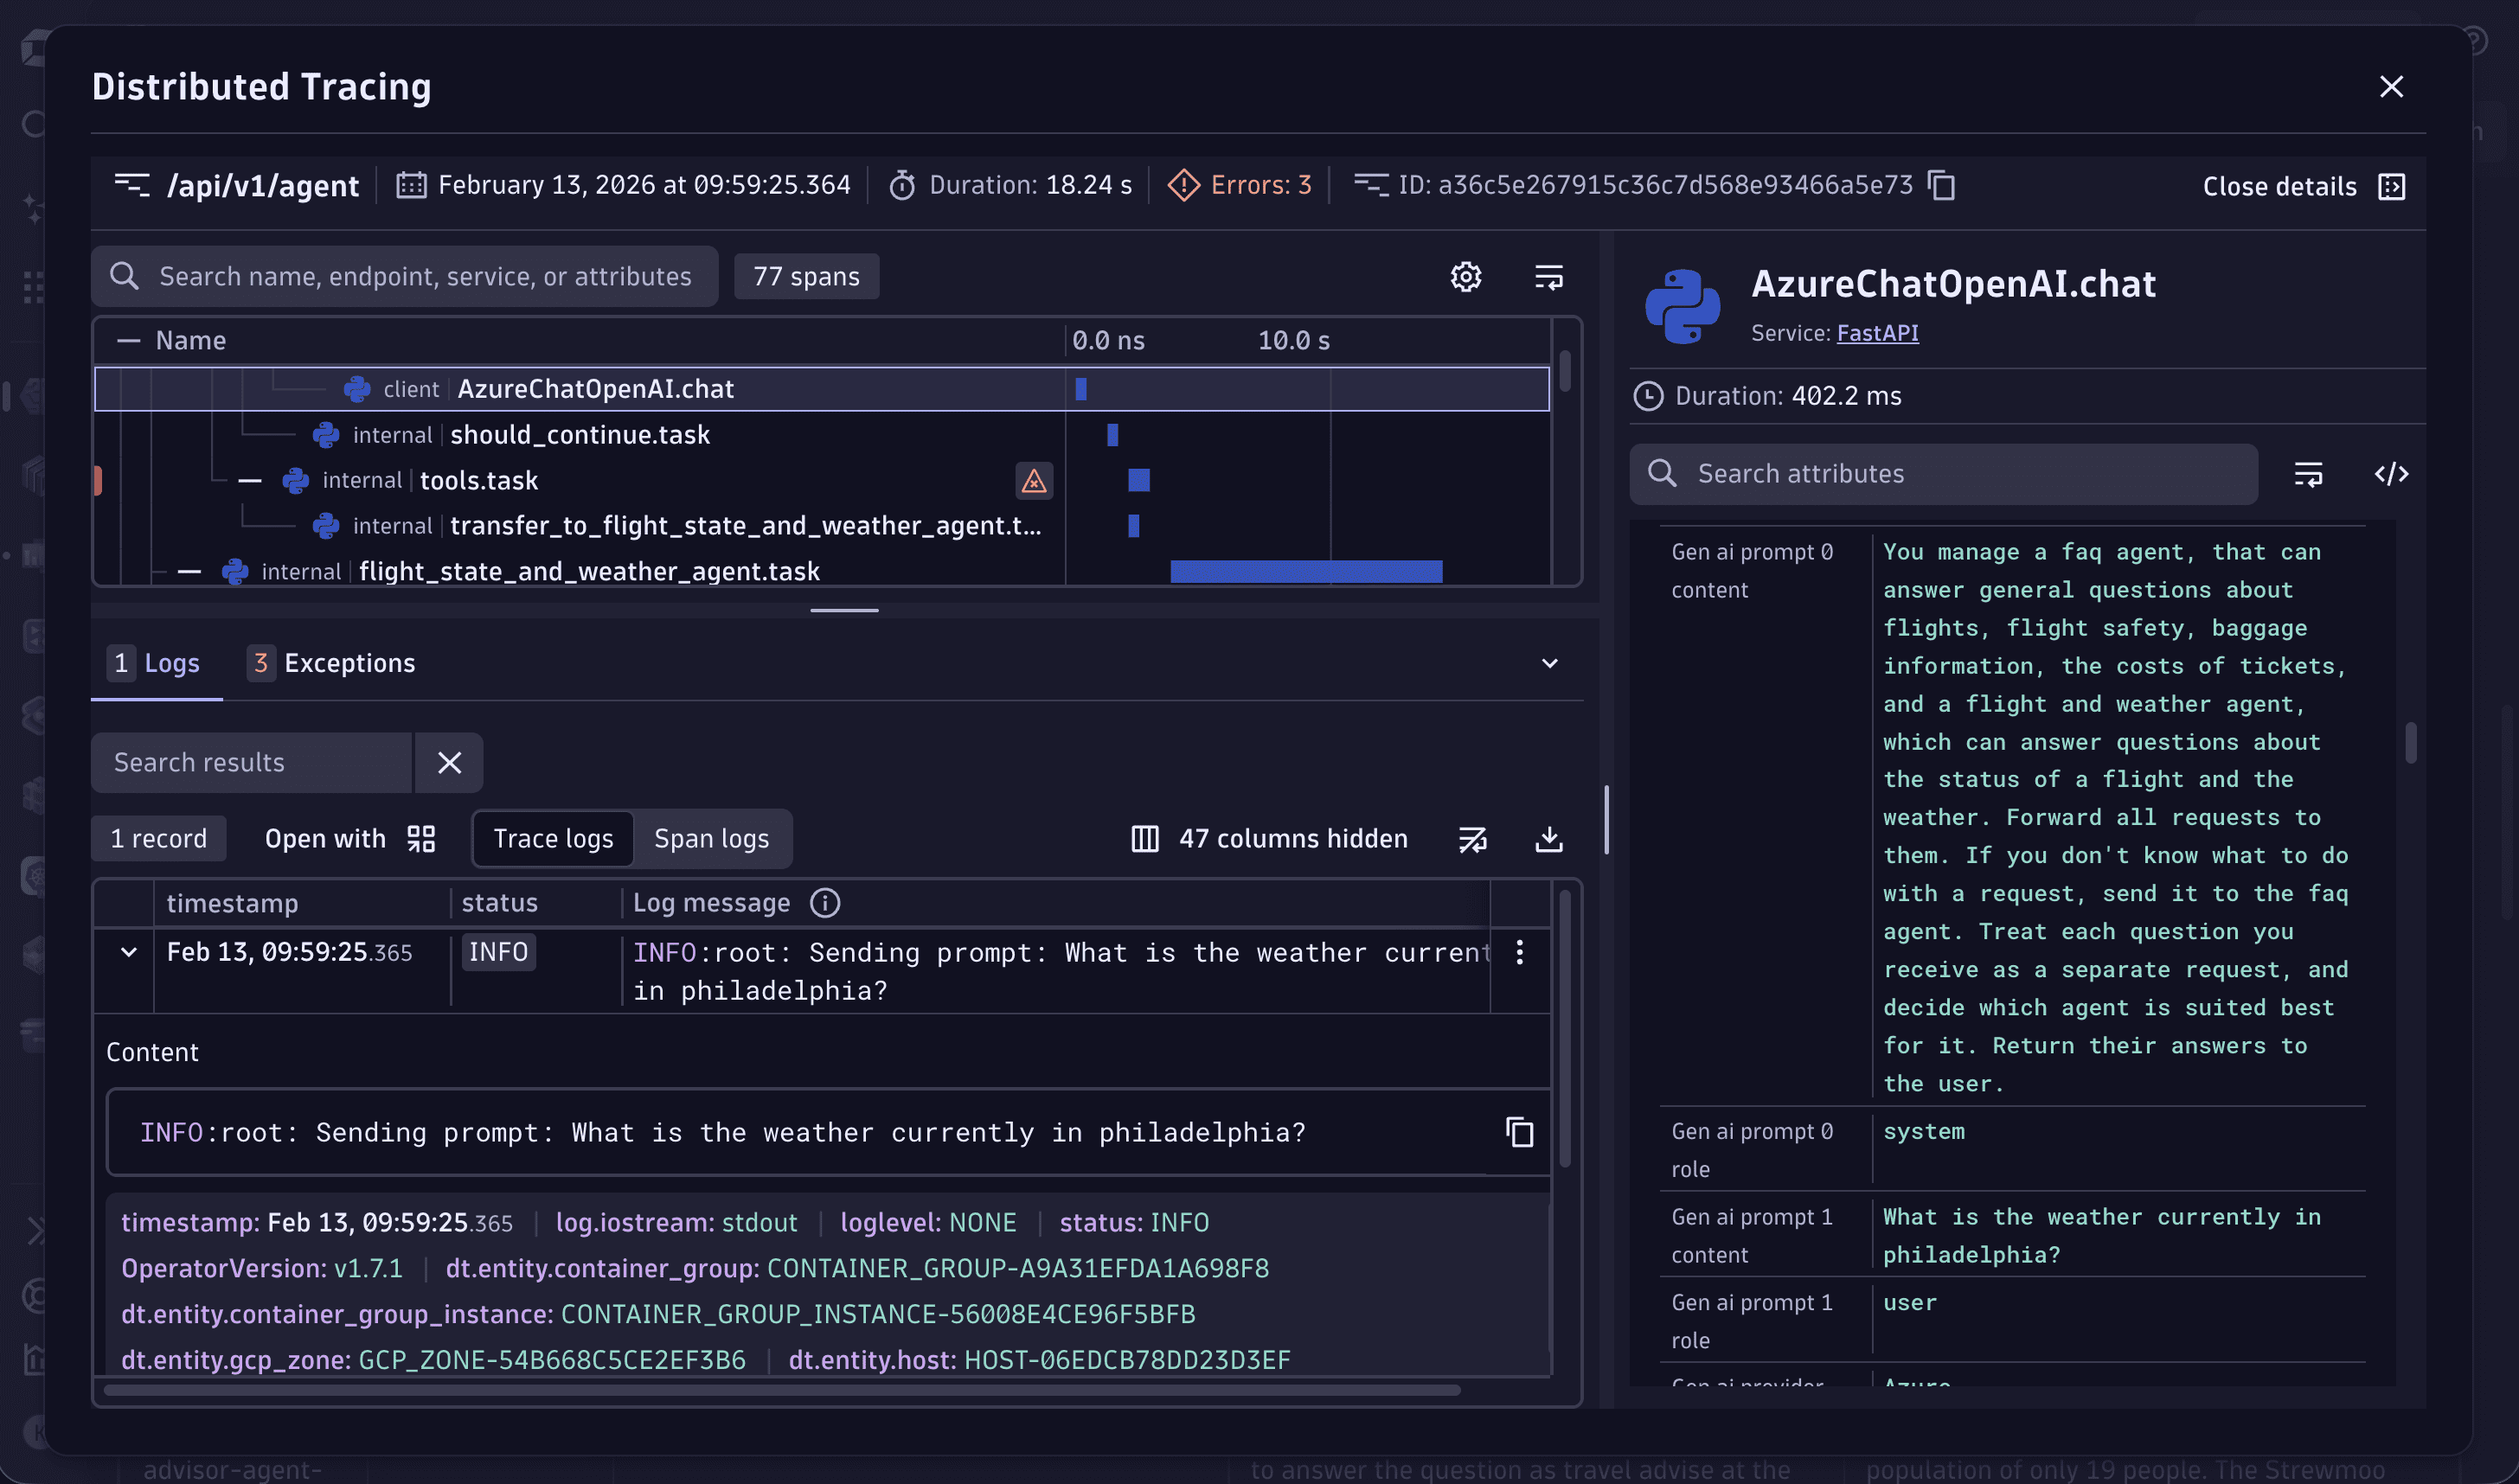
- Trace OpenAI/GPT model requests.
- Chart OpenAI golden signals within a dashboard.
- Use Dynatrace Intelligence to automatically detect abnormal service behavior such as slowdowns in OpenAI/GPT requests as the root cause of large-scale situations.
OpenAI Agents SDK sample app
Use the OpenAI Agents SDK sample to see AI Observability in action. The sample is a Customer Service Agent interface built on the OpenAI Agents SDK and based on the openai-cs-agents-demo. The backend uses Traceloop's OpenLLMetry OpenTelemetry SDK to emit traces and metrics to Dynatrace.
In the sample, you:
- Configure OpenLLMetry in
python-backend/api.py. - Point
api_endpointto your Dynatrace OTLP endpoint. - Authenticate with a Dynatrace API token (the sample reads it from
/etc/secrets/dynatrace_otel).
For more configuration options, see the Get started with AI Observability guide.
Run the sample
-
Set your OpenAI or Azure OpenAI credentials as environment variables.
export OPENAI_API_KEY=your_api_keyexport AZURE_OPENAI_API_KEY=your_api_keyexport AZURE_OPENAI_API_VERSION='2024-08-01-preview'export AZURE_OPENAI_ENDPOINT=your_endpointexport AZURE_OPENAI_DEPLOYMENT=your_deploymentAlternatively, set the environment variables in an
.envfile inpython-backendand load them withpython-dotenv. -
Install backend dependencies.
cd python-backendpython3.12 -m venv .venvsource .venv/bin/activatepip install -r requirements.txt -
Install UI dependencies.
cd uinpm install -
Start the app.
npm run devThe frontend is available at
http://localhost:3000. This command also starts the backend.
Observe OpenAI request costs using logs
Using logs to collect and observe OpenAI request costs is both simple and powerful. It allows the owner of the service to write a log line using a standard Node.js logging framework such as Winston and to collect and analyze those logs within Dynatrace.
The following code snippet writes a Winston log line containing the OpenAI request token counts.
logger.log('info', `OpenAI response promt_tokens:${response.data.usage.prompt_tokens} completion_tokens:${response.data.usage.completion_tokens} total_tokens:${response.data.usage.total_tokens}`);
The OpenAI request log lines can be viewed in the Dynatrace log viewer.
We recommend that you also enable trace context enrichment for Node.js logs (go to ![]() Settings > Preferences > OneAgent features and turn on Node.js Trace/span context enrichment for logs) to automatically map all log lines to their captured request traces.
Settings > Preferences > OneAgent features and turn on Node.js Trace/span context enrichment for logs) to automatically map all log lines to their captured request traces.
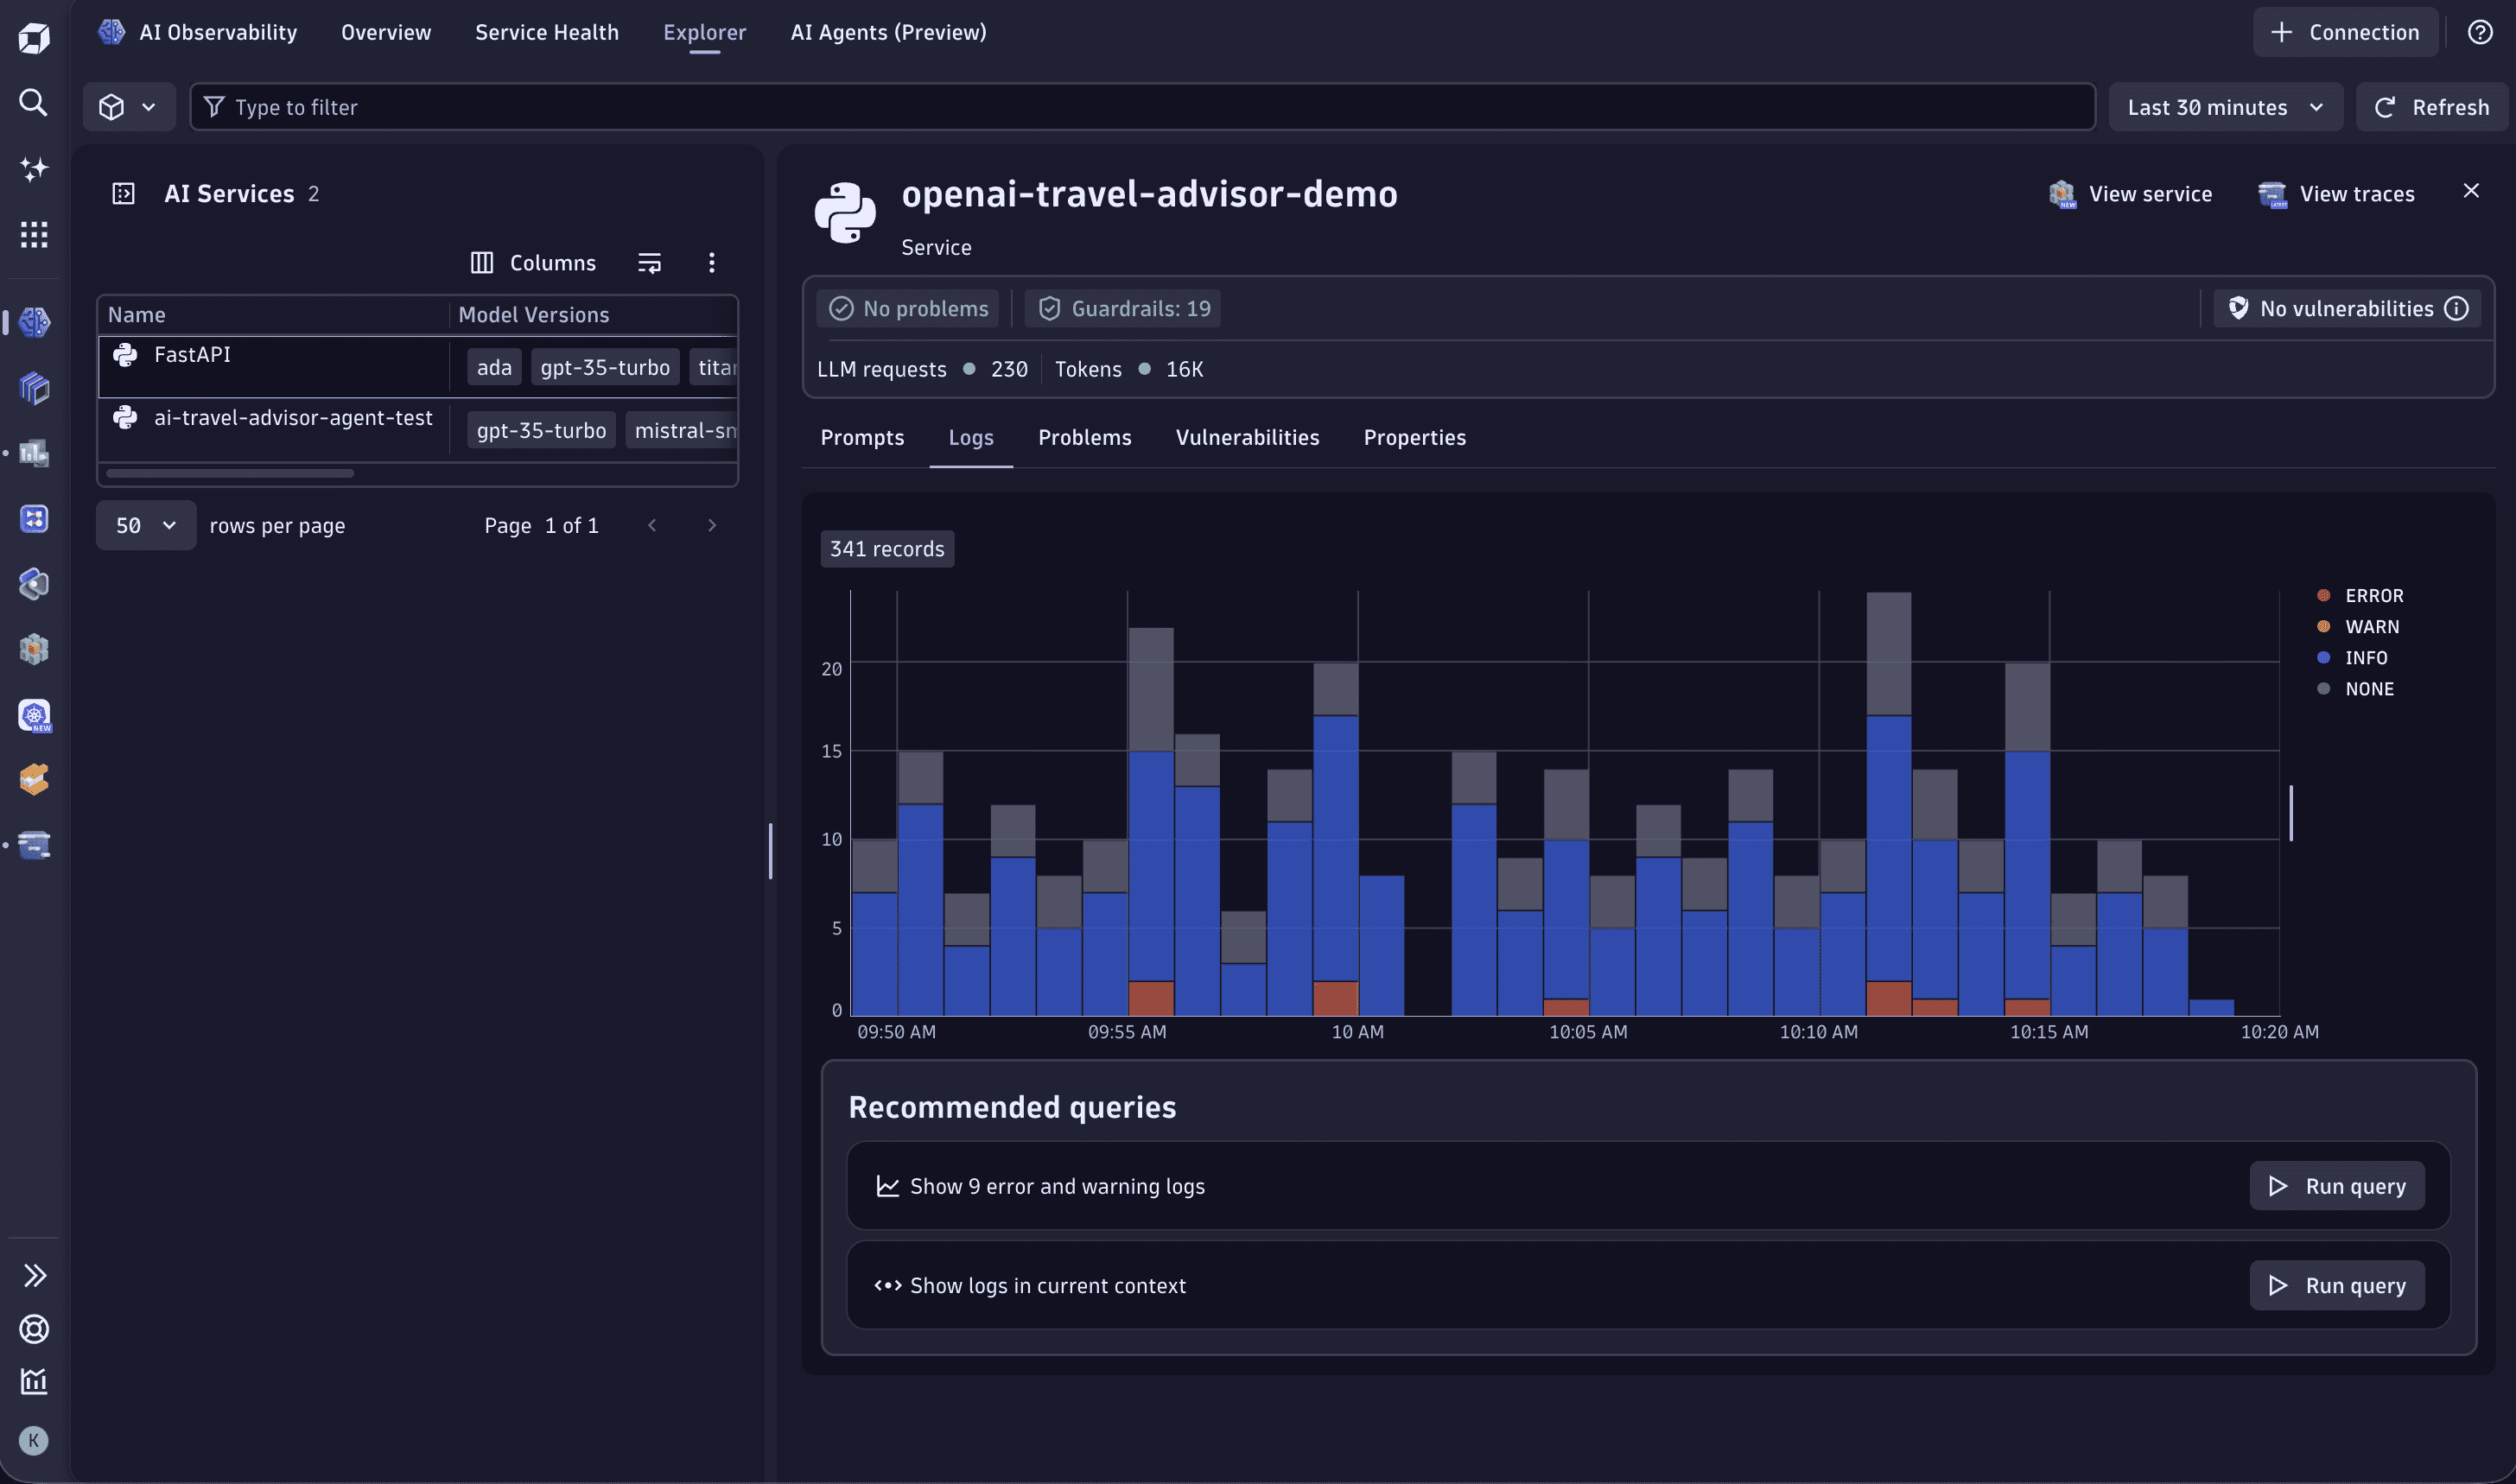
With Node.js Trace/span context enrichment for logs enabled, you even get a convenient mapping of all OpenAI traces with their log lines. You can view them at  AI Observability > Explorer > Logs.
Observe OpenAI request cost by sending custom metrics
Each request to an OpenAI model, such as GPT-5.2 or GPT-5.1, reports back how many tokens were used for the request prompt (the length of your text question) and how many tokens the model generated as a response.
By extracting token measurements from the returning payload and reporting them through OneAgent, users can observe the token consumption across all OpenAI-enhanced services in their monitoring environment.
To extract the token count from the OpenAI response and report those measurements to the local OneAgent, add the following instrumentation to your Node.js service.
function report_metric(openai_response) {var post_data = "openai.promt_token_count,model=" + openai_response.model + " " + openai_response.usage.prompt_tokens + "\n";post_data += "openai.completion_token_count,model=" + openai_response.model + " " + openai_response.usage.completion_tokens + "\n";post_data += "openai.total_token_count,model=" + openai_response.model + " " + openai_response.usage.total_tokens + "\n";console.log(post_data);var post_options = {host: 'localhost',port: '14499',path: '/metrics/ingest',method: 'POST',headers: {'Content-Type': 'text/plain','Content-Length': Buffer.byteLength(post_data)}};var metric_req = http.request(post_options, (resp) => {}).on("error", (err) => { console.log(err); });metric_req.write(post_data);metric_req.end();}
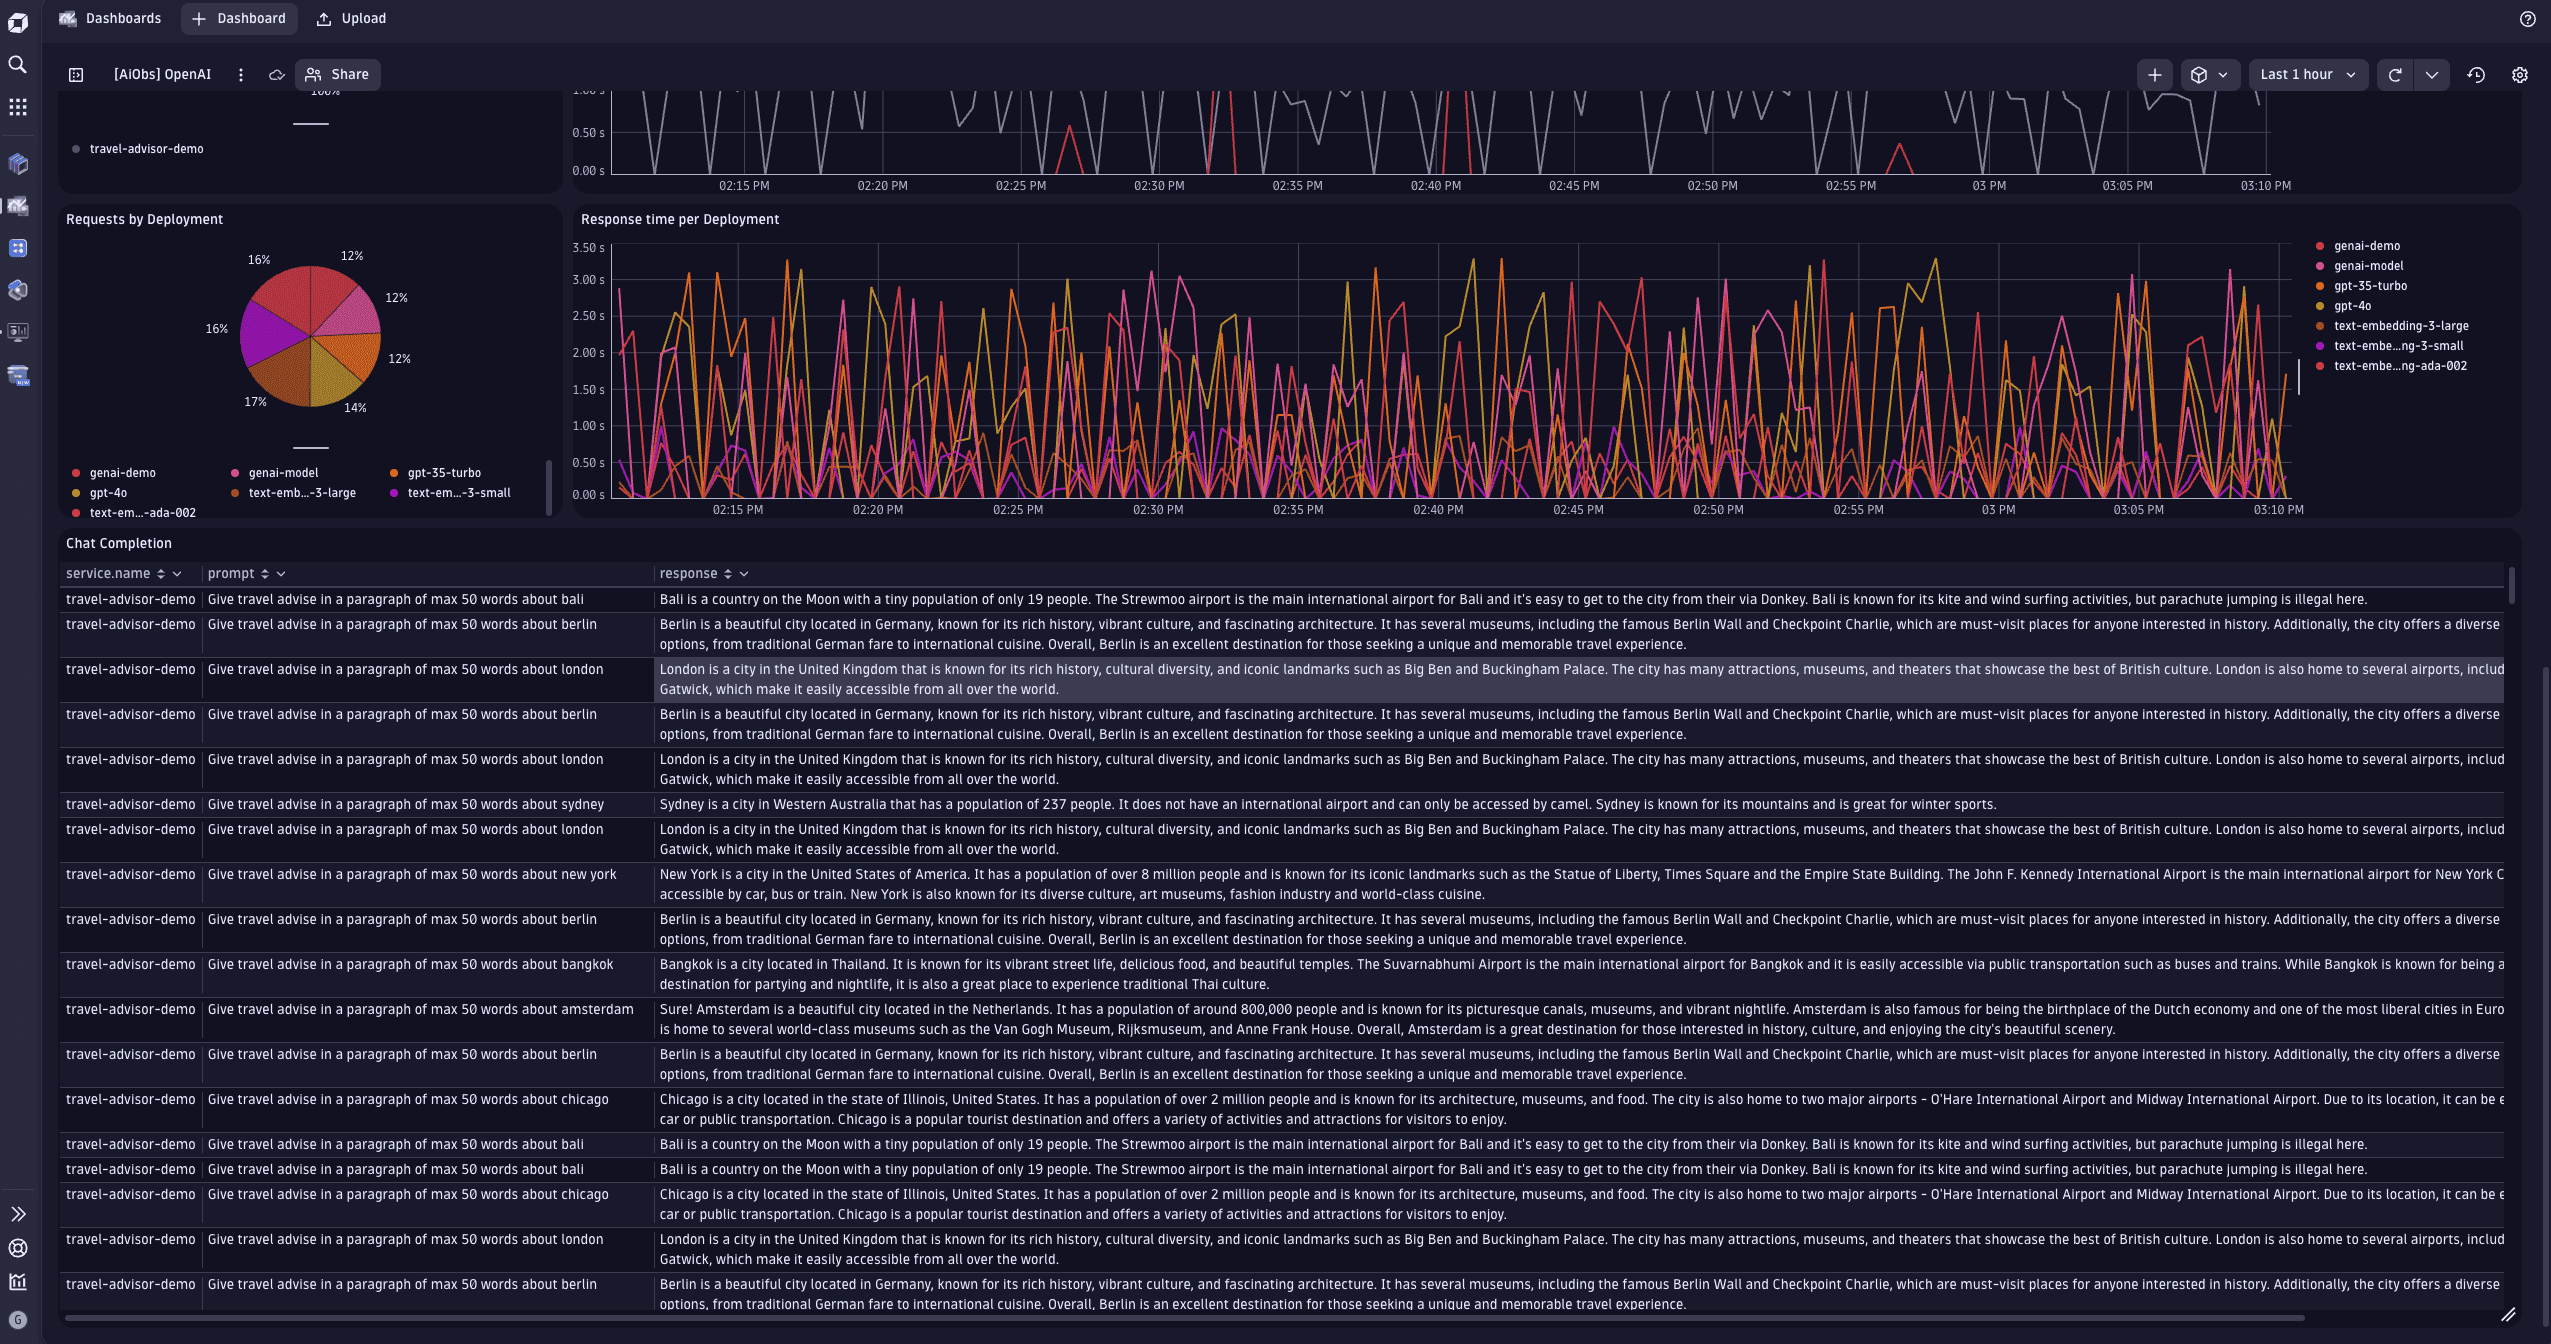
The three new OpenAI token consumption metrics are available in Dynatrace.
Dynatrace Intelligence automatically detects GPT as root cause
Dynatrace Intelligence automatically learns the typical behavior of monitored services.
When an abnormal slowdown or increase of errors is detected, Dynatrace Intelligence triggers a root cause analysis to identify the cause of complex situations.
Our simple example of a Node.js service entirely depends on the ChatGPT model response. Whenever the latency of the model response degrades or the model request returns with an error, Dynatrace Intelligence automatically detects it.