Create and configure a browser monitor
- Latest Dynatrace
- How-to guide
You can create synthetic browser monitors to check the availability of your websites. Browser monitors can be run from our global public or private synthetic locations.
Go to  Synthetic > New monitor > Browser. The configuration settings are split into the following sections:
Go through all the sections one by one and make all needed configurations within each section.
General
To start with, configure the general settings.
-
Name this monitor—enter a name (up to 500 characters) for the synthetic monitor. This name should generally describe all the requests in this browser monitor.
-
Optional New browser monitoring experience—activate or deactivate a new browser monitor experience when using the monitor. For details, see Activate or deactivate new experience for new monitor.
-
Optional Select Add tag in Tags to manually apply tags to the monitor.
-
Optional Select Add tag in Primary Grail® tags to manually apply Primary Grail tags to the monitor. For details, see Primary Grail tags for Synthetic.
-
Select Assign frontends to assign a monitor to a frontend application. You can assign the monitor to multiple frontend applications, and a frontend application can have several assigned monitors. It allows you to track the frontend application availability and performance. Detected problems are then automatically associated with your frontend application. If the monitor's executions fail due to problems with the frontend application, the reported availability rate of the frontend application is decreased within a specific timeframe.
A browser monitor can be assigned to a fronted application automatically if a URL checked by the monitor matches a pattern defined in
 Experience Vitals.
Advanced settings
-
Optional Specify Device profile. You can choose from:
- Existing devices with preset characteristics. You can modify only the orientation—make it either landscape or portrait.
- Custom device—add a new device with custom characteristics like orientation (landscape or portrait), screen height, and screen width, and provide the new device's Custom name.
-
Optional Specify Bandwidth profile. You can choose from:
- Existing profile with ready-to-use presets.
- Custom profile—add a new bandwidth profile with custom characteristics like download speed, upload speed, and latency, and provide the new profile's Custom name.
-
Optional Specify User agent to adjust a user agent HTTP header that is sent from the browser during the monitor executions. When you choose Device profile from Existing devices, Dynatrace pre-populates User agent.
The default Dynatrace user agent during recording and local playback is in the format
Mozilla/5.0 (Windows NT 10.0; Win64; x64) AppleWebKit/537.36 (KHTML, like Gecko) Chrome/{version} Safari/537.36 RuxitSynthetic/1.0 v0 t0 cfeatureHash=7efgijmoqtvx caes=1 ccux=1 sia=1 smf=1, where:-
{version}is the current browser version used for recording. -
v0andt0identify Synthetic Monitoring traffic. -
sia=1indicates faster RUM JavaScript injection (value can be1or0). -
smf=1indicates monitoring of pages in frames (if Capture performance metrics for pages loaded in frames is switched on in Advanced setup; value is0if not switched on). -
cfeatureHash=<value>appears when custom RUM JavaScript settings are switched on in Advanced setup. -
The default user agent string for browser monitor execution from public or private Synthetic locations is
Mozilla/5.0 (X11; Ubuntu; Linux x86_64) AppleWebKit/537.36 (KHTML, like Gecko) Chrome/{version} Safari/537.36 RuxitSynthetic/1.0 v{id} t{id} ath{id} alt{id} cfeatureHash=7efgijmoqtvx caes=1 ccux=1 sia=1 smf=1, where:{id}represents long IDs used by Dynatrace to identify a monitor execution.- Other parameters are as described above.
Note that even if a custom user agent is defined, Dynatrace always automatically adds
RuxitSynthetic/1.0 v{id} t{id} ath{id} alt{id},sia,smf, and, if applicable,cfeaturehashand any key-value pairs beginning withcto the user agent to make sure that Synthetic Monitoring traffic can be identified.
-
Steps
Define the steps. You have two options when you create a browser monitor:
- Set up a monitor to test a single web page against availability and performance. To do so, perform steps 1–7 and step 9 in the guide below (skip step 8).
- Set up a monitor to perform a test scenario that includes a user journey—for example, when they open the home page in a browser, apply search criteria, perform search, and select an option from the search results. To do so, complete all the steps listed below (1–9).
-
Name—provide a step name.
-
URL—provide a URL of a web page you want to test against availability and performance.
-
Optional Provide Context setup. You can specify:
- Cookies that will be sent with requests performed by the monitor.
- Request headers that will be set for all requests performed by the monitor.
- Requests with specific patterns that will be blocked during the monitor executions.
Although you can specify cookies, headers, and requests with specific patterns later in Advanced setup, in some cases it may be reasonable to do it here to ensure smooth recording of a clickpath.
-
Optional Turn on Use HTTP authentication if the website you want to test is protected by HTTP authentication (not handled by web form authentication).
We support a basic HTTP authentication and Kerberos authentication. If you choose Kerberos as an authentication, also provide a realm name and authentication server allow list. For more details about authentication methods, see Supported authentication methods in Synthetic Monitoring.
You can choose how you want to store credentials.
-
Credential Vault—a recommended option since it provides more security. Select previously existing credentials or add new ones.
You can add new credentials in both
Synthetic ( Add credential) and previous Dynatrace (Credential vault (classic)). -
Monitor script—provide a username and password.
-
-
Optional Choose the Condition to consider this step as done to define a waiting time between steps.
-
Optional In the Validate content section, set up content validation rules.
-
Optional Set up a performance threshold for loading of the page specified in the URL.
-
Record a clickpath or add steps manually. Use this functionality if you want the monitor to perform a test scenario that includes a user journey—for example, when they open the home page in browser, apply search criteria, perform search, and select an option from the search results. For details, see Record a browser clickpath.
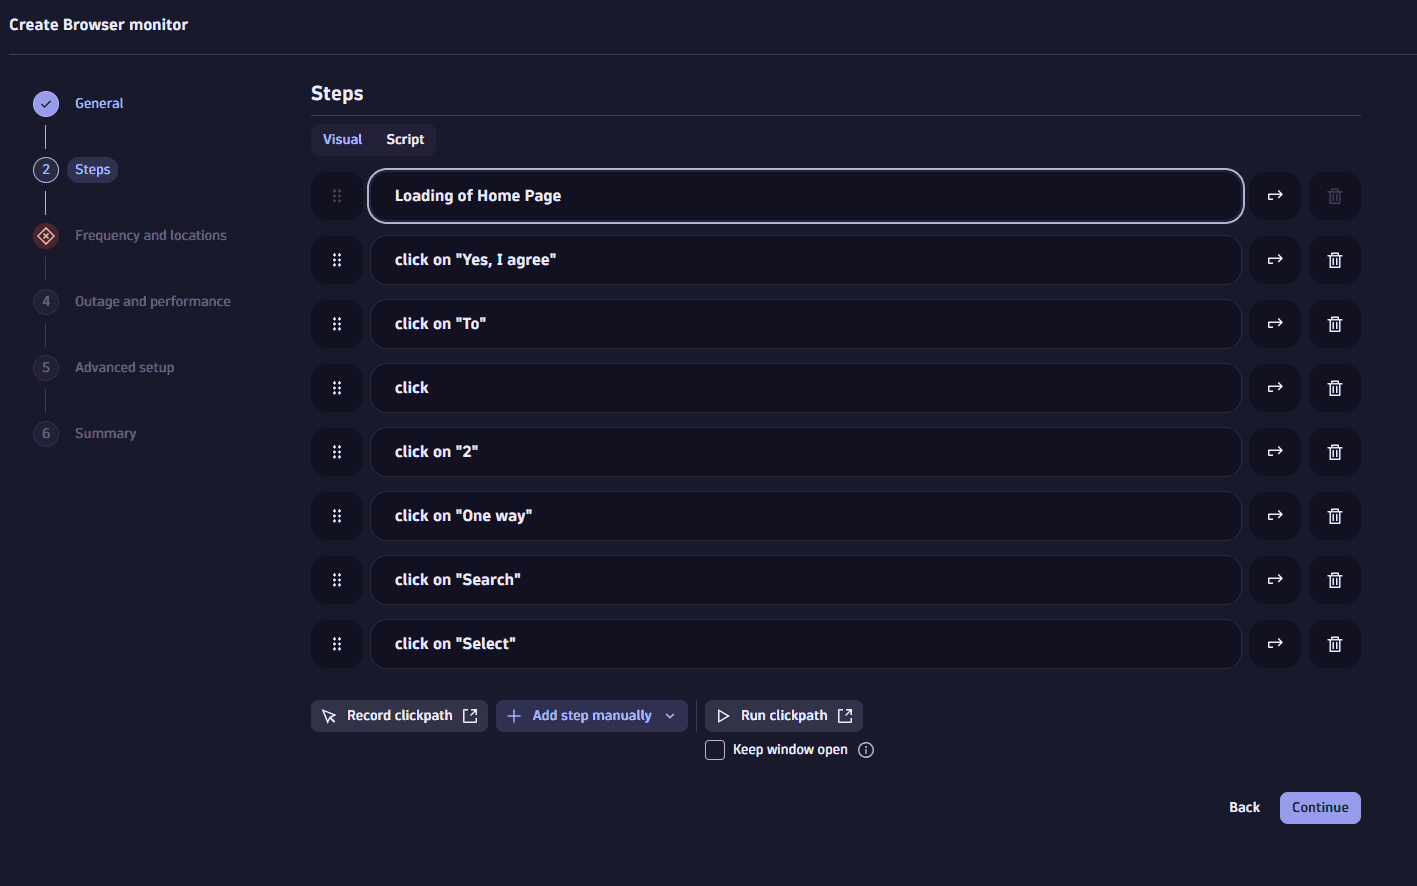 Browser monitor steps
 -
Select Continue to proceed with the monitor configuration.
Frequency and locations
Two factors make up your monitoring schedule—how frequently your browser monitor runs and the number of locations it's executed from.
Dynatrace offers a global network of public Synthetic Monitoring locations out of the box. You can also create private Synthetic locations within your own network infrastructure. Both public and private locations appear on this settings page.
The frequency and number of locations determine the number of monitor executions per hour. For example, running a monitor from 3 locations every 15 minutes results in 12 executions per hour (4 times per hour from each of the 3 locations). Monitor executions are evenly spaced within the selected interval. That is, for a monitor running from 3 locations every 15 minutes, executions are triggered at 5-minute intervals.
You can choose a frequency of every 5, 10, 15, or 30 minutes; or 1, 2, or 4 hours. You can also set up your monitor to be executed On demand only. You can select multiple global locations from where your browser monitor is to be executed.
Note that all public Synthetic locations are set to Coordinated Universal Time, or UTC. If your monitor script requires the local time or time zone, you can use the api.getContext() method and the system clock to implement conditional logic.
Outage and performance
You can set global and local Outage handling and Performance thresholds for the sum of all requests.
-
Generate a problem and send an alert when this monitor is unavailable at all configured locations (global outage).
This setting is turned on by default for newly created monitors. It alerts you of global availability outages, that is, when all locations experience a failure simultaneously.
By default, a global outage problem is generated when all locations fail one time. However, you can specify the number of consecutive failures (from 1 to 5) for a global outage problem, that is, how many times all locations need to fail consecutively in order to generate a global outage problem.
-
Generate a problem and send an alert when this monitor is unavailable for one or more consecutive runs at any location. Local outage problem generation is available only when at least two locations are assigned.
This allows you to raise a problem when there are consecutive failures at one or more locations. At the environment level, you can choose the number of failures. At the monitor level, you can also determine the number of monitor locations that need to fail in order to generate a local outage problem.
Automatic retry on error is turned on by default (you can turn it off if needed), which means that failing monitor executions are retried immediately one time to avoid false positives, and only the second result is taken into account. When turned off, we proceed with the first result right away.
For Performance thresholds, you can turn on:
-
Generate a problem and send an alert on performance threshold violations.
This setting provides an option to set the Threshold for the sum of all requests (in seconds). If the threshold exceeds the time you provided, you'll be notified.
Also, you can set a performance threshold for separate steps.
Advanced setup
This tab contains controls for:
Use client certificates
Dynatrace version 1.272+
ActiveGate version 1.271+
You can set up certificate authentication for browser monitors running on any public location and private locations with Linux-based ActiveGates (containerized as well as non-containerized).
Before first recording a clickpath on a website that requires certificate authentication, ensure that you have installed the required certificate in Chrome. Then, when you navigate to the website in the recording window, the native browser dialog simply selects the correct certificate.
If there is at least one expired certificate in a chain, the whole chain can be rejected. It results in failing monitor executions. The results can be different when using the same certificate chain with an HTTP monitor or when running a curl command manually from the host.
After you record the clickpath, you need to specify the certificate to use for browser monitor execution.
-
Select Add certificate.
-
Enter the Domain that the certificate is valid for.
-
Select a credential from the list of certificate credentials displayed. Alternatively, select Create new credential to upload and use a new client certificate. Any certificate credential you create is automatically designated as owner only and stored in the credential vault.
You can specify and upload certificate files in PFX, P12, or PEM format.
Set cookies
Cookies allow you to store browser state information on the client side so that each monitor execution is based on the same state and you can accurately monitor a performance baseline.
The cookies set in Advanced setup are valid for the entire monitor execution. If you want to set cookies only for a specific portion of your clickpath, use the Cookie step.
Select Add cookie, provide a Name and cookie Value. Every cookie must be unique within the list.
The following symbols are not allowed in the cookie value: ;,\". Provide the Domain of the cookie, and optionally, the Path to the cookie.
Add additional HTTP headers
The monitor is created with a bare minimum set of headers required by the protocol.
- Select Add header.
- Enter a Header name and Value.
You can specify multiple HTTP headers. They will be set for all requests the monitor makes.
If you want to set headers only for specific requests, select Only apply headers to requests matching a pattern and then define a Pattern. After that, the header is only set for requests that match the pattern you’ve defined.
Block specific requests
You can block one or more requests by specifying complete URLs or match patterns. The URL or regex string cannot exceed 90 characters and is case insensitive.
Blocking requests allows you to analyze how these requests affect your application's performance and optimize it accordingly.
Select Add pattern, and then provide a complete URL.
You can also define patterns, for example, http:*://*/*.png or https*://*/*.png to block all requests to PNG images.
Matching requests are blocked throughout monitor execution and aren’t dependent on events.
If you're unable to block specific requests, refer to the Dynatrace Community article Unable to block specific requests (owing to limitations on the length of regular expressions).
Ignore specific status codes
This allows you to exclude HTTP status codes 400–599 from causing availability outages/errors if encountered in the main document request. Typically, this is the base page in a load action. If this setting is turned on, and the base page of a load action encounters HTTP errors 400–599, an availability outage is not triggered.
You can specify an exact status code, range, or status class mask. Use commas to separate multiple values; use the minus sign (-) with no spaces for a range, for example, 404, 405-410, 5xx. You can apply the rule only to document requests that match a specific regular expression (Only apply to document request matching this regex).
- This setting does not apply to XHR requests or document requests in iframes; browser monitors do not fail when an XHR request or a document request in an iframe fails.
- This setting applies to future executions, that is, executions that take place after the setting is turned on.
Custom RUM JavaScript settings
Capture XmlHttpRequest (XHR) and Capture fetch() requests are turned on by default. You can turn them off.
Other
Bypass Content Security Policy (CSP) of monitored page—if you have a Content Security Policy in place, it's likely to prevent the browser from sending monitoring data to the Dynatrace Cluster. As a first and preferred method to have Chrome bypass the CSP of any monitored pages in your single-URL browser monitor or browser clickpath, turn on this option. If you're unable to use this option for some reason, refer to the advanced solutions for bypassing CSP in the Dynatrace Community article Browser monitors: Issues with Content Security Policy.
Capture performance metrics for pages loaded in frames—turn this on to begin capturing performance data for pages in iframes or framesets.
Summary
See the summary of all the steps and the estimated monthly number of actions. If everything's OK, and no more adjustments are needed, Save the newly configured monitor.