OneAgent for Android configuration
- Latest Dynatrace
- How-to guide
The Dynatrace OneAgent for Android is configured primarily through the Dynatrace Android Gradle plugin in your
build.gradle or build.gradle.kts file. This approach allows you to define configuration settings at build time. If
you start OneAgent manually, you can also configure certain settings at runtime using the OneAgent SDK.
Debug logging
Enable debug logging to troubleshoot issues with data collection or agent initialization. OneAgent then writes detailed log output to the Android system log.
Debug logging is intended for development and troubleshooting purposes only. Do not enable it in production environments. Additional logging might slow down your app or write sensitive information to the device logs.
Enable debug logging
You can enable debug logging via the Dynatrace Android Gradle plugin or the OneAgent SDK for Android.
Dynatrace Android Gradle plugin
Enable debug logging via the agentLogging property.
dynatrace {configurations {sampleConfig {debug {agentLogging true}}}}
OneAgent SDK
If you start OneAgent manually, enable debug logging using the ConfigurationBuilder.withDebugLogging(boolean)
method.
Dynatrace.startup(this, new DynatraceConfigurationBuilder("<YourApplicationID>", "<ProvidedBeaconURL>").withDebugLogging(true).buildConfiguration());
Retrieve logs from the device
OneAgent for Android uses the default log framework from Android. You can use the Logcat window in Android Studio or the command-line logcat tool to view log messages.
To retrieve the Android logs via the Logcat window in Android Studio
-
Connect your device to your computer or run the emulator.
Note that your device should be set up for development.
-
In Android Studio, select View > Tool Windows > Logcat, and then select your device.
-
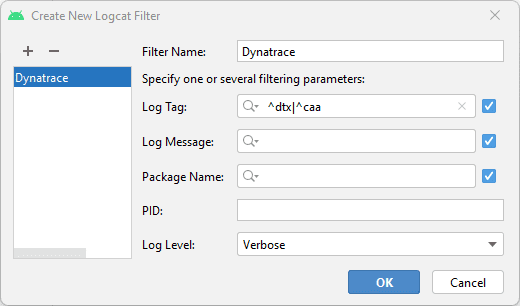
Create a filter.
Follow the steps below if you've enabled the new Logcat tool in Android Studio Dolphin or if you're using Android Studio Electric Eel.
-
Enter
tag~:^dtx|^caain the filter box. -
If you've adjusted the formatting option, switch to the default Standard View option.
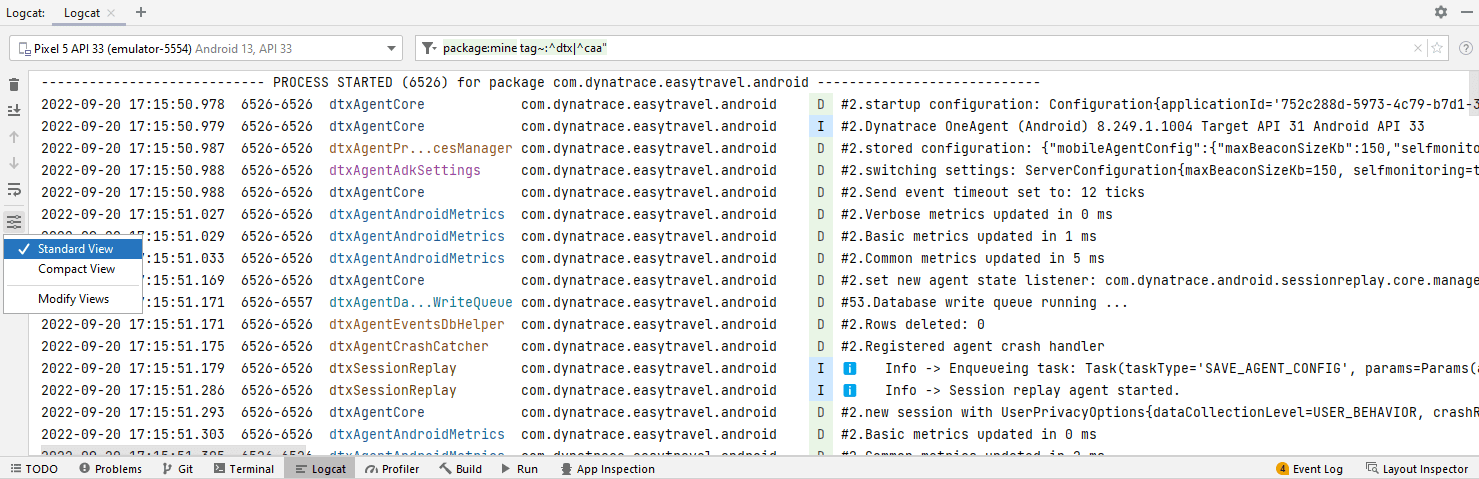 The Logcat window in Android Studio showing the tag filter applied to display Dynatrace OneAgent log output
-
-
Open the instrumented app by using the debug flags.
-
Copy and paste the log lines into a text file, and review them for sensitive content such as URLs, user identifiers, or application data before submitting to support.