Waterfall analysis
- Latest Dynatrace
- Reference
- 8-min read
The waterfall analysis in  Experience Vitals provides detailed visualization of resource loading, request timings, and correlated events for individual page loads and user actions. Use it to identify performance bottlenecks, analyze request patterns, and understand the full sequence of events—for both web and mobile frontends.
Access waterfall analysis
You can access the waterfall analysis from pages and user actions.
To access the waterfall analysis from a page
- Go to Experience Vitals.
- Select a web frontend in the Explorer view and select Analyze performance, or directly select a frontend in the Performance view.
- Navigate to the Pages section and drill down into a specific page.
- Select Perform waterfall analysis.
To access the waterfall analysis from a user action
- Go to Experience Vitals.
- Select a frontend in the Explorer view and select Analyze performance, or directly select a frontend in the Performance view.
- Navigate to the User actions section and select a user action.
- Select Perform waterfall analysis.
Page load waterfall
The page load waterfall shows the full sequence of resource requests for an individual page load, so you can identify what is slowing down load performance.
Page load instances
The Page load instances table displays individual page loads captured during the selected timeframe.
Available columns:
- Start time: The timestamp when the page load began
- Country
- Browser and browser version
- Errors: The number of errors encountered during the whole page instance (not only the page load)
- Long tasks: The count of long tasks that may have blocked the main thread during the whole page instance (not only the page load)
- Core Web Vitals and W3C navigation timings of the page
Waterfall visualization
When you select a page load instance, the waterfall panel opens. It shows each individual request with its type, name, size, timings, initiator, render-blocking status, and a Gantt chart.
The Gantt chart includes vertical milestone markers—TTFB, DOM Interactive (DI), Load Event End (LEE), and LCP—so you can correlate individual resource loading behavior to key page timing milestones at a glance.
Selecting any request reveals detailed information and further drill-down options. Hovering over Gantt chart entries shows phase timing details.
User action waterfall
The user action waterfall shows the correlated event timeline for an individual user interaction, covering requests triggered on both web and mobile frontends.
User action instances
The User action instances table displays individual user actions captured during the selected timeframe, including key fields such as start time, duration, request and resource counts, completion status, and error count.
Waterfall visualization
When you select a user action instance, the waterfall panel opens. It shows the full correlated event timeline for the user action:
- The triggering user interaction (for example, a click event)
- The user action span covering the full duration
- Individual correlated requests with their type, name, size, duration, initiator, and render-blocking status
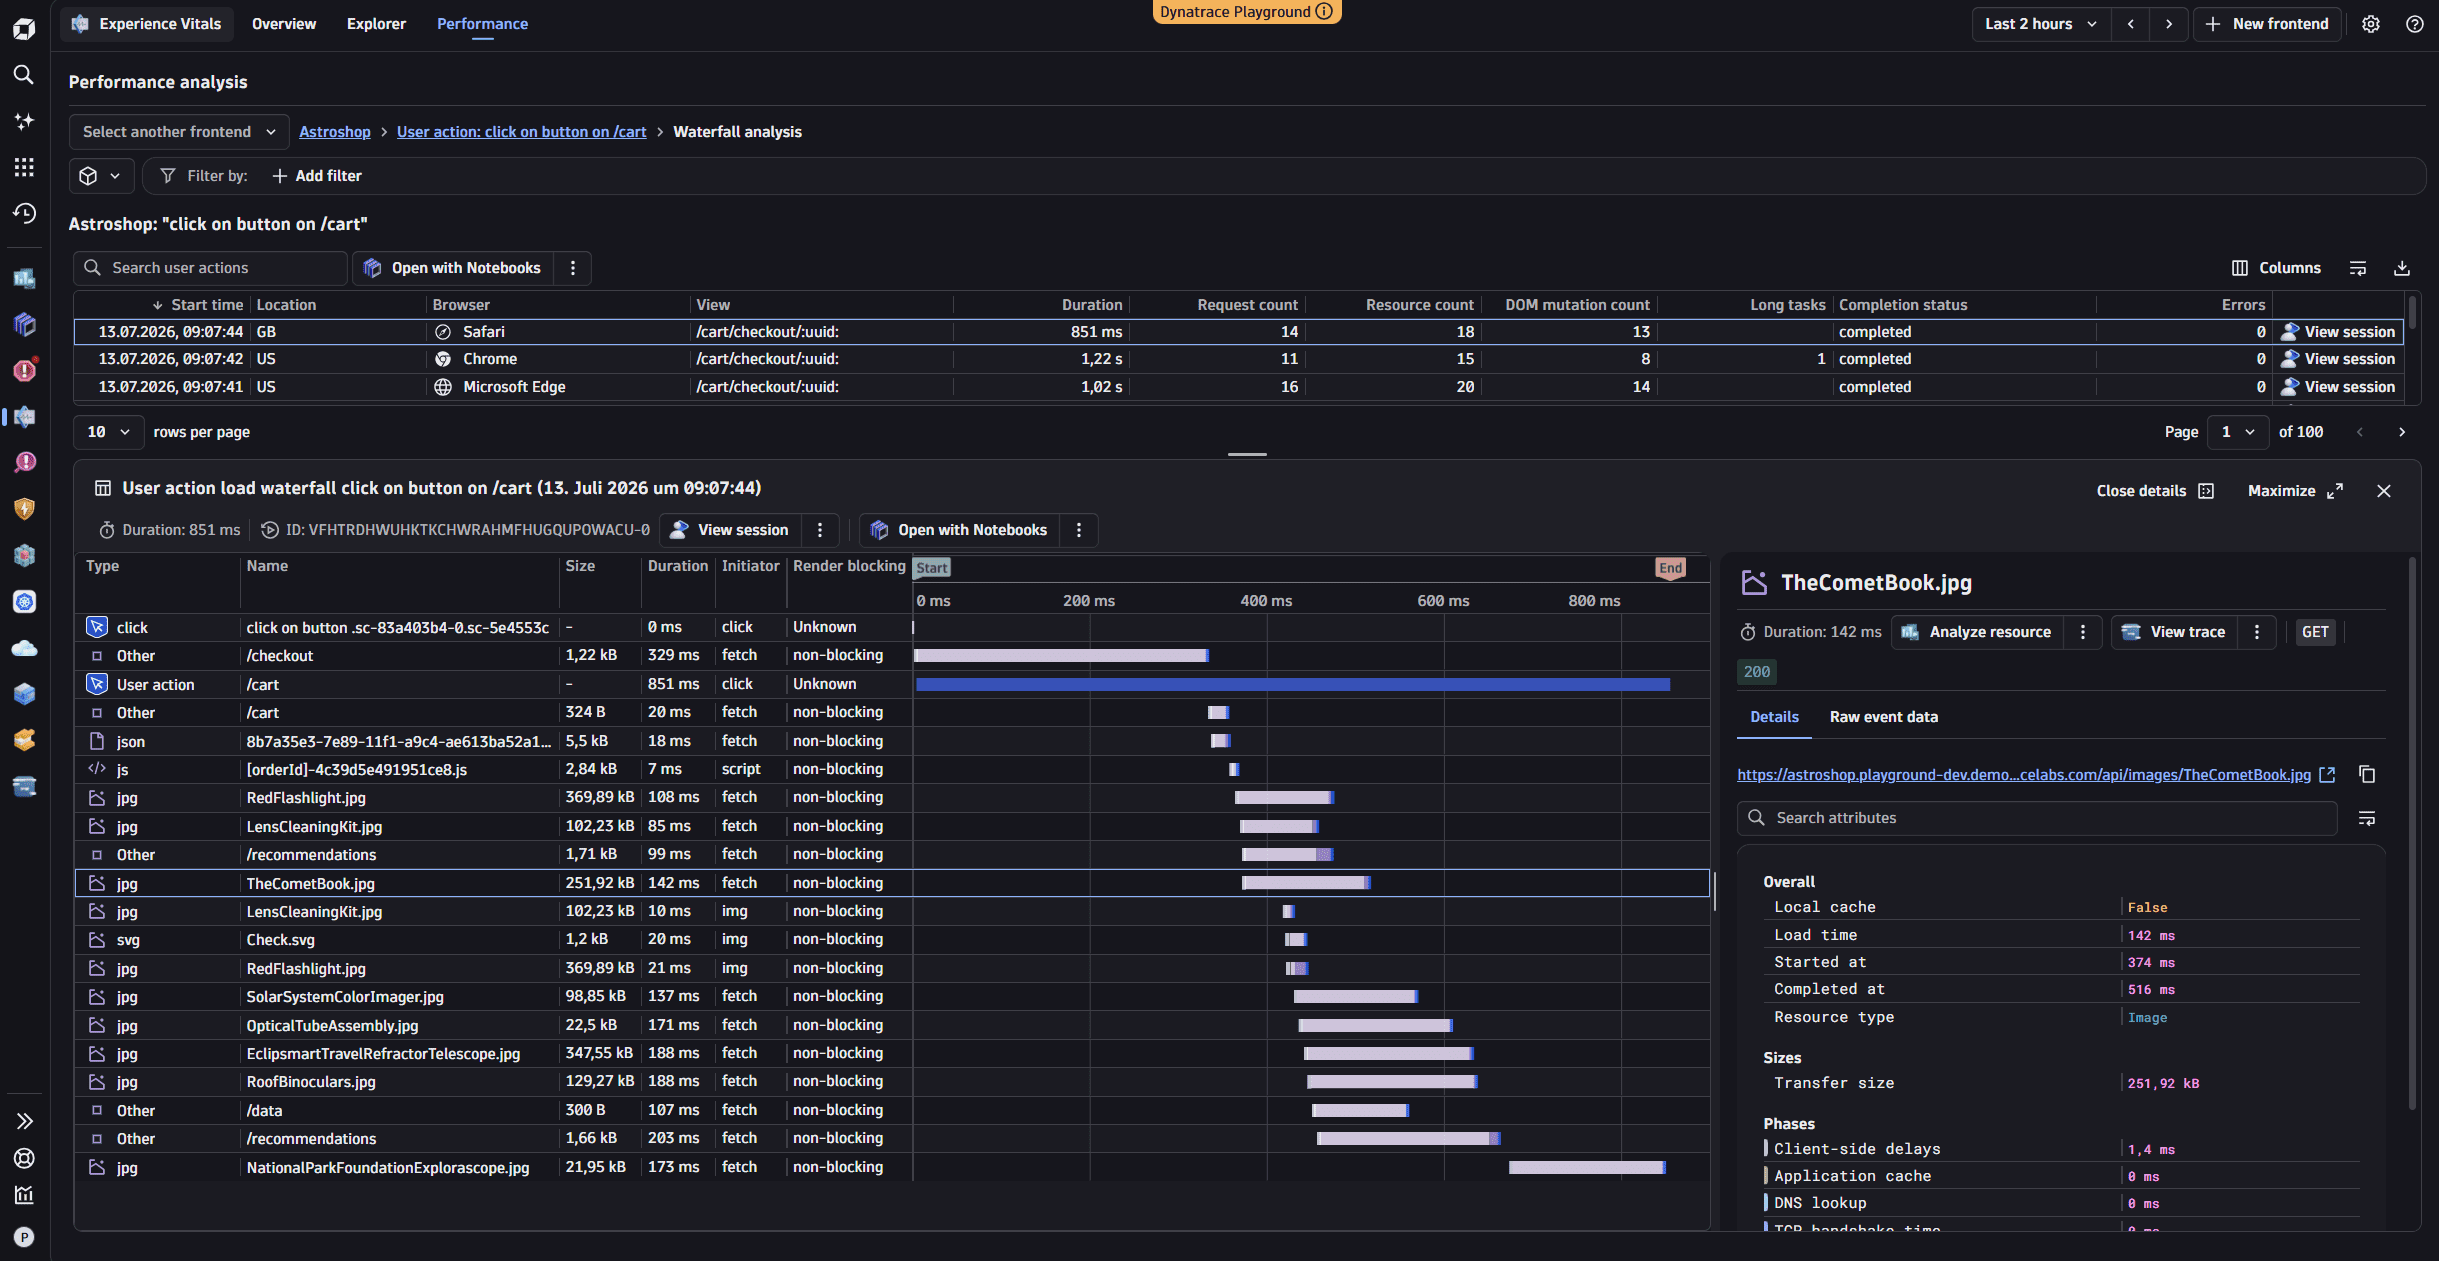
The user action waterfall is available for both web and mobile frontends.
Identify slow resources
Use the page load waterfall to identify resources that are taking too long to load:
- Sort page instances by duration or specific metrics like TTFB or LCP
- Select instances with poor performance
- Examine the waterfall to find resources contributing to slow load times
- Look for resources with long response times or render-blocking behavior
Analyze user action performance
Use the user action waterfall to understand what happens during a user interaction:
- Sort user action instances by duration or request count to identify slow or resource-heavy actions
- Examine correlated requests within the user action span to pinpoint bottlenecks
- Filter by completion status to compare completed actions against interrupted ones
- Use the correlated event timeline to verify that interactions trigger the expected requests
Compare performance across conditions
Filter instances by:
- Browser type and version: Identify browser-specific performance issues
- Geographic location: Understand performance variations by region
- Error conditions: Compare successful interactions with failed ones
- Time periods: Analyze performance trends over time


 Experience Vitals