Finalize the initial setup for your auto-injected frontend
- Latest Dynatrace
- How-to guide
After setting up a new auto-injected frontend, the charts in  Experience Vitals should begin displaying data within ten minutes if your frontend is receiving traffic. If they don't, your setup may require further configuration steps. This guide walks you through a series of checks to help you identify whether further configuration is needed.
Check whether RUM data is mapped to a different frontend
The frontend to which the captured data is mapped is determined by the frontend detection rules you specified during setup. If the defined rules fail to map the HTML document requests to the intended frontend, the captured data is assigned to another frontend with a matching rule, or—if no rule matches—to the catch-all frontend.
Determine whether data has been captured
To check whether data has been captured and mapped to another frontend
- Go to
 Notebooks and open an existing notebook, or create a new one by selecting Notebook.
 - Select > DQL.
- Run the following DQL query, replacing
https://example.com/pathwith the URL of the page you're instrumenting. Use the URL as requested by the browser, without any server-side rewrites.
fetch user.events| filter matchesPhrase(page.url.full, "https://example.com/path")| filter matchesValue(dt.openpipeline.source, "rumagent")| summarize by: {frontend.name}, count()
If the query returns an empty response, no user events have been captured for this page. In that case, continue to Verify that the RUM JavaScript is injected.
Identify the frontend where the data was mapped
The query returns the number of user events captured for the page and includes the frontend.name field, which specifies the frontend to which the events were mapped. To identify which frontend the returned frontend.name refers to
- Go to Experience Vitals > Overview.
- Select Web to view all web frontends.
- Select to display the frontend.name column. You can now locate the
frontend.namevalue from the query results in the table.
Identify the cause
When RUM data is mapped to a different frontend than expected, it is typically due to one of the following causes:
- Use of the fragment identifier in the rule pattern, for example the
#overviewpart inhttps://example.com/docs#overview. For more information on which parts of the URL are supported, see Learn how frontend detection rules are applied. - Failure to account for uninstrumented components during setup. For more information, see Account for uninstrumented components.
- Failure to bring frontend detection rules in the correct order. For more information, see Set the order of frontend detection rules.
Verify that the RUM JavaScript is injected
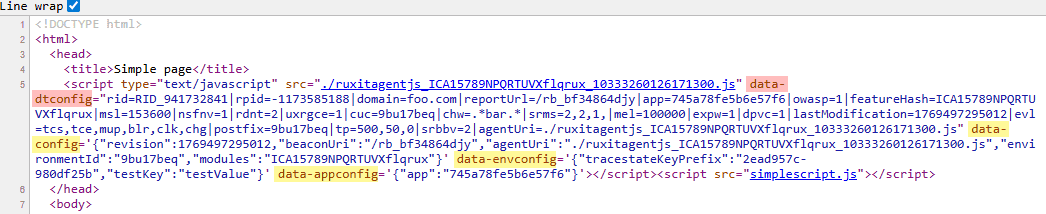
To verify that the RUM JavaScript is injected into the HTML of your page, look for a script element containing the attributes data-config, data-envconfig, and data-appconfig. If you find such an element, the RUM JavaScript has been injected, including the configuration for the New RUM Experience. In this case, continue to Verify that the monitoring code downloads successfully.
If no script element with these attributes is present, check instead for a script element that contains the string data-dtconfig. If you find it, injection was successful, but the New RUM Experience is not active. See Enable the New RUM Experience for your RUM Classic web applications to learn how to activate it.
If you cannot find any such script element, automatic injection did not occur.
RUM is turned off for "Do Not Track"-enabled browsers
If you enabled Turn Real User Monitoring off for "Do Not Track"-enabled browsers in the data privacy settings, and your browser is configured to include the DNT header, OneAgent does not inject the RUM JavaScript. While verifying your setup, configure your browser to not include the DNT header.
Malformed HTML
In some cases, OneAgent may be unable to perform injection using its built-in rules. This is typically due to malformed HTML, though other rare conditions may also prevent the ruleset from identifying a suitable injection point. To address this, create a custom injection rule that injects before or after a specific HTML pattern.
Verify that the monitoring code downloads successfully
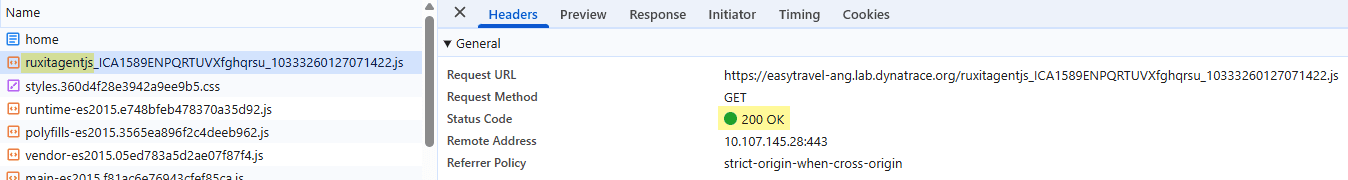
Unless you selected the snippet format inline code, the monitoring code is downloaded as a separate file. In environments that do not have a custom monitoring code filename prefix configured, the filename starts with one of the following prefixes:
ruxitagentjs_—if the request is handled by OneAgent, which is the default behavior.ruxitagent_—if you configured the monitoring code to be requested from the Dynatrace CDN.
If the browser developer tools show a 200 OK response for this request, the download was successful and you can continue to Verify that RUM beacons are being sent to Dynatrace. Otherwise, further configuration is required.
CSP rule violations
If you see CSP rule violations in the browser console associated with loading the monitoring code, adjust the CSP rules defined in your application. For details, see Allow the loading of external monitoring code.
No application deployed at the root
When OneAgent handles monitoring code requests, they are often sent to the root of the web or app server. These requests may return response codes such as 404 Not Found or 503 Service Unavailable if no application is deployed at the root.
In this case, configure the URL path as described in Modify the monitoring code URL path.
Requests are blocked by infrastructure components
Monitoring code requests may be blocked by infrastructure components such as firewalls and proxies.
Depending on how the component is configured, it is often possible to prevent the requests from being blocked by choosing a different configuration for the monitoring code source. Otherwise, ensure that your infrastructure allows monitoring code requests to pass; see Infrastructure pass-through requirements for the New RUM Experience.
Verify that RUM beacons are being sent to Dynatrace
The RUM JavaScript sends beacons containing captured data to the beacon endpoint. By default, the beacon endpoint for an auto-injected frontend is the OneAgent that instruments the web or app server hosting the application. If the New RUM Experience is active, beacons in a new format are sent alongside RUM Classic beacons to the same endpoint.
To identify RUM beacons in your browser's developer tools, look for requests where the last URL path segment has the prefix rb_. Beacons in the new format include the query string parameter pv=4.
No beacons being sent
If the browser developer tools don't show any beacons, check the following aspects of your setup:
- If you enabled data-collection and opt-in mode during setup, your code needs to call
dtrum.enable() from the JavaScript API after the user accepts your data privacy policy. Only then will the RUM JavaScript begin sending data. - If you selected the snippet format inline code, your browser's console may display a CSP rule violation indicating that an inline script was blocked. In this case, adjust your CSP rules as described in Allow the execution of inline code.
Beacons blocked due to CSP rule violations
If you see CSP rule violations in the console indicating that a connection to the beacon endpoint was blocked, adjust the CSP rules in your application. For details, see Allow sending RUM beacons.
No application deployed at the root
When OneAgent handles RUM beacons, they are often sent to the root of the web or app server. These requests may return response codes such as 404 Not Found or 503 Service Unavailable if no application is deployed at the root.
In this case, configure the URL path as described in Modify the beacon endpoint URL path.
Requests are blocked by infrastructure components
Beacon requests may be blocked by infrastructure components such as firewalls and proxies. You can determine where a beacon request was handled by looking at the response body—beacon requests that failed at the beacon endpoint return a JSON response containing the fields status, handler, errorCode, and errorReason, while beacons intercepted by a firewall or similar component do not include this JSON response.
Depending on the configuration of these components, you can often ensure that requests reach the beacon endpoint by selecting a different beacon endpoint configuration. Otherwise, ensure that your infrastructure allows RUM beacons to pass; see Infrastructure pass-through requirements for the New RUM Experience.