Finalize the initial setup for your agentless frontend
- Latest Dynatrace
- How-to guide
After setting up a new agentless frontend, the charts in  Experience Vitals should begin displaying data within ten minutes if your frontend is receiving traffic. If they don't, your setup may require further configuration steps. This guide walks you through a series of checks to help you identify the configuration needed.
Verify that the monitoring code downloads successfully
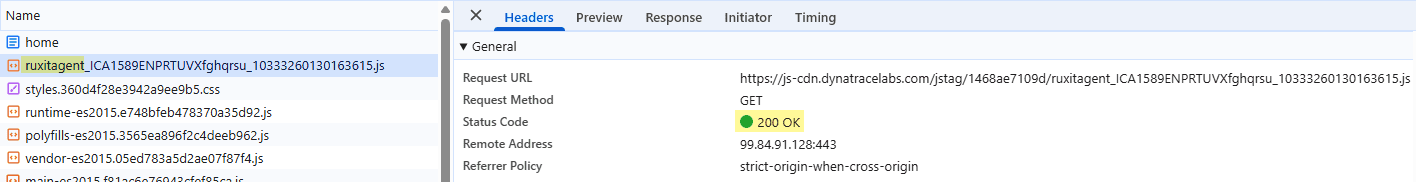
Unless you selected the snippet format inline code, the monitoring code is downloaded as a separate file. In environments that do not have a custom monitoring code filename prefix configured, the filename starts with the prefix ruxitagent_.
If the browser developer tools show a 200 OK response for this request, the download was successful and you can continue to Verify that RUM beacons are being sent to Dynatrace. Otherwise, further configuration is required.
CSP rule violations
If you see CSP rule violations in the browser console associated with loading the monitoring code, adjust the CSP rules defined in your application. For details, see Allow the loading of external monitoring code.
Requests are blocked by infrastructure components
Monitoring code requests may be blocked by infrastructure components such as firewalls and proxies. Ensure that your infrastructure allows these requests to pass; see Infrastructure pass-through requirements for the New RUM Experience.
Verify that RUM beacons are being sent to Dynatrace
The RUM JavaScript sends beacons containing captured data to the beacon endpoint. By default, the beacon endpoint for an agentless frontend is a Cluster ActiveGate that is part of the Dynatrace SaaS infrastructure. If the New RUM Experience is active, beacons in a new format are sent alongside RUM Classic beacons to the same endpoint.
To identify RUM beacons in your browser's developer tools, look for requests with the URL path /bf or /bf/<id>. Beacons in the new format include the query string parameter pv=4.
No beacons being sent
If the browser developer tools don't show any beacons, check the following aspects of your setup:
- If you enabled data-collection and opt-in mode during setup, your code needs to call
dtrum.enable() from the JavaScript API after the user accepts your data privacy policy. Only then will the RUM JavaScript begin sending data. - If you selected the snippet format inline code, your browser's console may display a CSP rule violation indicating that an inline script was blocked. In this case, adjust your CSP rules as described in Allow the execution of inline code.
Beacons blocked due to CSP rule violations
If you see CSP rule violations in the console indicating that a the connection to the beacon endpoint was blocked, adjust the CSP rules in your application. For details, see Allow sending RUM beacons.
Beacon origin is not in the allowlist
If the browser console shows CORS errors and beacon requests return an 403 Forbidden response, your environment has a beacon origin allowlist configured that does not allow beacons from the page you are instrumenting. Add a rule that allows them as described in Add rules to the beacon origin allowlist.
RUM is turned off for "Do Not Track"-enabled browsers
If the beacon requests in the new format return a 202 Accepted response code and a JSON response body with a field "errorReason":"Do Not Track", this means that the option Turn Real User Monitoring off for "Do Not Track"-enabled browsers is enabled in the data privacy settings, and your browser is configured to include the DNT header. In this case, the beacons aren't forwarded to Dynatrace by the beacon endpoint.
While verifying your setup, configure your browser to not include the DNT header.
Requests are blocked by infrastructure components
Beacon requests may be blocked by infrastructure components such as firewalls and proxies. You can determine where a beacon request was handled by looking at the response body:
- Beacon requests that failed at the beacon endpoint return a JSON response containing the fields
status,handler,errorCode, anderrorReason. - Beacons intercepted by a firewall or similar component do not include this JSON response.
The second scenario can be prevented by ensuring that your infrastructure complies with the infrastructure pass-through requirements. An exception is the error code 429 Too Many Requests, which may also be returned by SaaS infrastructure; in this case, reach out to Dynatrace support.
No beacons in the new format are sent
If beacons are being sent, but you cannot find any in the new format, the New RUM Experience may not have been activated. See Enable the New RUM Experience for your RUM Classic web applications to learn how to activate it.