Monitor third-party services
- How-to guide
- 2-min read
Dynatrace captures and monitors all outgoing requests from your monitored server-side services. This includes web requests that your server-side components send out across the internet.
- Most of them probably are not important to you, so Dynatrace collects them into a special service called Requests to public networks.
- Some of them, however, probably are important to you—for example, if your application relies on the performance and availability of third-party service providers. For this reason, Dynatrace provides a way to monitor third-party services with important HTTP requests as standalone services
Note that currently, the feature doesn't support gRPC requests.
Monitor a third-party service as a separate service
To configure Dynatrace to monitor a third-party service provider as a separate service
-
Go to Services (previous Dynatrace) or
Services Classic.
-
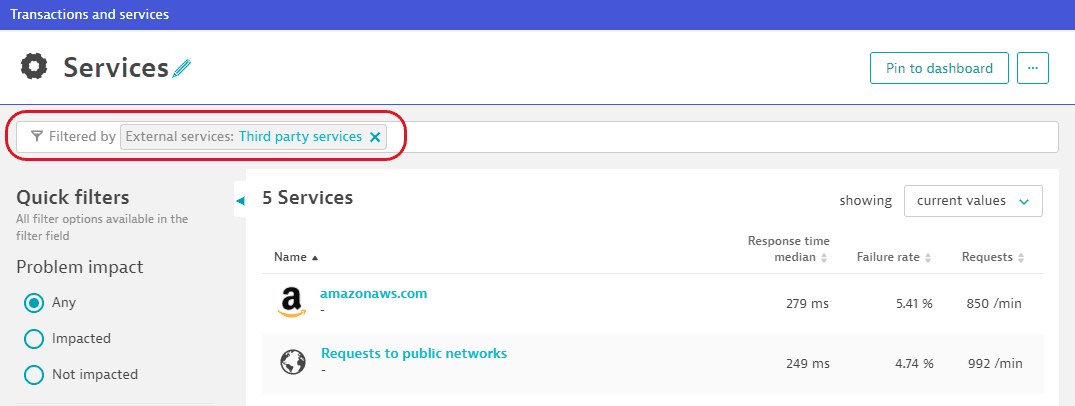
To find the Requests to public networks service, place the cursor in the Filter by field, and select External services > Third party services.

-
On the Requests to public networks page, select View requests to list details about aggregated requests.
-
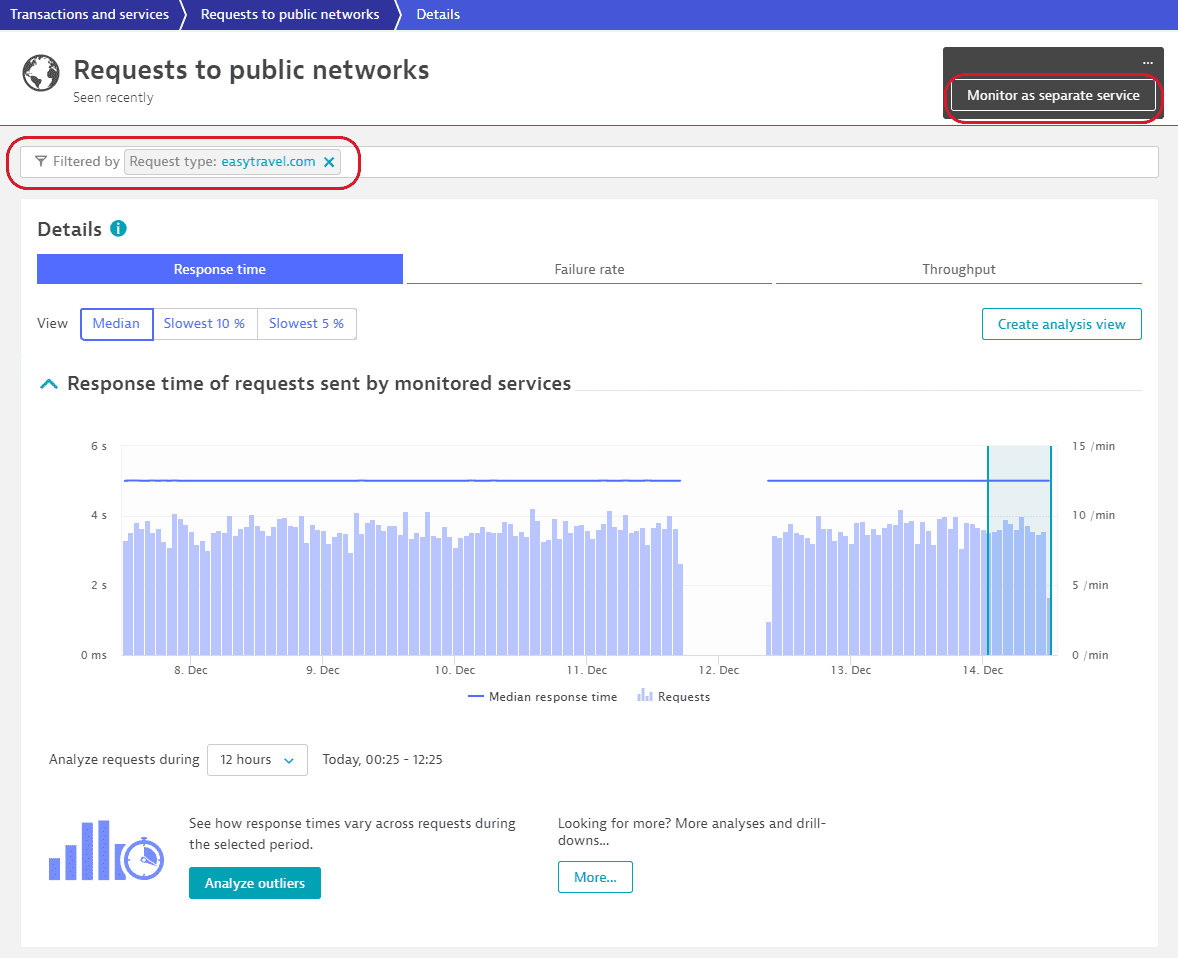
Scroll down to the top domains table of domains and select the domain that you want to monitor as a separate service.
The page is now filtered by this domain name. -
In the upper-right corner of the page, select More (…) > Monitor as separate service.

The confirmation message is displayed at the bottom of the page.
The requests to that domain are monitored as a standalone service. This service:
- Appears on the Services page as a standalone service.
- Appears in Smartscape, Service flow, and elsewhere as a standalone service. This enables you to track the response time better.
- Can be pinned to your dashboards as a dedicated tile.
- Generates alerts when the services experiences performance problems.
Only new data is mapped to the standalone service. Any existing data remains unaffected in the Requests to public networks service.
Revert to third-party service status
If you no longer want to have a recategorized third-party service set up as a standalone service, you can return it to third-party status.
-
Go to Services (previous Dynatrace) or
Services Classic.
-
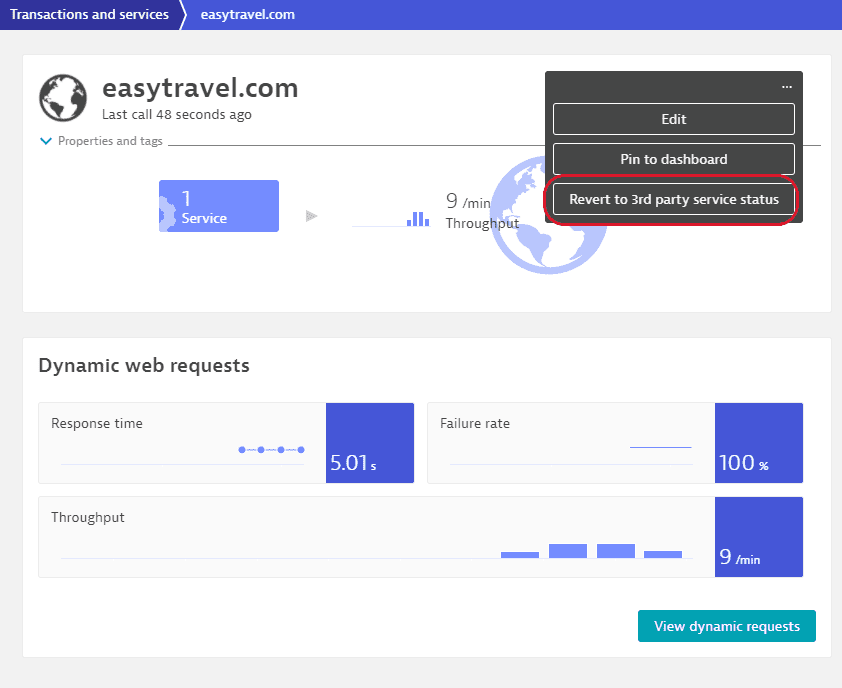
Find and open the required service.
-
Select More (…) > Revert to 3rd party service status.

Service detection rules API
Alternatively, you can set a custom rule for service detection that will map certain requests to a standalone service. For more information, see Service detection rules API. You'll need the opaque web requests type of rules.