IBM MQ extension
- Latest Dynatrace
- Extension
- Published Oct 27, 2025
Monitor performance of your IBM MQ queue manager objects.
Get started
Overview
Monitor the performance of your IBM MQ queue manager objects and collect performance metrics from queue managers running locally on your OneAgent host or remotely from your  ActiveGate instances using the
 ![]() IBM MQ extension.
IBM MQ extension.
Use cases
- Monitor IBM MQ infrastructure, including Queue Managers, Queues, Channels, Topics, and listeners.
- Get alerted if a Queue Manager has recently started, is unavailable, has retrying channels, and more.
- Monitor your IBM MQ by deploying locally on a OneAgent monitored host, or remotely using an ActiveGate.
Requirements
OneAgent deployment
- OneAgent for Windows or Linux only.
- OneAgent must run and monitor queue manager processes.
- Dynatrace version 1.313+
- IBM MQ 9.1+. IBM dropped support for 9.0.x in 2021.
- The IBM MQ Command server must be running on the queue managers
- MQ Libraries must be in PATH on Windows or
LD_LIBRARY_PATHon Linux. The user running the extension must be able to find these libraries.
Additional requirements for Linux
-
User running the OneAgent
dtuserby default must also have read access to the queue manager directories/var/mqm/qmgrs/<queue_manager>and read/write to log directories/var/mqm/logso that it can bind properly. -
Ensure MQ libraries are accessible by
dtuseror whichever user your OneAgent service is running under. Default location for these libraries is/opt/mqm/lib64 -
By default, IBM MQ installs an ldconfig file called
/etc/ld.so.conf.d/mqm.confthat adds/usr/lib64to theLD_LIBRARY_PATH. Ensure the IBM MQ library's symbolic links to /opt/mqm/lib64 are found on that path. If there is no reference in /usr/lib64 to /opt/mqm/lib64 libraries, you may have to create your own .conf file and place it in /etc/ld.so.conf.d/. -
Using ldconfig allows the MQ libraries to be loaded by default.
To do this, you can do the following:
- Create a .conf file in /etc/ld.so.conf.d/ with any name. Example:
ibmmq_ext.conf. - Inside that file, enter the location for the IBM MQ libraries:
/opt/mqm/lib64. - Save the file.
- Reload ldconfig by running the command:
ldconfig.
- Create a .conf file in /etc/ld.so.conf.d/ with any name. Example:
ActiveGate deployment
- ActiveGates on Windows or Linux
- Each connection to a queue manager roughly consumes 300 MB of RAM using a JVM. Take this into consideration when sizing your ActiveGate.
- Dynatrace version 1.313+
- IBM MQ 9.1+. IBM dropped support for 9.0.x in 2021.
- The IBM MQ Command server must be running on the queue managers.
- IBM MQ running on AIX, z/OS, Linux, Windows, zLinux, and MQ Appliance are supported. While it may work on other OS, they may not be officially supported.
- Server-connection channel to communicate with each queue manager. This is required for any Client connection to IBM MQ.
- Firewall from ActiveGates to queue managers must be open. The queue manager could run on any port, so ensure those ports are open from your ActiveGates. Consult with your MQ administrator to know those ports.
Activation and setup
- Under
Extensionson the left menu, selectIBM MQ. - Add a monitoring configuration. OneAgent deployment, also called "Local", can run on a specific host, host groups, hosts in a management zone, or tagged hosts. ActiveGate deployment, also called "Remote", runs on ActiveGate groups. Groups can have one or multiple ActiveGates for more reliability.
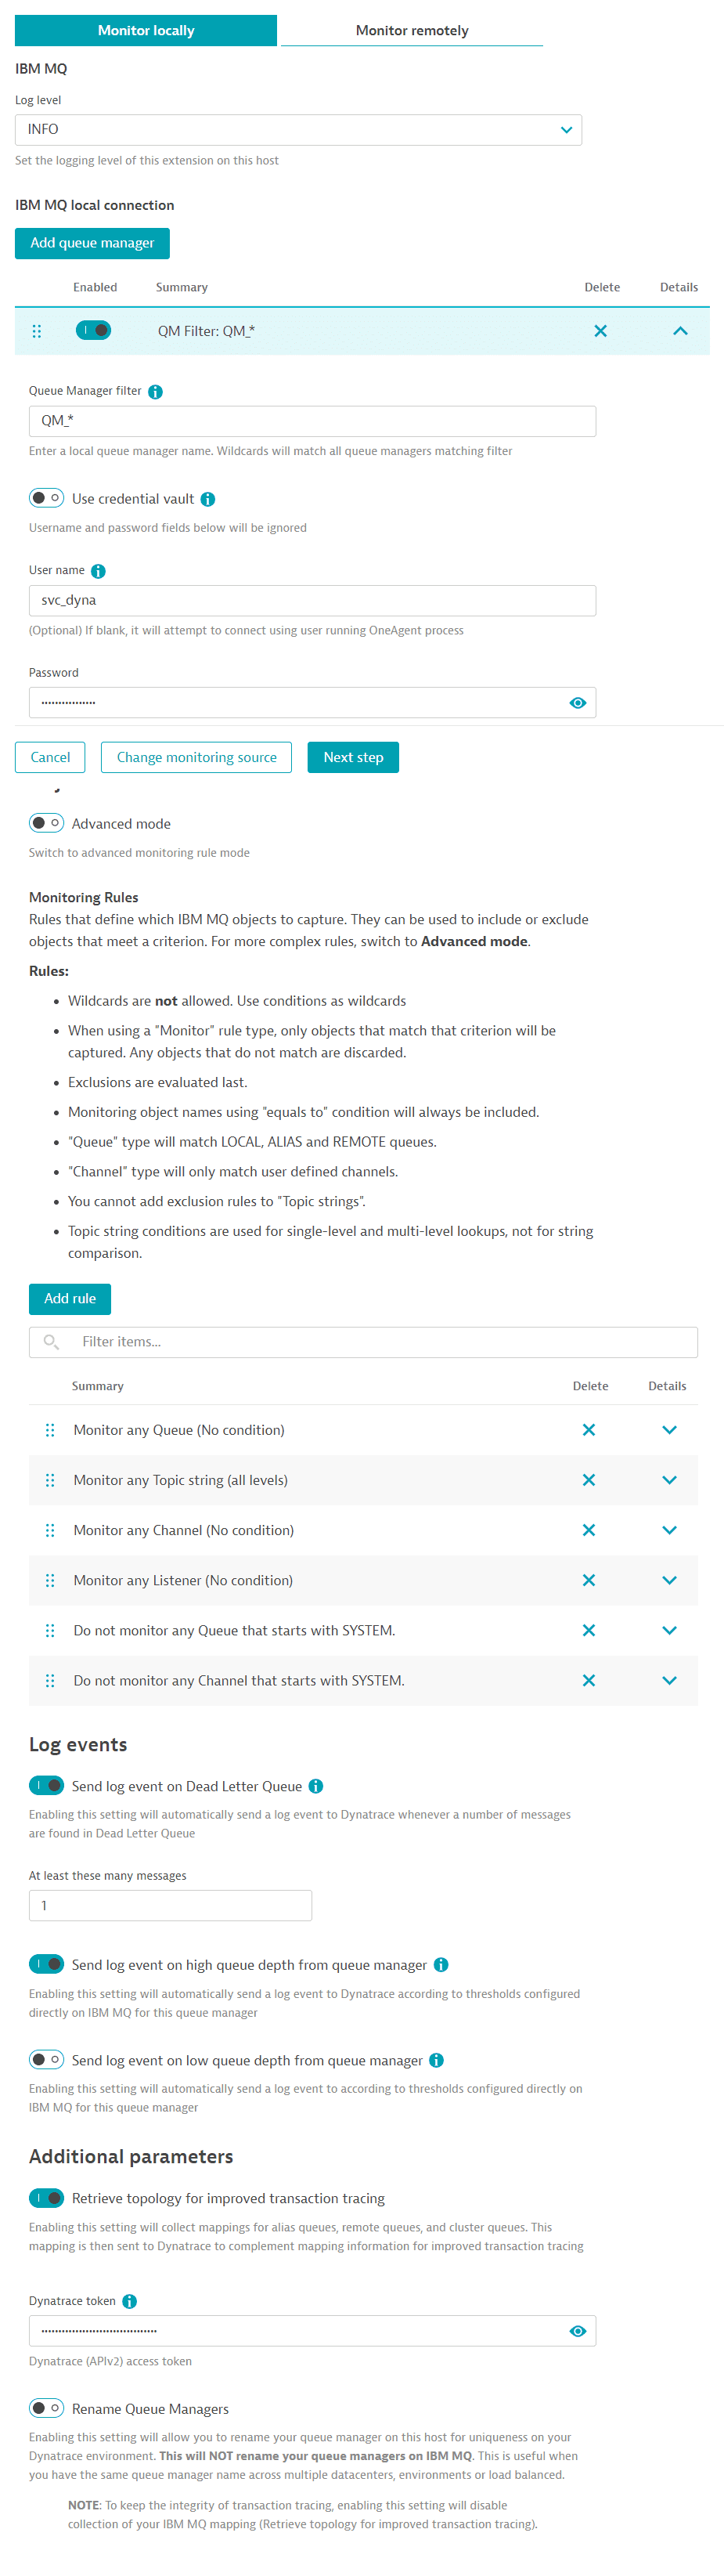
For Local (OneAgent) deployment
-
Select which hosts will run this extension.
- Log level: Enable DEBUG only when troubleshooting or support makes that recommendation.
- Add a Queue Manager: This configuration will be used by any queue managers matching its filter. You may create one separate configuration per queue manager on the host or one configuration for all queue managers on that host.
- Queue manager filter: A name matching this filter will be matched against running processes on this host. If a name matches this filter, all settings on this configuration endpoint will apply to it.
- Use credential vault: This will allow you to select a username/password credential stored on Dynatrace Credential Vault. This feature ignores any username/password entered manually and only uses the credentials stored in the vault.
- User: It's optional, but recommended to add a user. Otherwise, if left blank, IBM MQ tries to authenticate the user running process,
dtuserby default. - Password: Password for the user above.
- Objects to monitor: Two methods of adding objects.
- Using the new wizard mode, select buttons to enter rules. Remove that rule if you don't want to monitor an object.
- Advanced mode: Add filters in a comma-separated fashion under each tab. Hover your mouse over the icon next to each object type for rules and examples.
Rules are evaluated in sequential order. You can include or exclude objects from the result of the previous rule. For example,
*, -SYSTEM.*, SYSTEM.CLUSTER*consists of all queues, then removes those that start withSYSTEMand includes those that begin withSYSTEM.CLUSTER. Pay close attention to the order in which you enter your rules, whether in Wizard or Advanced mode.- Get auto-defined channels: Enabling this setting collects auto-defined channels with the abovementioned filters.
- Send log event on Dead letter queue: Enable this if you want any DLQ on any queue manager matching this configuration to trigger a log event indicating that the number of messages in DLQ exceeded the threshold. You may create an alert based on that log event.
- Send log event on high queue depth from queue manager: Enable this if you want any matching queue on any queue manager in this configuration to trigger a log event when its configured depth threshold is exceeded. This threshold is configured on IBM MQ.
- Send log event on low queue depth from queue manager: Enable this if you want any matching queue on any queue manager in this configuration to trigger a log event when its configured depth is lower than the threshold. This threshold is configured on IBM MQ.
- Retrieve topology for improved transaction tracing: Enable this setting to collect the mappings for alias, remote, and cluster queues.
This mapping is then sent to Dynatrace to complement the mapping information for improved transaction tracing.
You may only need to collect this once unless your mappings on IBM MQ change frequently.
When enabled, enter a Dynatrace token to communicate with the API with the permissions
Read settingsandWrite settings. - Rename Queue managers: Enabling this setting allows you to add an alias to queue managers matching your queue manager filter (above). The real queue manager's name is still included. This only differentiates queue managers with similar or the same names on Dynatrace. This won't rename any queue manager on IBM MQ.
- Inquire metrics in bulk: Enabling this setting reduces the number of requests to IBM MQ and collects metrics for queues and channels in fewer requests, thus reducing time and potential CPU overhead. However, this setting will require permissions to be granted to all queues, channels, and even SYSTEM objects. This setting is not suitable for large environments with a large number of queues or channels.
-
Select which feature sets (metric groups) you want this configuration to collect. Selecting too few won't give you the proper visibility, and you may miss out on essential performance data and key indicators that can be correlated between different objects.
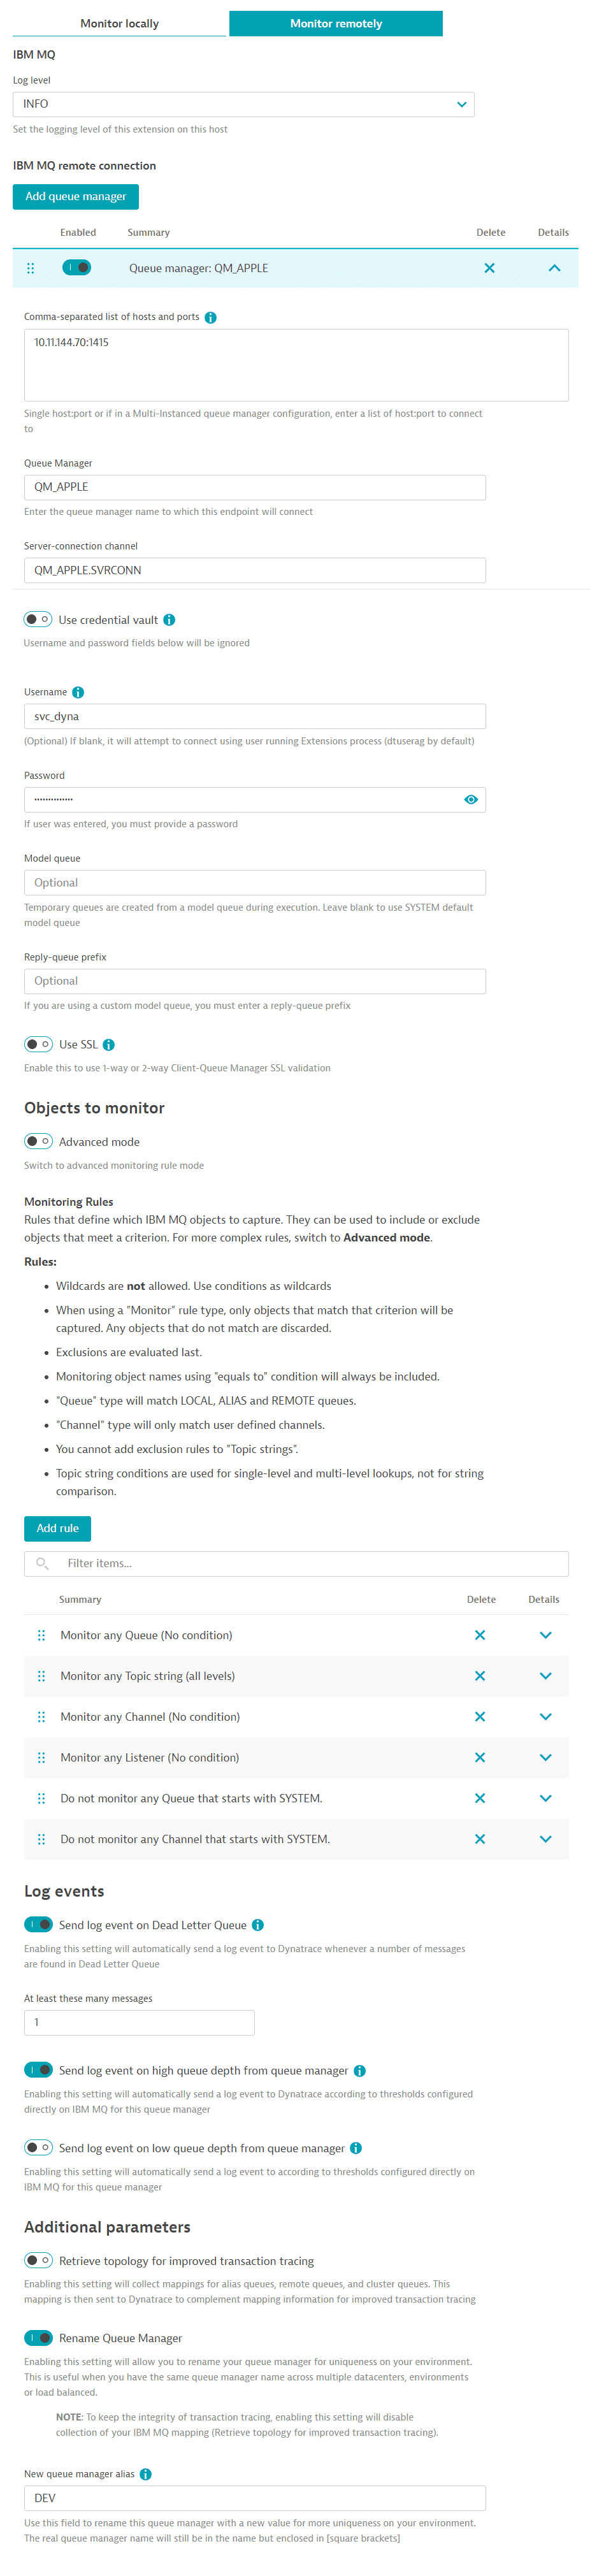
Remote ActiveGate deployment
-
Select which ActiveGate group runs this extension.
- Log level: Enable the DEBUG option only when troubleshooting or when support makes that recommendation.
- Task bucket size: All endpoints defined in a monitoring configuration create a task. This setting creates separate tasks for group endpoints defined in a monitoring configuration. This will allow you to optimize resource usage on your ActiveGate and potentially distribute execution across other ActiveGates in your group.
- Add a Queue Manager: Select for each queue manager you want to connect. Multiple queue managers per ActiveGate group are recommended.
- Comma-separated hosts: Most queue managers run on a single host, but there are times when multi-instance queue managers run across multiple hosts.
- Enter that single host and port here, or the comma-separated list of hosts and ports for that one queue manager.
- Required Queue manager name: Enter the name of the single queue manager you're connecting to
- Server-connection channel: Any client application, like this extension, that connects to IBM MQ must talk to the queue manager via a channel. Enter the name of that Server-connection channel here.
- Use credential vault: This will allow you to select a username/password credential stored on Dynatrace Credential Vault. This feature ignores any username/password entered manually and only uses the credential stored in the vault.
- Optional Username: Optional, but recommended to add a user. A user is always passed, but depending on the queue manager configuration on IBM MQ, it can be ignored, or this user in this field can be authenticated. It is best to enter a user always.
- Password: Password for the user above.
- Use SSL: Enable this to establish TLS communication from the extension (client) to the MQ server. One-way or two-way authentication is supported and handled by the IBM MQ server. The extension always presents the certificate, and it is up to IBM MQ to accept it.
- Optional Model queue: If not set, it will use the SYSTEM default model queue for command requests and responses.
- Reply prefix: If you entered a model queue, you need to enter a prefix for the reply queue.
- Objects to monitor: Two methods of adding objects.
- Using the new wizard mode, select to enter rules. Remove that rule if you don't want to monitor an object.
- Advanced mode: add filters in a comma-separated fashion under each tab.
- Hover your mouse over the icon next to each object type for rules and examples.
Rules are evaluated in sequential order. You can include or exclude objects from the previous rule result. For example,
*, -SYSTEM.*, SYSTEM.CLUSTER*would include all queues, then remove those that start with SYSTEM.CLUSTER. Pay close attention to the order in which you enter your rules, whether in Wizard or Advanced mode.- Get auto-defined channels: Enabling this setting will collect auto-defined channels with the same filters defined above.
- Send log event on Dead letter queue: Enable this if you would like any DLQ on any queue manager matching this configuration to trigger a log event indicating that the number of messages in DLQ exceeded the threshold. You may create an alert based on that log event
- Send log event on high queue depth from queue manager: Enable this if you want any matching queue on any queue manager in this configuration to trigger a log event when its configured depth threshold is exceeded. This threshold is configured on IBM MQ.
- Send log event on low queue depth from queue manager: Enable this if you want any matching queue on any queue manager in this configuration to trigger a log event when its configured depth is lower than the threshold. This threshold is configured on IBM MQ.
- Retrieve topology for improved transaction tracing: Enabling this setting will collect the mappings for alias, remote, and cluster queues.
This mapping is then sent to Dynatrace to complement the mapping information for improved transaction tracing.
You may only need to collect this once unless your mappings on IBM MQ change frequently.
When enabled, enter a Dynatrace token to communicate with the API with the permissions
Read settingsandWrite settings. - Rename Queue manager: Enabling this setting will allow you to add an alias to the queue manager defined above. The real queue manager's name will still be included. This only differentiates queue managers with similar or the same names on Dynatrace. This won't rename any queue manager on IBM MQ.
- Inquire metrics in bulk: Enabling this setting will reduce the number of requests to IBM MQ and collect metrics for queues and channels in fewer requests, thus reducing time and potential CPU overhead. However, this setting will require granting permissions to all queues and all channels, even SYSTEM objects too. This setting is not suitable for large environments with a large number of queues or channels.
- Disable auto-alerting: Automatic problem creation for failures will be disabled. Errors will still be logged as events, but won't trigger problems. If you wish to create problems, you need to create rules to trigger them from log events.
- Get QSG Data: This feature is only available for queue managers running on z/OS. When enabled, it collects data for queues shared across queue managers. This setting could make the extension take longer to execute, as these queues could be on another queue manager that is part of the same queue sharing group.
- Use Outbound SNI: This setting will allow you to configure the routing type for Queue Managers running on OpenShift. This setting requires an OpenShift route to your queue manager to work.
-
Select which feature sets (metric groups) you want this configuration to collect. Selecting too few won't give you the proper visibility, and you may miss out on essential performance data and key indicators that can be correlated between different objects.
Authentication
IBM MQ has several ways to authenticate client and local connections. The administrator of your MQ environment determines this according to their own security policies.
User authentication depends on the configuration of Channel Authentication (CHLAUTH).
If disabled or ADOPTCTX is disabled, IBM MQ will attempt to authenticate the user running the extension process, not the user passed in the endpoint configuration.
When ADOPTCTX and CHLAUTH are enabled, the user and password combination entered in the endpoint is passed in an MQCSP block that IBM MQ will attempt to authenticate.
Consider this when authenticating users or if you receive unauthorized errors.
User permissions to MQ objects (Distributed)
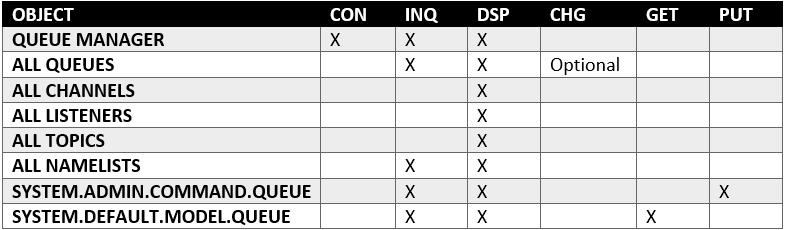
- CHG permission is only required if collecting Enqueue/Dequeue metrics. Enqueue/Dequeue metrics can only be obtained after issuing
RESET_Q_STATISTICScommand, therefore needing CHG permissions. If you can't provide this permission, make sure you deselect those metrics on the Feature Sets page of your monitoring configuration.
User permissions to MQ objects (z/OS)
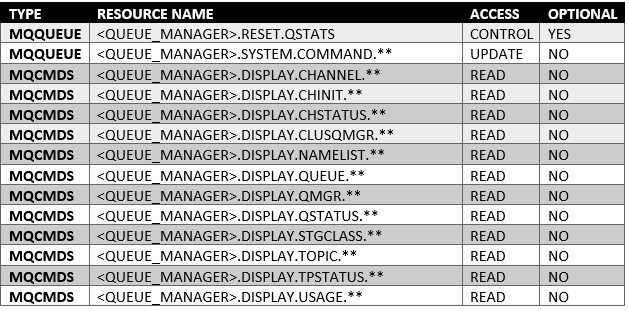
CONTROL permission is only required if collecting Enqueue/Dequeue metrics.
Collecting Enqueue/Dequeue metrics
To retrieve the following metrics, statistics on queues are reset. To reset them, CHG permission must be granted to the queues:
- Enqueue count: Number of messages enqueued. This count includes messages that have been put in the queue, but have not yet been committed.
- Dequeue count: Number of messages dequeued. This count includes messages successfully retrieved (with a non-browse MQGET) from the queue, even though the MQGET has not yet been committed.
- Enqueue rate: Number of messages enqueued per second.
- Dequeue rate: Number of messages dequeued per second.
Collecting Queue Status metrics
Queue monitoring must be enabled on queues to retrieve the following metrics. Any monitoring resolution starts collecting these statistics.
- Oldest message: Age in seconds of the oldest message on the queue.
- Last GET: Time at which the last message was successfully read from the queue.
- Last PUT: Time at which the last message was successfully put in the queue.
- Short time indicator: Amount of time a message spends in the queue over a short period.
- Long time indicator: Amount of time a message spends in the queue over a long period.
Feature sets
When activating your extension using monitoring configuration, you can limit monitoring to one of the feature sets. To work properly the extension has to collect at least one metric after the activation.
In highly segmented networks, feature sets can reflect the segments of your environment. Then, when you create a monitoring configuration, you can select a feature set and a corresponding ActiveGate group that can connect to this particular segment.
All metrics that aren't categorized into any feature set are considered to be the default and are always reported.
A metric inherits the feature set of a subgroup, which in turn inherits the feature set of a group. Also, the feature set defined on the metric level overrides the feature set defined on the subgroup level, which in turn overrides the feature set defined on the group level.
default
| Metric name | Metric key | Description |
|---|---|---|
| Availability | ibmmq.queue_manager.availability | Percentage of time queue manager was reachable and available to this extension. While a queue manager sometimes may be up and running, availability is within the context of this extension. |
| Uptime | ibmmq.queue_manager.uptime | Time in seconds since last time queue manager started |
Channels - Retry counts
| Metric name | Metric key | Description |
|---|---|---|
| Long retries left | ibmmq.channel.long_retries_left | Number of long retry attempts remaining |
| Short retries left | ibmmq.channel.short_retries_left | Number of short retry attempts remaining |
Channels - Traffic
| Metric name | Metric key | Description |
|---|---|---|
| Messages | ibmmq.channel.messages | Number of messages sent or received, or number of MQI calls handled. |
| Batches | ibmmq.channel.batches | Number of completed batches |
| In-doubt messages | ibmmq.channel.current_messages | Number of messages in-doubt |
Topics - Inhibits
| Metric name | Metric key | Description |
|---|---|---|
| Inhibit publish | ibmmq.topic.inhibit_pub | Whether publishes are not allowed |
| Inhibit subscription | ibmmq.topic.inhibit_sub | Whether subscriptions are not allowed |
Queue Manager - Overview
| Metric name | Metric key | Description |
|---|---|---|
| Connections | ibmmq.queue_manager.connections | Number of active connections to queue manager |
| Queues count | ibmmq.queue_manager.monitored_queues | Number of monitored queues |
| DLQ depth | ibmmq.queue_manager.dlq_depth | Number of messages in dead letter queue |
| Active channels | ibmmq.queue_manager.active_channels | Number of channels in an active current status |
Usage - z/OS Only
| Metric name | Metric key | Description |
|---|---|---|
| Total pages | ibmmq.queue_manager.usage.pageset.total_pages | The total number of 4 KB pages in the page set. Available only on z/OS IBM MQ |
| Expand count | ibmmq.queue_manager.usage.pageset.expand_cnt | The number of times the page set has been dynamically expanded since restart. Available only on z/OS IBM MQ |
| Unused pages | ibmmq.queue_manager.usage.pageset.unused_pages | The number of pages that are not used (that is, available page sets). Available only on z/OS IBM MQ |
| Persistent pages | ibmmq.queue_manager.usage.pageset.persistent_data_pages | The number of pages holding persistent data. Available only on z/OS IBM MQ |
| Non-persistent pages | ibmmq.queue_manager.usage.pageset.nonpersistent_data_pages | The number of pages holding nonpersistent data. Available only on z/OS IBM MQ |
| Free buffers | ibmmq.queue_manager.usage.buffer_pool.free_buffers | Number of free buffers in buffer pool. Available only on z/OS IBM MQ |
| Percent of free buffers | ibmmq.queue_manager.usage.buffer_pool.percent_free_buffers | Number of free buffers as a percentage of all buffers in the buffer pool. Available only on z/OS IBM MQ |
| Total buffers | ibmmq.queue_manager.usage.buffer_pool.total_buffers | The number of buffers defined for specified buffer pool. Available only on z/OS IBM MQ |
Channels - Instances
| Metric name | Metric key | Description |
|---|---|---|
| Channel instances | ibmmq.channel.instances | Number of instances of this channel. This metric is only available to server-connection channels. |
| Total channel instances used | ibmmq.channel.total_instances_pct | Percentage of instances of this channel over its max intances. This metric is only available to server-connection channels. |
| Current shared conversations | ibmmq.channel.current_sharing_convs | Number of conversations currently active on this channel instance. This parameter is returned only for TCP/IP server-connection channels. |
Channels - Data transfer
| Metric name | Metric key | Description |
|---|---|---|
| Bytes sent | ibmmq.channel.bytes_sent | Number of bytes sent |
| Bytes received | ibmmq.channel.bytes_rcvd | Number of bytes received |
| Buffers sent | ibmmq.channel.buffers_sent | Number of buffers sent. |
| Buffers received | ibmmq.channel.buffers_rcvd | Number of buffers received. |
Channels - Timing
| Metric name | Metric key | Description |
|---|---|---|
| Last message sent | ibmmq.channel.last_msg | Time when last message was sent, or MQI call was handled |
| Network time short | ibmmq.channel.nettime_short | Amount of time, in microseconds, to send an end of batch request to the remote end of the channel and receive a response over a short period. |
| Network time long | ibmmq.channel.nettime_long | Amount of time, in microseconds, to send an end of batch request to the remote end of the channel and receive a response over a longer period. |
| XMIT queue time short | ibmmq.channel.xmitqtime_short | Time, in microseconds, that messages remained on the transmission queue before being retrieved over a short period. |
| XMIT queue time long | ibmmq.channel.xmitqtime_long | Time, in microseconds, that messages remained on the transmission queue before being retrieved over a longer period. |
Listeners - Availability
| Metric name | Metric key | Description |
|---|---|---|
| Availability | ibmmq.listener.availability | Percentage this listener was running and available. |
Queues - Status
| Metric name | Metric key | Description |
|---|---|---|
| Oldest message | ibmmq.queue.oldest_message | Age in seconds of the oldest message on the queue. |
| Uncommitted messages | ibmmq.queue.uncommitted_messages | Number of handles opened by applications for output |
| Last GET | ibmmq.queue.last_get | Time at which the last message was successfully read from the queue. |
| Last PUT | ibmmq.queue.last_put | Time at which the last message was successfully put in queue. |
| Short time indicator | ibmmq.queue.time_indicator_short | Amount of time that a message spent on the queue over a short period. |
| Long time indicator | ibmmq.queue.time_indicator_long | Amount of time that a message spent on the queue over a long period. |
Queues - Depth
| Metric name | Metric key | Description |
|---|---|---|
| Depth | ibmmq.queue.depth | Number of messages in queue |
| Depth percentage | ibmmq.queue.depth_percent | Percentage of messages filling up queue |
Queues - Inhibits
| Metric name | Metric key | Description |
|---|---|---|
| Inhibit GET | ibmmq.queue.inhibit_get | Whether queue inhibits MQGET |
| Inhibit PUT | ibmmq.queue.inhibit_put | Whether queue inhibits MQPUT |
Channels - In-doubt
| Metric name | Metric key | Description |
|---|---|---|
| In-doubt | ibmmq.channel.in_doubt | Whether the channel is currently in doubt. 0 = No. 1 = Yes |
Queues - Open handles
| Metric name | Metric key | Description |
|---|---|---|
| Open input handles | ibmmq.queue.open_input_handles | Number of handles opened by applications for input |
| Open output handles | ibmmq.queue.open_output_handles | Number of handles opened by applications for output |
Topics - Pub/Sub counts
| Metric name | Metric key | Description |
|---|---|---|
| Publish count | ibmmq.topic.pub_cnt | The number of applications currently publishing to the topic. |
| Subcription count | ibmmq.topic.sub_cnt | The number of subscribers for this topic string, including durable subscribers who are not currently connected. |
Queues - Enqueue/Dequeue
| Metric name | Metric key | Description |
|---|---|---|
| Enqueue count | ibmmq.queue.enqueue_cnt | Number of messages enqueued. This count includes messages that have been put to the queue, but have not yet been committed. Enqueue rate also comes with this metric. |
| Dequeue count | ibmmq.queue.dequeue_cnt | Number of messages dequeued. This count includes messages that have been successfully retrieved (with a nonbrowse MQGET) from the queue, even though the MQGET has not yet been committed. Dequeue rate also comes with this metric. |
Channels - Status summary
| Metric name | Metric key | Description |
|---|---|---|
| Channel status | ibmmq.channel.status | Used to round up channel status counts for alerting and charting purposes |
| Last started time | ibmmq.channel.last_started | Time when this channel was last started |
Queue Manager - Log utilization
| Metric name | Metric key | Description |
|---|---|---|
| Log utilization | ibmmq.queue_manager.log_utilization | Percentage estimate of how well the queue manager workload is contained within the primary log space |
| Log in use | ibmmq.queue_manager.log_in_use | Percentage of the primary log space in use for restart recovery |
| Log archive size | ibmmq.queue_manager.log_archive_size | Amount of space occupied, in megabytes, by log extents no longer required for restart or media recovery, but waiting to be archived. |
| Log reuse size | ibmmq.queue_manager.log_reuse_size | Amount of space occupied, in megabytes, by log extents available to be reused. |
| z/OS Total log data sets | ibmmq.queue_manager.total_log_data_sets | The total number of active log data sets. |
| z/OS Full log data sets | ibmmq.queue_manager.full_log_data_sets | The total number of full active log data sets that have not yet been archived. |
FAQ and Troubleshooting
How many DDUs will it consume per year?
The following is an approximation. Metrics change depending on the type of object. Some metrics are unavailable to all channels, and others are not available to all queues.
Assuming you get all metrics for all objects:
((10) + (Local queues * 16) + (Alias + Remote queues) * 2 + (Channels * 18) + (Listeners) + (Topics * 4)) * Queue managers * 525.6 = DDUs per year
For example:
1 Queue manager400 Local queues20 Alias and remote queues50 Channels1 Listener50 Topics( 10 + (400 * 16) + (20 * 2) + (50 * 18) + (1 * 1) + (50 * 4) ) * 1 * 525.6 =(10 + 6400 + 40 + 900 + 1 + 200) * 525.6 = approximately 3.9M DDUs per year
I am not seeing all the queue metrics
Some metrics depend on the type of queues. Other metrics depend on your queue manager configuration and whether your user has enough permissions to collect them.
-
Are you missing Enqueue and Dequeue? Make sure your user has CHG permission to reset the queue statistics. Only then can you receive Enqueue and Dequeue metrics.
-
Are you missing the oldest message and the last get/put? Make sure Monitoring statistics is enabled on your queue manager for all queues.
-
Are you looking at Alias or Remote queues? Only locally defined queues have status metrics. Alias and Remote only have Inhibit GET/PUT metrics.
I keep getting unauthorized errors, but I know my user is correct
Check the AMQERR01.LOG on the queue manager itself.
This log file will tell you what it tried to authenticate and what permissions you missed.
If you're unable to connect to your queue manager, make sure that either the user running the extension process has permissions to the queue manager or ADOPTCTX and CHLAUTH are enabled so that they can authenticate the user and password combination passed in the MQCSP block.
I get a pymqe error saying libmqm_r.so not found
The IBM MQ libraries were not found in the Unix PATH.
Make sure you follow the ldconfig step above under local deployment.
Other common errors and their meanings
-
MQRC_HOST_NOT_AVAILABLE: Queue manager is not reachable from your ActiveGate. This usually means a firewall rule is missing. Because a queue manager can run on a custom port, you need to make sure thathost:portis reachable from the ActiveGate running the extension. -
MQRC_NO_MSG_AVAILABLE: Your queue manager's response was too long and blank. This can happen if your reply queue'sMAX LENGTHis too small to accommodate the response payload. You can try increasing that value. A timeout or the queue manager may also cause it not to respond quickly. -
MQRC_CONNECTION_BROKEN: The connection to the queue manager is severed due to a network interruption or the queue manager closed it. Make sure your network performance is optimal. Also, if you're using SSL, ensure you're not using an older TLS cipher that requires manual reset of TLS keys, such as TLS 1.2 AES-GCM ciphers. Switch to a TLS 1.3 Cipher that has automatic TLS keys reset.

 Message Queues