PurePath® method-level transaction analysis
The first step in your analysis should be to locate the requests that you want to analyze at a granular level. Filters can be used to narrow down many thousands of requests to just those few that are relevant to your analysis. You have a couple of ways to achieve this result
- Follow the root cause analysis drill-downs.
- Segment your requests using by filtering the related service flow or via outlier analysis.
Ultimately, you’ll likely discover a handful of requests that require deeper analysis. This is where distributed-trace analysis comes in.
Detect a single request via Service flow
You can narrow down your requests by segmenting them.
- Go to Services.
Select the service you want to analyze.
- On the service overview page, under Understand dependencies, select View service flow.
-
Select a called service > Apply filter
 to obtain a subset of requests based on its chain of calls (see example below).
 -
Select the caller service > Distributed traces
 to access its traces filtered by the chosen chain of calls.
 -
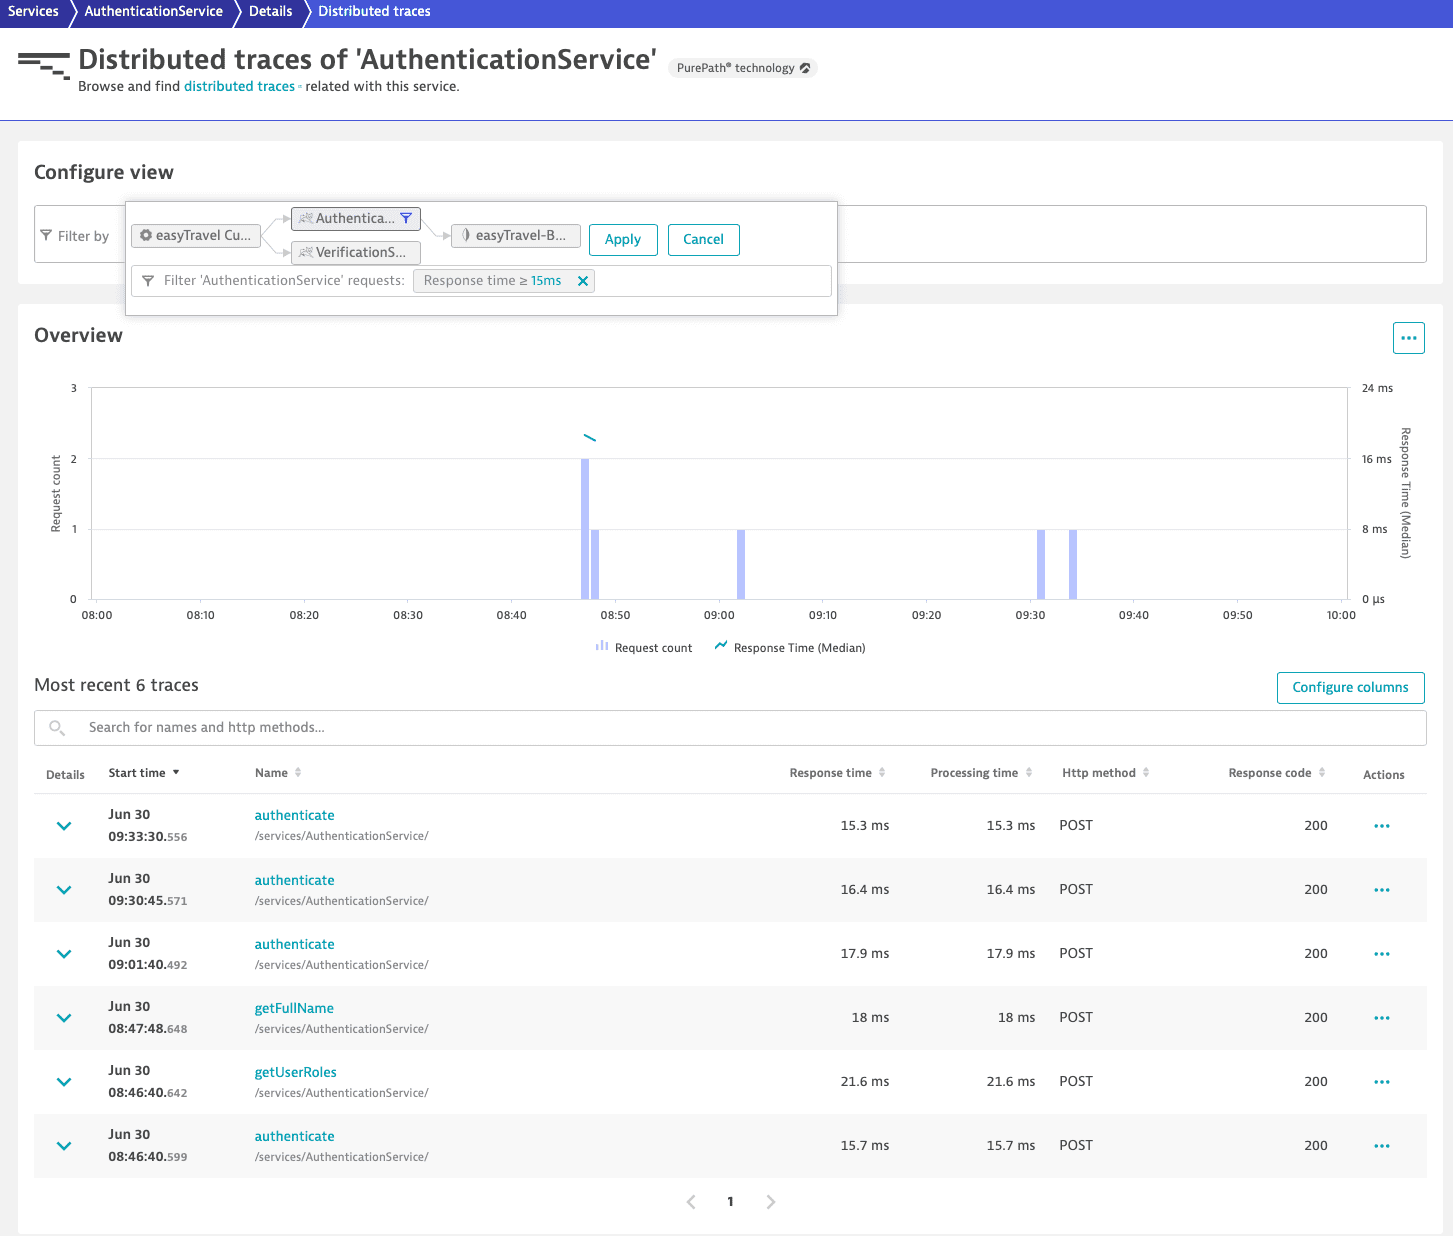
In the Configure view tile, select a node to browse the Filter requests list and apply filters.
-
Select a trace from the refined list of traces to proceed with its code-level analysis.
In this example, the service easyTravel Customer Frontend received 249,000 requests during the selected 2-hour timeframe.
Let's suppose that you're interested specifically in the requests from easyTravel Customer Frontend that call first AuthenticationService (11,600 overall calls) and then easyTravel-Business (14,400 overall calls).
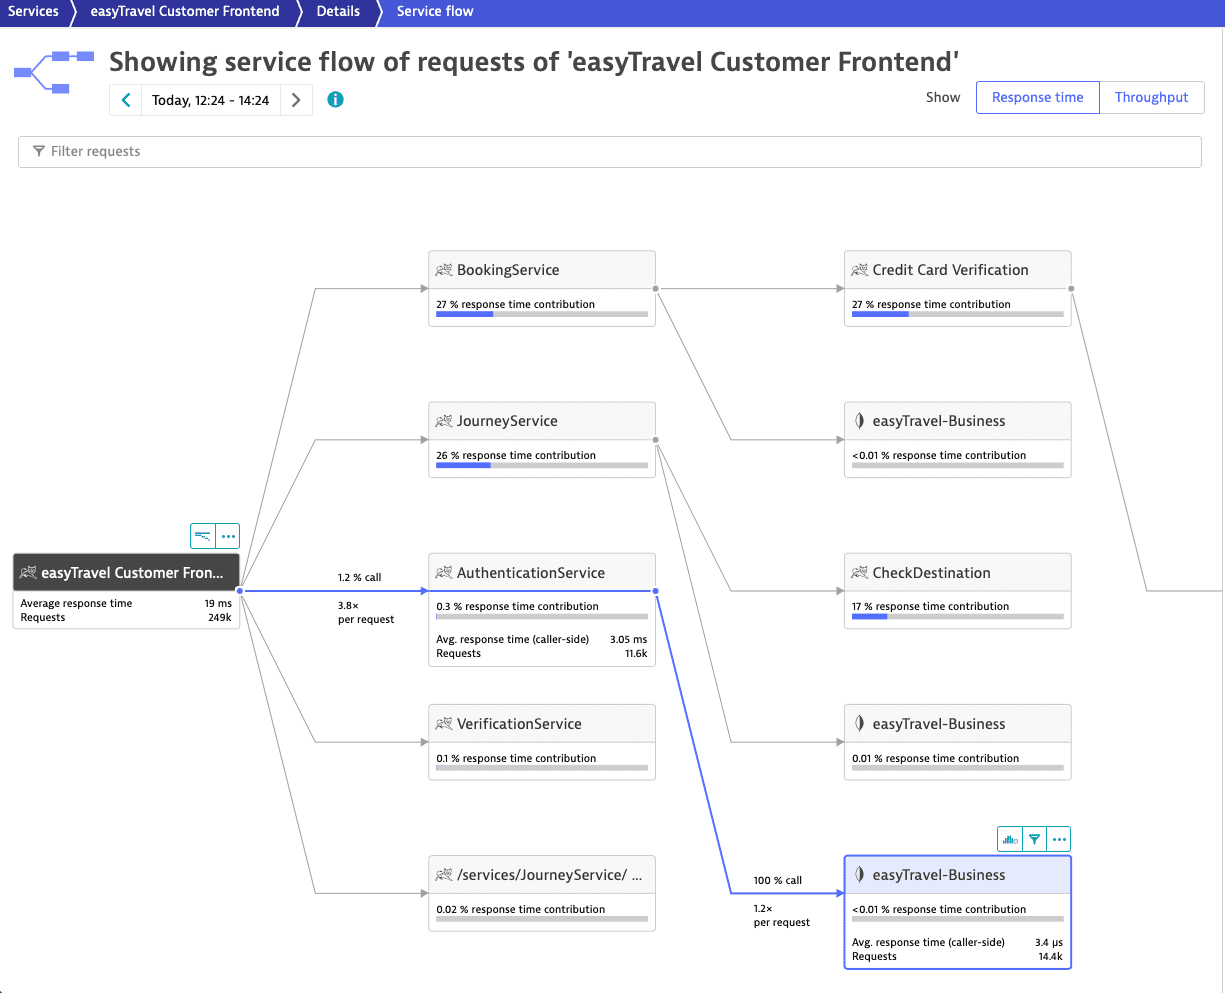
To focus on this subset of requests, select easyTravel-Business> Apply filter ![]() .
.

In the picture above, 94% of the easyTravel Customer Frontend requests calling AuthenticationService also call VerificationService. To add VerificationService as a second filter parameter, select VerificationService. Then, select easyTravel Customer Frontend > Distributed traces ![]() to access the list of distributed traces.
to access the list of distributed traces.
The Most recent traces list features the requests initiated by easyTravel Customer Frontend that match the filter criteria. You can filter the list or sort it by Start time, Name, Response time, Processing time, HTTP method, or Response code.
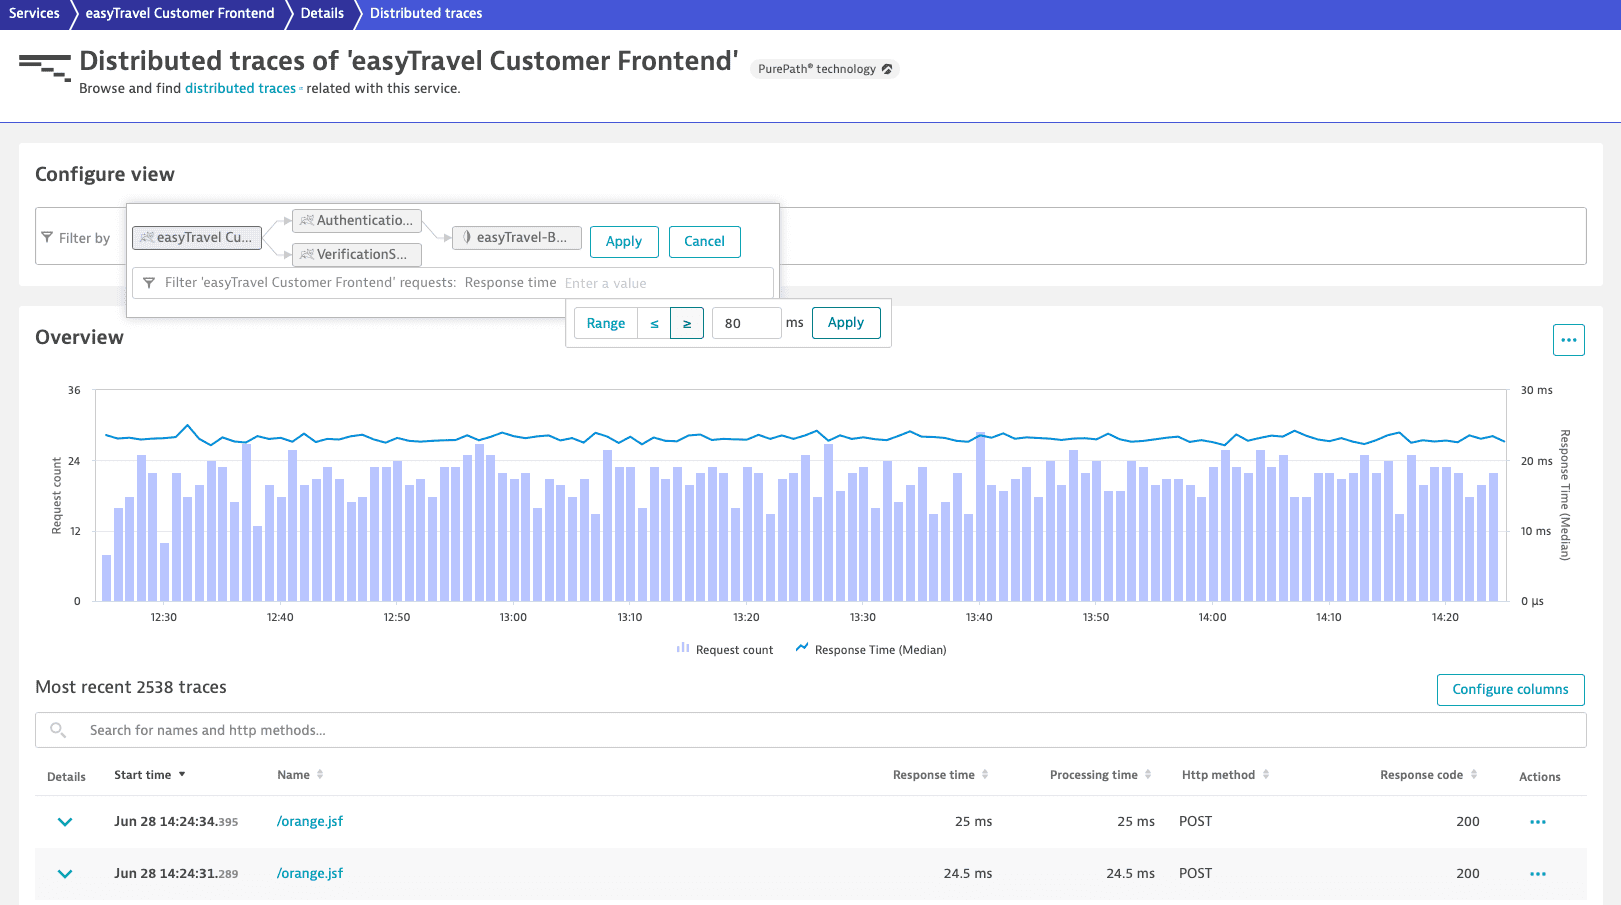
To visualize only easyTravel Customer Frontend requests with Response time slower than or equal to 80 ms
- Select the easyTravel Customer Frontend node.
- From the Filter requests list, select Response time.
- Select greater than or equal to ≥, type
80in the input field, and select Apply. - Select Apply.
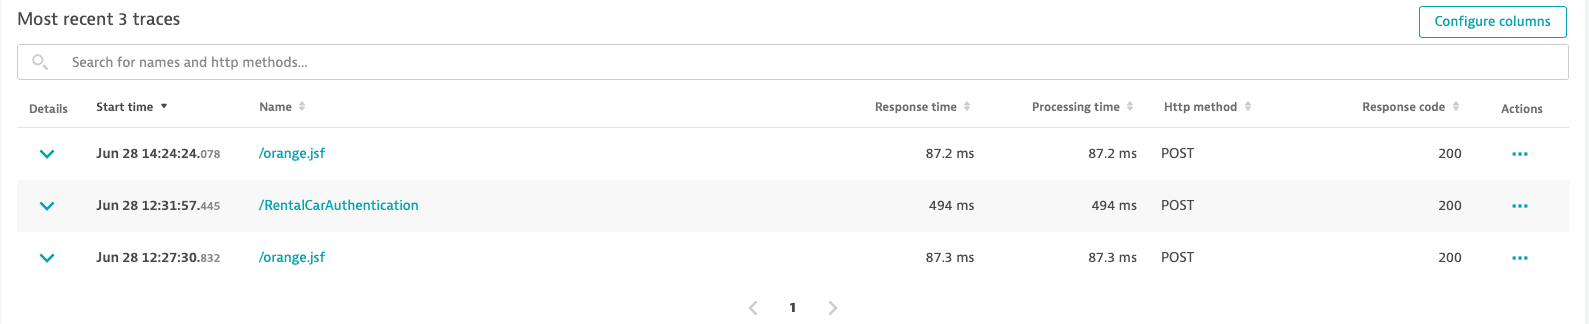
Only 3 requests out of the initial 249,000 justify in-depth distributed trace analysis. Select a request to analyze its trace.
Distributed-trace analysis of a single web request
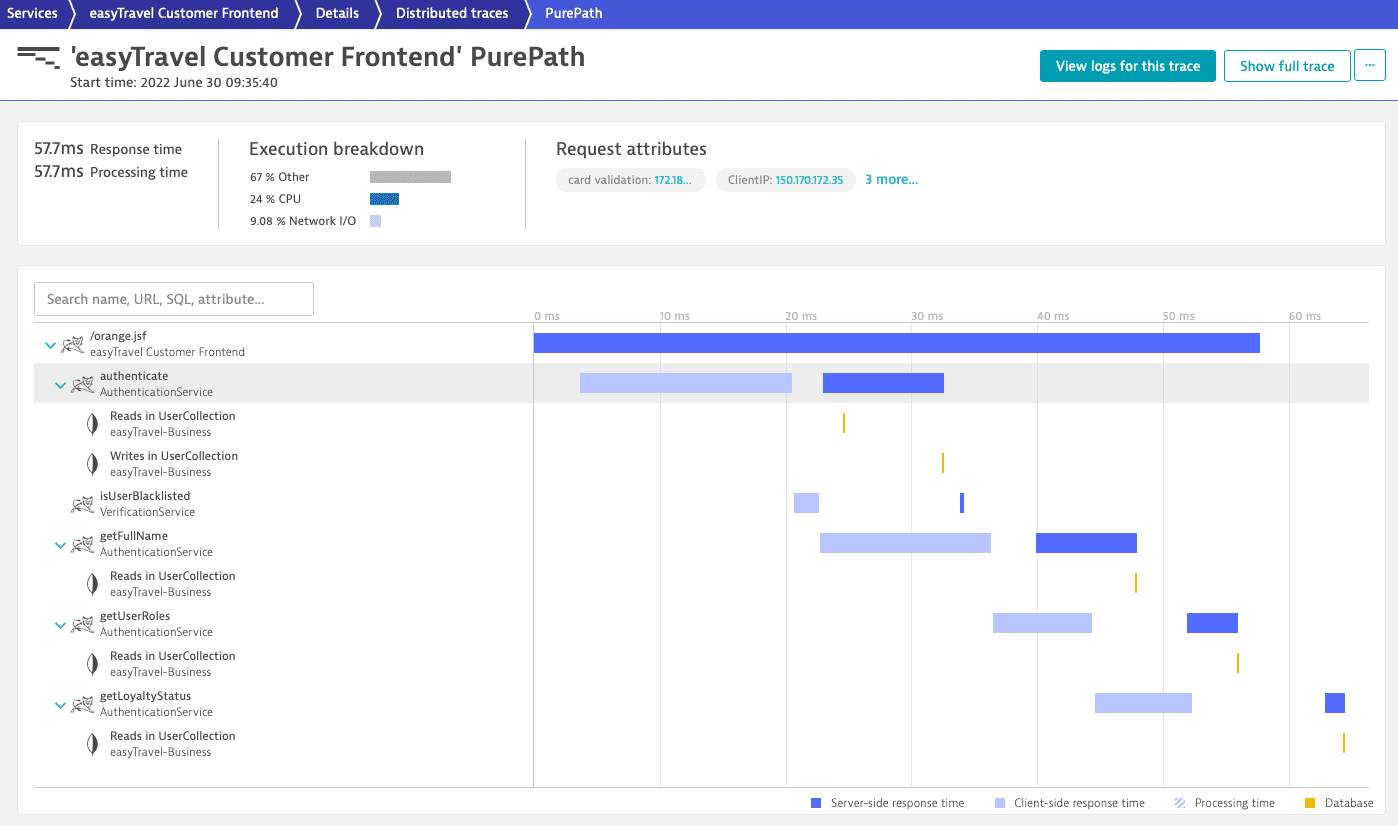
Distributed-traces analysis provides a waterfall visualization of all requests. Each service in the call chain is represented in the analysis.
The Execution breakdown section at the top of the page shows how the time spent by the transaction is distributed. The waterfall chart shows much more detail. You can see:
Which other services are called and in which order.
Other services called and the order in which they're called.
Subsequent calls to services called by the ones under analysis.
Like service flow, distributed-trace analysis provides end-to-end web-request visualizations—in this case, that of a single request.
The colors and positions of the horizontal bars in the chart indicate both the sequence and response time of each of the requests. You can easily see which calls were executed synchronously and which were executed in parallel.
By selecting one of the service or execution bars, you can analyze the details of each request in the distributed-trace analysis via multiple tabs. Depending on the type and the technology of the service under analysis, additional tabs, such as Threads and Integration, are available.
Analyze a called service
Each distributed trace tracks a request from start to finish. This means that the traces always start at the first fully monitored process group. However, you might want to change perspective and focus only on a service in the call chain.
- Go to Services.
Select the service you want to analyze.
- On the service overview page, under Understand dependencies, select View service flow.
-
Select the last called service > Apply filter
to obtain a subset of requests based on a specific chain of calls. -
Select the called service you are interested in > Distributed traces
to access its traces filtered by the chosen chain of calls. -
optional To apply filters, in the Configure view tile, select the node of the choosen called service.
-
Select a trace from the refined list of traces to proceed with its code-level analysis.
You can always go back and extend your analysis:
- To see where the request originated, you can select More (…) > Service backtrace.
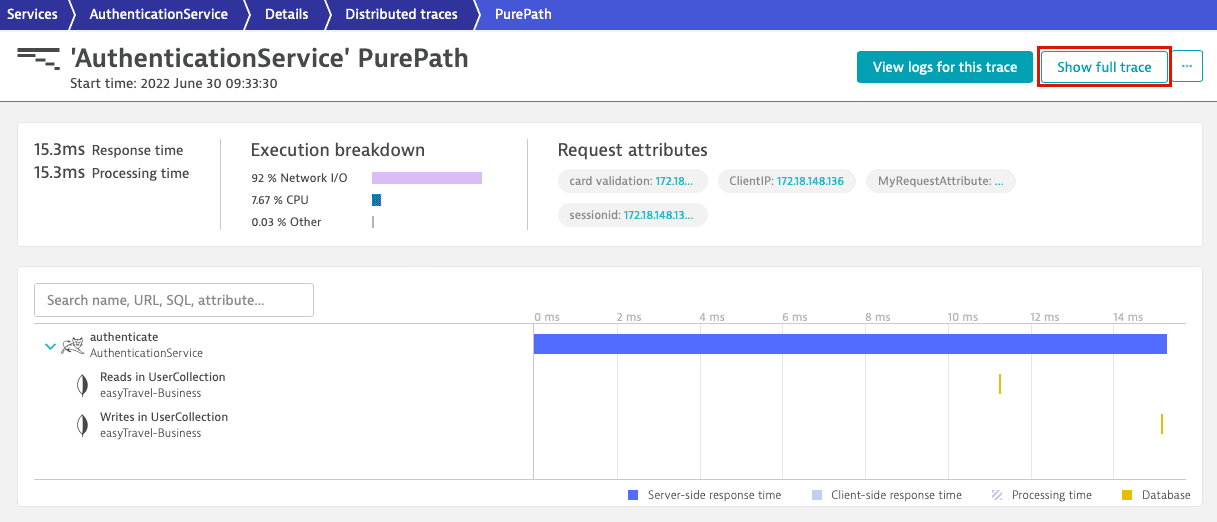
- To see the entire trace from the first fully monitored process group, select Show full trace.
In the call chain in this example, easyTravel Customer Frontend is the first service and it calls AuthenticationService and VerificationService. To look into the called service AuthenticationService's requests, select AuthenticationService > Distributed traces ![]() .
.
Filtering AuthenticationService traces by response time, you can choose to exclusively view requests slower than 15ms. The refined list now shows requests of AuthenticationService slower than 15ms called by easyTravel Customer Frontend when the frontend request also calls VerificationService.
To analyze AuthenticationService requests without including the easyTravel Customer Frontend service in the analysis, select a trace.
To look at the same distributed trace from the perspective of the first caller service, easyTravel Customer Frontend, select Show full trace.
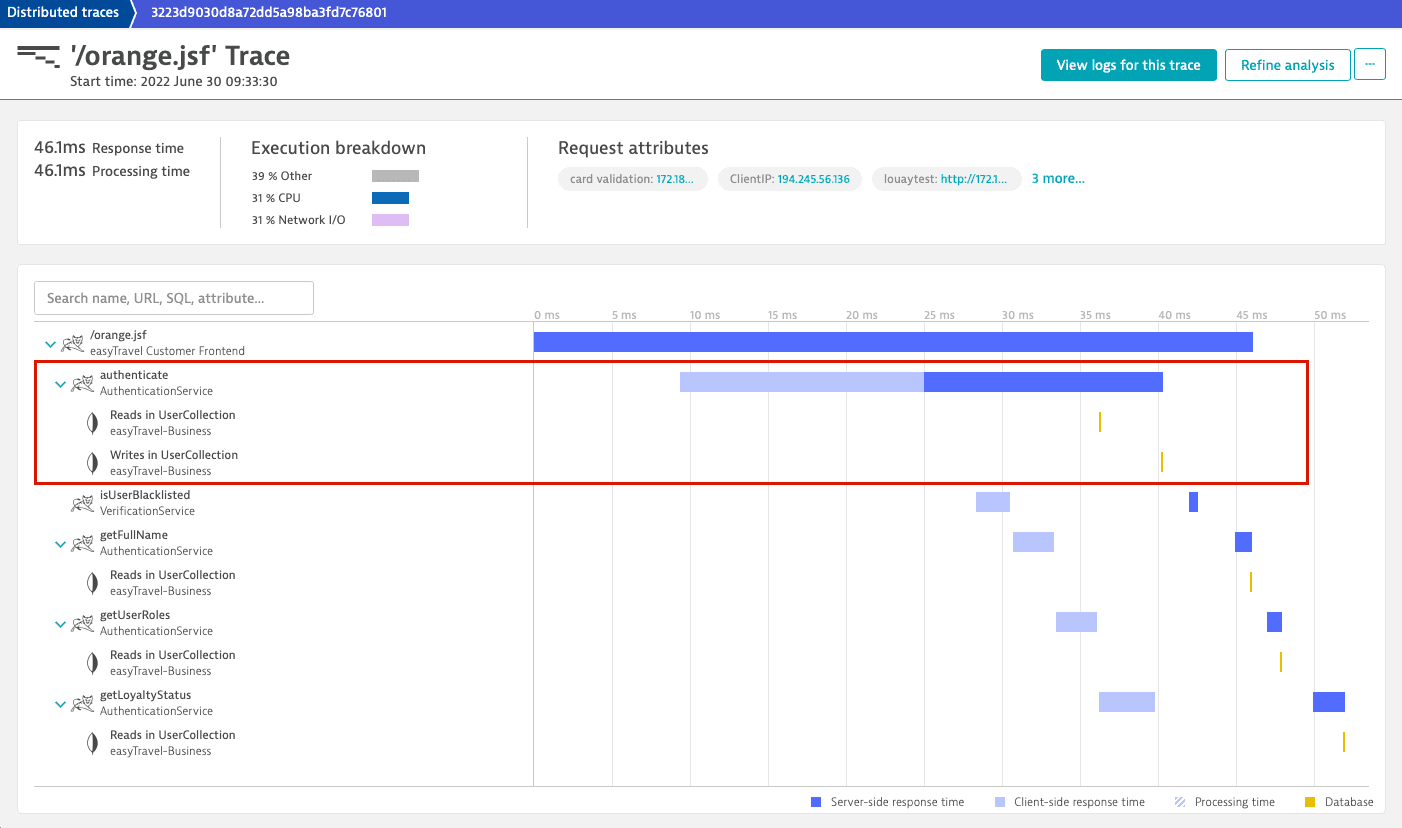
This is the same distributed trace we began our analysis with. You can still see the AuthenticationService call and its two database calls, but now they are embedded in a larger request.