Built-in classic metrics
- Dynatrace Classic
- Reference
- 3-min read
- Published Sep 03, 2020
Each Dynatrace-supported technology offers multiple "built-in" metrics. Built-in metrics are included in the product out of the box, in some cases as part of built-in extensions.
Metrics that are based on OneAgent or ActiveGate extensions (prefix ext:) and calculated metrics (prefix calc:) are custom metrics, not built-in metrics; DDU consumption for these metrics can vary widely depending on how you use Dynatrace.
The ext: prefix is used by metrics from OneAgent extensions and ActiveGate extensions, and also by classic metrics for AWS integration.
Despite the naming similarities, AWS integration metrics are not based on extensions.
To view all the metrics available in your environment, use the GET metrics API call. We recommend the following query parameters:
pageSize=500—to obtain the largest possible number of metrics in one response.fields=displayName,unit,aggregationTypes,dduBillable—to obtain the same set of fields as you see in these tables.- Depending on which metrics you want to query, one of the following values for the metricSelector parameter:
metricSelector=ext:*—to obtain all metrics coming from extensions.metricSelector=calc:*—to obtain all calculated metrics.- Omit the parameter to obtain all the metrics of your environment.
The sections below describe inconsistencies or limitations identified for Dynatrace built-in metrics.
Application and billing metrics for mobile and custom apps
The Other applications metrics section contains metrics captured for mobile and custom applications. These metrics, which start with builtin:apps.other, are captured without the indication whether it's a mobile or a custom application. However, the "billing" application metrics, which start with builtin:billing.apps, are split for these application types:
-
Mobile apps:
builtin:billing.apps.mobile.sessionsWithoutReplayByApplicationbuiltin:billing.apps.mobile.sessionsWithReplayByApplicationbuiltin:billing.apps.mobile.userActionPropertiesByMobileApplication
-
Custom apps:
builtin:billing.apps.custom.sessionsWithoutReplayByApplicationbuiltin:billing.apps.custom.userActionPropertiesByDeviceApplication
Billing metrics count both billed and unbilled sessions
The following "billing" metrics for session count are actually the sum of billed and unbilled user sessions.
builtin:billing.apps.custom.sessionsWithoutReplayByApplicationbuiltin:billing.apps.mobile.sessionsWithReplayByApplicationbuiltin:billing.apps.mobile.sessionsWithoutReplayByApplicationbuiltin:billing.apps.web.sessionsWithReplayByApplicationbuiltin:billing.apps.web.sessionsWithoutReplayByApplication
If you want to get only the number of billed sessions, set the Type filter to Billed.
Different measurement units for request duration metrics
Different measurement units are used for similar request duration metrics for mobile and custom apps.
builtin:apps.other.keyUserActions.requestDuration.os is measured in microseconds while other request duration metrics (builtin:apps.other.requestTimes.osAndVersion and builtin:apps.other.requestTimes.osAndProvider) are measured in milliseconds.
Custom vs built-in metrics
Custom metrics are defined or installed by the user, while built-in metrics are by default part of the product. Certain built-in metrics are disabled by default and, if turned on, will consume DDUs. These metrics cover a wide range of supported technologies, including Apache Tomcat, NGINX, Couchbase, RabbitMQ, Cassandra, Jetty, and many others.
A custom metric is a new type of metric that offers a user-provided metric identifier and unit of measure. The semantics of custom metrics are defined by you and aren't included in the default OneAgent installation. Custom metrics are sent to Dynatrace through various interfaces. Following the definition of a custom metric, the metric can be reported for multiple monitored components. Each component’s custom metric results in a separate timeseries.
For example, if you define a new custom metric called Files count that counts the newly created files within a directory, this new metric can be collected either for one host or for two individual hosts. Collecting the same metric for two individual hosts results in two timeseries of the same custom metric type, as shown in the example below:
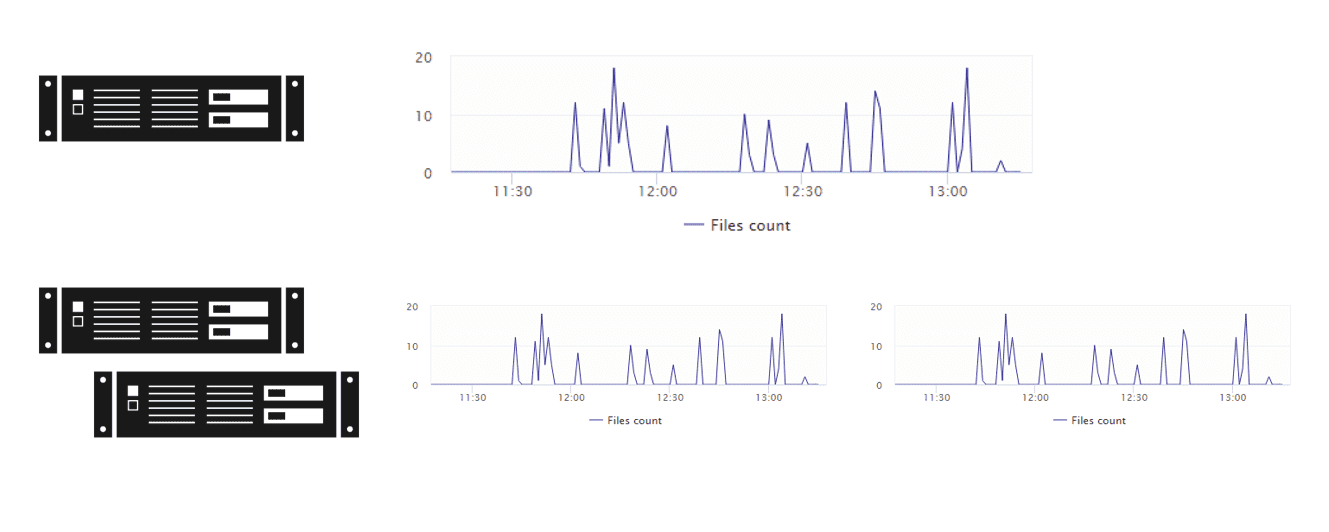
For the purposes of calculating monitoring consumption, collecting the same custom metric for two hosts counts as two separate custom metrics.
Applications
Custom
| Metric key | Name and description | Unit | Aggregations |
|---|---|---|---|
| builtin:apps | Reported error count (by OS, app version) [custom] The number of all reported errors. | Count | autovalue |
| builtin:apps | Session count (by OS, app version) [custom] The number of captured user sessions. | Count | autovalue |
Mobile
| Metric key | Name and description | Unit | Aggregations |
|---|---|---|---|
| builtin:apps | Session count (by OS, app version, crash replay feature status) [mobile] The number of captured user sessions. | Count | autovalue |
| builtin:apps | Session count (by OS, app version, full replay feature status) [mobile] The number of captured user sessions. | Count | autovalue |
| builtin:apps | Reported error count (by OS, app version) [mobile] The number of all reported errors. | Count | autovalue |
Web applications
| Metric key | Name and description | Unit | Aggregations |
|---|---|---|---|
| builtin:apps | User action rate - affected by JavaScript errors (by key user action, user type) [web] The percentage of key user actions with detected JavaScript errors. | Percent (%) | autovalue |
| builtin:apps | Apdex (by key user action) [web] The average Apdex rating for key user actions. | autoavg | |
| builtin:apps | Action count - custom action (by key user action, browser) [web] The number of custom actions that are marked as key user actions. | Count | autovalue |
| builtin:apps | Action count - load action (by key user action, browser) [web] The number of load actions that are marked as key user actions. | Count | autovalue |
| builtin:apps | Action count - XHR action (by key user action, browser) [web] The number of XHR actions that are marked as key user actions. | Count | autovalue |
| builtin:apps | Cumulative Layout Shift - load action (by key user action, user type) [web] The score measuring the unexpected shifting of visible webpage elements. Calculated for load actions that are marked as key user actions. | autoavgcountmaxmedianminpercentilesum | |
| builtin:apps | Cumulative Layout Shift - load action (by key user action, geolocation, user type) [web] The score measuring the unexpected shifting of visible webpage elements. Calculated for load actions that are marked as key user actions. | autoavgcountmaxmedianminpercentilesum | |
| builtin:apps | Cumulative Layout Shift - load action (by key user action, browser) [web] The score measuring the unexpected shifting of visible webpage elements. Calculated for load actions that are marked as key user actions. | autoavgcountmaxmedianminpercentilesum | |
| builtin:apps | DOM interactive - load action (by key user action, browser) [web] The time taken until a page's status is set to "interactive" and it's ready to receive user input. Calculated for load actions that are marked as key user actions. | Millisecond | autoavgcountmaxmedianminpercentilesum |
| builtin:apps | Action duration - custom action (by key user action, browser) [web] The duration of custom actions. | Millisecond | autoavgcountmaxmedianminpercentilesum |
| builtin:apps | Action duration - load action (by key user action, browser) [web] The duration of load actions that are marked as key user actions. | Millisecond | autoavgcountmaxmedianminpercentilesum |
| builtin:apps | Action duration - XHR action (by key user action, browser) [web] The duration of XHR actions that are marked as key user actions. | Millisecond | autoavgcountmaxmedianminpercentilesum |
| builtin:apps | Time to first byte - load action (by key user action, browser) [web] The time taken until the first byte of the response is received from the server, relevant application caches, or a local resource. Calculated for load actions that are marked as key user actions. | Millisecond | autoavgcountmaxmedianminpercentilesum |
| builtin:apps | Time to first byte - XHR action (by key user action, browser) [web] The time taken until the first byte of the response is received from the server, relevant application caches, or a local resource. Calculated for XHR actions that are marked as key user actions. | Millisecond | autoavgcountmaxmedianminpercentilesum |
| builtin:apps | First Input Delay - load action (by key user action, user type) [web] The time from the first interaction with a page to when the user agent can respond to that interaction. Calculated for load actions that are marked as key user actions. | Millisecond | autoavgcountmaxmedianminpercentilesum |
| builtin:apps | First Input Delay - load action (by key user action, geolocation, user type) [web] The time from the first interaction with a page to when the user agent can respond to that interaction. Calculated for load actions that are marked as key user actions. | Millisecond | autoavgcountmaxmedianminpercentilesum |
| builtin:apps | First Input Delay - load action (by key user action, browser) [web] The time from the first interaction with a page to when the user agent can respond to that interaction. Calculated for load actions that are marked as key user actions. | Millisecond | autoavgcountmaxmedianminpercentilesum |
| builtin:apps | Largest Contentful Paint - load action (by key user action, user type) [web] The time taken to render the largest element in the viewport. Calculated for load actions that are marked as key user actions. | Millisecond | autoavgcountmaxmedianminpercentilesum |
| builtin:apps | Largest Contentful Paint - load action (by key user action, geolocation, user type) [web] The time taken to render the largest element in the viewport. Calculated for load actions that are marked as key user actions. | Millisecond | autoavgcountmaxmedianminpercentilesum |
| builtin:apps | Largest Contentful Paint - load action (by key user action, browser) [web] The time taken to render the largest element in the viewport. Calculated for load actions that are marked as key user actions. | Millisecond | autoavgcountmaxmedianminpercentilesum |
| builtin:apps | Load event end - load action (by key user action, browser) [web] The time taken to complete the load event of a page. Calculated for load actions that are marked as key user actions. | Millisecond | autoavgcountmaxmedianminpercentilesum |
| builtin:apps | Load event start - load action (by key user action, browser) [web] The time taken to begin the load event of a page. Calculated for load actions that are marked as key user actions. | Millisecond | autoavgcountmaxmedianminpercentilesum |
| builtin:apps | Network contribution - load action (by key user action, user type) [web] The time taken to request and receive resources (including DNS lookup, redirect, and TCP connect time). Calculated for load actions that are marked as key user actions. | Millisecond | autoavgcountmaxmedianminpercentilesum |
| builtin:apps | Network contribution - XHR action (by key user action, user type) [web] The time taken to request and receive resources (including DNS lookup, redirect, and TCP connect time). Calculated for XHR actions that are marked as key user actions. | Millisecond | autoavgcountmaxmedianminpercentilesum |
| builtin:apps | Response end - load action (by key user action, browser) [web] (AKA HTML downloaded) The time taken until the user agent receives the last byte of the response or the transport connection is closed, whichever comes first. Calculated for load actions that are marked as key user actions. | Millisecond | autoavgcountmaxmedianminpercentilesum |
| builtin:apps | Response end - XHR action (by key user action, browser) [web] The time taken until the user agent receives the last byte of the response or the transport connection is closed, whichever comes first. Calculated for XHR actions that are marked as key user actions. | Millisecond | autoavgcountmaxmedianminpercentilesum |
| builtin:apps | Server contribution - load action (by key user action, user type) [web] The time spent on server-side processing for a page. Calculated for load actions that are marked as key user actions. | Millisecond | autoavgcountmaxmedianminpercentilesum |
| builtin:apps | Server contribution - XHR action (by key user action, user type) [web] The time spent on server-side processing for a page. Calculated for XHR actions that are marked as key user actions. | Millisecond | autoavgcountmaxmedianminpercentilesum |
| builtin:apps | Speed index - load action (by key user action, browser) [web] The score measuring how quickly the visible parts of a page are rendered. Calculated for load actions that are marked as key user actions. | Millisecond | autoavgcountmaxmedianminpercentilesum |
| builtin:apps | Visually complete - load action (by key user action, browser) [web] The time taken to fully render content in the viewport. Calculated for load actions that are marked as key user actions. | Millisecond | autoavgcountmaxmedianminpercentilesum |
| builtin:apps | Visually complete - XHR action (by key user action, browser) [web] The time taken to fully render content in the viewport. Calculated for XHR actions that are marked as key user actions. | Millisecond | autoavgcountmaxmedianminpercentilesum |
| builtin:apps | Error count (by key user action, user type, error type, error origin) [web] The number of detected errors that occurred during key user actions. | Count | autovalue |
| builtin:apps | User action count with errors (by key user action, user type) [web] The number of key user actions with detected errors. | Count | autovalue |
| builtin:apps | JavaScript errors count during user actions (by key user action, user type) [web] The number of detected JavaScript errors that occurred during key user actions. | Count | autovalue |
| builtin:apps | JavaScript error count without user actions (by key user action, user type) [web] The number of detected standalone JavaScript errors (occurred between key user actions). | Count | autovalue |
| builtin:apps | User action rate - affected by errors (by key user action, user type) [web] The percentage of key user actions with detected errors. | Percent (%) | autovalue |
| builtin:apps | Action count - custom action (by browser) [web] The number of custom actions. | Count | autovalue |
| builtin:apps | Action count - load action (by browser) [web] The number of load actions. | Count | autovalue |
| builtin:apps | Action count - XHR action (by browser) [web] The number of XHR actions. | Count | autovalue |
| builtin:apps | Action count (by Apdex category) [web] The number of user actions. | Count | autovalue |
| builtin:apps | Action with key performance metric count (by action type, geolocation, user type) [web] The number of user actions that have a key performance metric and mapped geolocation. | Count | autovalue |
| builtin:apps | Action duration - custom action (by browser) [web] The duration of custom actions. | Millisecond | autoavgcountmaxmedianminpercentilesum |
| builtin:apps | Action duration - load action (by browser) [web] The duration of load actions. | Millisecond | autoavgcountmaxmedianminpercentilesum |
| builtin:apps | Action duration - XHR action (by browser) [web] The duration of XHR actions. | Millisecond | autoavgcountmaxmedianminpercentilesum |
| builtin:apps | Actions per session average (by users, user type) [web] The average number of user actions per user session. | Count | autoavg |
| builtin:apps | Session count - estimated active sessions (by users, user type) [web] The estimated number of active user sessions. An active session is one in which a user has been confirmed to still be active at a given time. For this high-cardinality metric, the HyperLogLog algorithm is used to approximate the session count. | Count | autovalue |
| builtin:apps | User count - estimated active users (by users, user type) [web] The estimated number of unique active users. For this high-cardinality metric, the HyperLogLog algorithm is used to approximate the user count. | Count | autovalue |
| builtin:apps | User action rate - affected by JavaScript errors (by user type) [web] The percentage of user actions with detected JavaScript errors. | Percent (%) | autovalue |
| builtin:apps | Apdex (by user type) [web] | autoavg | |
| builtin:apps | Apdex (by geolocation, user type) [web] The average Apdex rating for user actions that have a mapped geolocation. | autoavg | |
| builtin:apps | Bounce rate (by users, user type) [web] The percentage of sessions in which users viewed only a single page and triggered only a single web request. Calculated by dividing single-page sessions by all sessions. | Percent (%) | autovalue |
| builtin:apps | Conversion rate - sessions (by users, user type) [web] The percentage of sessions in which at least one conversion goal was reached. Calculated by dividing converted sessions by all sessions. | Percent (%) | autovalue |
| builtin:apps | Session count - converted sessions (by users, user type) [web] The number of sessions in which at least one conversion goal was reached. | Count | autovalue |
| builtin:apps | Cumulative Layout Shift - load action (by user type) [web] The score measuring the unexpected shifting of visible webpage elements. Calculated for load actions. | autoavgcountmaxmedianminpercentilesum | |
| builtin:apps | Cumulative Layout Shift - load action (by geolocation, user type) [web] The score measuring the unexpected shifting of visible webpage elements. Calculated for load actions. | autoavgcountmaxmedianminpercentilesum | |
| builtin:apps | Cumulative Layout Shift - load action (by browser) [web] The score measuring the unexpected shifting of visible webpage elements. Calculated for load actions. | autoavgcountmaxmedianminpercentilesum | |
| builtin:apps | DOM interactive - load action (by browser) [web] The time taken until a page's status is set to "interactive" and it's ready to receive user input. Calculated for load actions. | Millisecond | autoavgcountmaxmedianminpercentilesum |
| builtin:apps | Session count - estimated ended sessions (by users, user type) [web] The number of completed user sessions. | Count | autovalue |
| builtin:apps | Rage click count [web] The number of detected rage clicks. | Count | autovalue |
| builtin:apps | Time to first byte - load action (by browser) [web] The time taken until the first byte of the response is received from the server, relevant application caches, or a local resource. Calculated for load actions. | Millisecond | autoavgcountmaxmedianminpercentilesum |
| builtin:apps | Time to first byte - XHR action (by browser) [web] The time taken until the first byte of the response is received from the server, relevant application caches, or a local resource. Calculated for XHR actions. | Millisecond | autoavgcountmaxmedianminpercentilesum |
| builtin:apps | First Input Delay - load action (by user type) [web] The time from the first interaction with a page to when the user agent can respond to that interaction. Calculated for load actions. | Millisecond | autoavgcountmaxmedianminpercentilesum |
| builtin:apps | First Input Delay - load action (by geolocation, user type) [web] The time from the first interaction with a page to when the user agent can respond to that interaction. Calculated for load actions. | Millisecond | autoavgcountmaxmedianminpercentilesum |
| builtin:apps | First Input Delay - load action (by browser) [web] The time from the first interaction with a page to when the user agent can respond to that interaction. Calculated for load actions. | Millisecond | autoavgcountmaxmedianminpercentilesum |
| builtin:apps | Largest Contentful Paint - load action (by user type) [web] The time taken to render the largest element in the viewport. Calculated for load actions. | Millisecond | autoavgcountmaxmedianminpercentilesum |
| builtin:apps | Largest Contentful Paint - load action (by geolocation, user type) [web] The time taken to render the largest element in the viewport. Calculated for load actions. | Millisecond | autoavgcountmaxmedianminpercentilesum |
| builtin:apps | Largest Contentful Paint - load action (by browser) [web] The time taken to render the largest element in the viewport. Calculated for load actions. | Millisecond | autoavgcountmaxmedianminpercentilesum |
| builtin:apps | Load event end - load action (by browser) [web] The time taken to complete the load event of a page. Calculated for load actions. | Millisecond | autoavgcountmaxmedianminpercentilesum |
| builtin:apps | Load event start - load action (by browser) [web] The time taken to begin the load event of a page. Calculated for load actions. | Millisecond | autoavgcountmaxmedianminpercentilesum |
| builtin:apps | Network contribution - load action (by user type) [web] The time taken to request and receive resources (including DNS lookup, redirect, and TCP connect time). Calculated for load actions. | Millisecond | autoavgcountmaxmedianminpercentilesum |
| builtin:apps | Network contribution - XHR action (by user type) [web] The time taken to request and receive resources (including DNS lookup, redirect, and TCP connect time). Calculated for XHR actions. | Millisecond | autoavgcountmaxmedianminpercentilesum |
| builtin:apps | Response end - load action (by browser) [web] (AKA HTML downloaded) The time taken until the user agent receives the last byte of the response or the transport connection is closed, whichever comes first. Calculated for load actions. | Millisecond | autoavgcountmaxmedianminpercentilesum |
| builtin:apps | Response end - XHR action (by browser) [web] The time taken until the user agent receives the last byte of the response or the transport connection is closed, whichever comes first. Calculated for XHR actions. | Millisecond | autoavgcountmaxmedianminpercentilesum |
| builtin:apps | Server contribution - load action (by user type) [web] The time spent on server-side processing for a page. Calculated for load actions. | Millisecond | autoavgcountmaxmedianminpercentilesum |
| builtin:apps | Server contribution - XHR action (by user type) [web] The time spent on server-side processing for a page. Calculated for XHR actions. | Millisecond | autoavgcountmaxmedianminpercentilesum |
| builtin:apps | Session duration (by users, user type) [web] The average duration of user sessions. | Microsecond | autoavg |
| builtin:apps | Speed index - load action (by browser) [web] The score measuring how quickly the visible parts of a page are rendered. Calculated for load actions. | Millisecond | autoavgcountmaxmedianminpercentilesum |
| builtin:apps | Session count - estimated started sessions (by users, user type) [web] The number of started user sessions. | Count | autovalue |
| builtin:apps | Visually complete - load action (by browser) [web] The time taken to fully render content in the viewport. Calculated for load actions. | Millisecond | autoavgcountmaxmedianminpercentilesum |
| builtin:apps | Visually complete - XHR action (by browser) [web] The time taken to fully render content in the viewport. Calculated for XHR actions. | Millisecond | autoavgcountmaxmedianminpercentilesum |
| builtin:apps | Error count (by user type, error type, error origin) [web] The number of detected errors. | Count | autovalue |
| builtin:apps | Error count during user actions (by user type, error type, error origin) [web] The number of detected errors that occurred during user actions. | Count | autovalue |
| builtin:apps | Standalone error count (by user type, error type, error origin) [web] The number of detected standalone errors (occurred between user actions). | Count | autovalue |
| builtin:apps | User action count - with errors (by user type) [web] The number of user actions with detected errors. | Count | autovalue |
| builtin:apps | Error count for Davis (by user type, error type, error origin, error context)) [web] The number of errors that were included in Davis AI problem detection and analysis. | Count | autovalue |
| builtin:apps | Interaction to next paint | Millisecond | autocountmaxmedianminpercentile |
| builtin:apps | JavaScript error count - during user actions (by user type) [web] The number of detected JavaScript errors that occurred during user actions. | Count | autovalue |
| builtin:apps | JavaScript error count - without user actions (by user type) [web] The number of detected standalone JavaScript errors (occurred between user actions). | Count | autovalue |
| builtin:apps | User action rate - affected by errors (by user type) [web] The percentage of user actions with detected errors. | Percent (%) | autovalue |
Mobile and custom apps
| Metric key | Name and description | Unit | Aggregations |
|---|---|---|---|
| builtin:apps | Apdex (by OS, geolocation) [mobile, custom] The Apdex rating for all captured user actions. | autovalue | |
| builtin:apps | Apdex (by OS, app version) [mobile, custom] The Apdex rating for all captured user actions. | autovalue | |
| builtin:apps | User count - estimated users affected by crashes (by OS) [mobile, custom] The estimated number of unique users affected by a crash. For this high cardinality metric, the HyperLogLog algorithm is used to approximate the number of users. | Count | autovalue |
| builtin:apps | User count - estimated users affected by crashes (by OS, app version) [mobile, custom] The estimated number of unique users affected by a crash. For this high cardinality metric, the HyperLogLog algorithm is used to approximate the number of users. | Count | autovalue |
| builtin:apps | User rate - estimated users affected by crashes (by OS) [mobile, custom] The estimated percentage of unique users affected by a crash. For this high cardinality metric, the HyperLogLog algorithm is used to approximate the number of users. | Percent (%) | autovalue |
| builtin:apps | Crash count (by OS, geolocation) [mobile, custom] The number of detected crashes. | Count | autovalue |
| builtin:apps | Crash count (by OS, app version) [mobile, custom] The number of detected crashes. | Count | autovalue |
| builtin:apps | Crash count (by OS, app version) [mobile, custom] The number of detected crashes. | Count | autovalue |
| builtin:apps | User rate - estimated crash free users (by OS) [mobile, custom] The estimated percentage of unique users not affected by a crash. For this high cardinality metric, the HyperLogLog algorithm is used to approximate the number of users. | Percent (%) | autovalue |
| builtin:apps | Apdex (by key user action, OS) [mobile, custom] The Apdex rating for all captured key user actions. | autovalue | |
| builtin:apps | Action count (by key user action, OS, Apdex category) [mobile, custom] The number of captured key user actions. | Count | autovalue |
| builtin:apps | Action duration (by key user action, OS) [mobile, custom] The duration of key user actions. | Microsecond | autoavgcountmaxmedianminpercentilesum |
| builtin:apps | Reported error count (by key user action, OS) [mobile, custom] The number of reported errors for key user actions. | Count | autovalue |
| builtin:apps | Request count (by key user action, OS) [mobile, custom] The number of captured web requests associated with key user actions. | Count | autovalue |
| builtin:apps | Request duration (by key user action, OS) [mobile, custom] The duration of web requests for key user actions. Be aware that this metric is measured in microseconds while other request duration metrics for mobile and custom apps are measured in milliseconds. | Millisecond | autoavgcountmaxmedianminpercentilesum |
| builtin:apps | Request error count (by key user action, OS) [mobile, custom] The number of detected web request errors for key user actions. | Count | autovalue |
| builtin:apps | Request error rate (by key user action, OS) [mobile, custom] The percentage of web requests with detected errors for key user actions | Percent (%) | autovalue |
| builtin:apps | New user count (by OS) [mobile, custom] The number of users that launched the application(s) for the first time. The metric is tied to specific devices, so users are counted multiple times if they install the application on multiple devices. The metric doesn't distinguish between multiple users that share the same device and application installation. | Count | autovalue |
| builtin:apps | Request count (by OS, provider) [mobile, custom] The number of captured web requests. | Count | autovalue |
| builtin:apps | Request count (by OS, app version) [mobile, custom] The number of captured web requests. | Count | autovalue |
| builtin:apps | Request error count (by OS, provider) [mobile, custom] The number of detected web request errors. | Count | autovalue |
| builtin:apps | Request error count (by OS, app version) [mobile, custom] The number of detected web request errors. | Count | autovalue |
| builtin:apps | Request error rate (by OS, provider) [mobile, custom] The percentage of web requests with detected errors. | Percent (%) | autovalue |
| builtin:apps | Request error rate (by OS, app version) [mobile, custom] The percentage of web requests with detected errors. | Percent (%) | autovalue |
| builtin:apps | Request duration (by OS, provider) [mobile, custom] The duration of web requests. | Millisecond | autoavgcountmaxmedianminpercentilesum |
| builtin:apps | Request duration (by OS, app version) [mobile, custom] The duration of web requests. | Millisecond | autoavgcountmaxmedianminpercentilesum |
| builtin:apps | Session count (by agent version, OS) [mobile, custom] The number of captured user sessions. | Count | autovalue |
| builtin:apps | Session count (by OS, crash reporting level) [mobile, custom] The number of captured user sessions. | Count | autovalue |
| builtin:apps | Session count (by OS, data collection level) [mobile, custom] The number of captured user sessions. | Count | autovalue |
| builtin:apps | Session count - estimated (by OS, geolocation) [mobile, custom] The estimated number of captured user sessions. For this high cardinality metric, the HyperLogLog algorithm is used to approximate the number of sessions. | Count | autovalue |
| builtin:apps | Session count (by OS, app version) [mobile, custom] The number of captured user sessions. | Count | autovalue |
| builtin:apps | Action count (by geolocation, Apdex category) [mobile, custom] The number of captured user actions. | Count | autovalue |
| builtin:apps | Action count (by OS, Apdex category) [mobile, custom] The number of captured user actions. | Count | autovalue |
| builtin:apps | Action count (by OS, app version) [mobile, custom] The number of captured user actions. | Count | autovalue |
| builtin:apps | Action duration (by OS, app version) [mobile, custom] The duration of user actions. | Microsecond | autoavgcountmaxmedianminpercentilesum |
| builtin:apps | User count - estimated (by OS, geolocation) [mobile, custom] The estimated number of unique users that have a mapped geolocation. The metric is based on 'internalUserId'. When 'dataCollectionLevel' is set to 'performance' or 'off', 'internalUserId' is changed at each app start. For this high cardinality metric, the HyperLogLog algorithm is used to approximate the number of users. | Count | autovalue |
| builtin:apps | User count - estimated (by OS, app version) [mobile, custom] The estimated number of unique users. The metric is based on 'internalUserId'. When 'dataCollectionLevel' is set to 'performance' or 'off', 'internalUserId' is changed at each app start. For this high cardinality metric, the HyperLogLog algorithm is used to approximate the number of users. | Count | autovalue |
Billing
Applications
| Metric key | Name and description | Unit | Aggregations |
|---|---|---|---|
| builtin:billing | Session count - billed and unbilled [custom] The number of billed and unbilled user sessions. To get only the number of billed sessions, set the "Type" filter to "Billed". | Count | autovalue |
| builtin:billing | Total user action and session properties The number of billed user action and user session properties. | Count | autovalue |
| builtin:billing | Session count - billed and unbilled - with Session Replay [mobile] The number of billed and unbilled user sessions that include Session Replay data. To get only the number of billed sessions, set the "Type" filter to "Billed". | Count | autovalue |
| builtin:billing | Session count - billed and unbilled [mobile] The total number of billed and unbilled user sessions (with and without Session Replay data). To get only the number of billed sessions, set the "Type" filter to "Billed". | Count | autovalue |
| builtin:billing | Total user action and session properties The number of billed user action and user session properties. | Count | autovalue |
| builtin:billing | Session count - billed and unbilled - with Session Replay [web] The number of billed and unbilled user sessions that include Session Replay data. To get only the number of billed sessions, set the "Type" filter to "Billed". | Count | autovalue |
| builtin:billing | Session count - billed and unbilled - without Session Replay [web] The number of billed and unbilled user sessions that do not include Session Replay data. To get only the number of billed sessions, set the "Type" filter to "Billed". | Count | autovalue |
| builtin:billing | Total user action and session properties The number of billed user action and user session properties. | Count | autovalue |
Custom events classic
| Metric key | Name and description | Unit | Aggregations |
|---|---|---|---|
| builtin:billing | (DPS) Total Custom Events Classic billing usage The number of custom events ingested aggregated over all monitored entities. Custom events include events sent to Dynatrace via the Events API or events created by a log event extraction rule. Use this total metric to query longer timeframes without losing precision or performance. | Count | autovalue |
| builtin:billing | (DPS) Custom Events Classic billing usage by monitored entity The number of custom events ingested split by monitored entity. Custom events include events sent to Dynatrace via the Events API or events created by a log event extraction rule. For details on the events billed, refer to the usage_by_event_info metric. To improve performance and avoid exceeding query limits when working with longer timeframes, use the total metric. | Count | autovalue |
| builtin:billing | (DPS) Custom Events Classic billing usage by event info The number of custom events ingested split by event info. Custom events include events sent to Dynatrace via the Events API or events created by a log event extraction rule. The info contains the context of the event plus the configuration ID. For details on the related monitored entities, refer to the usage_by_entity metric. To improve performance and avoid exceeding query limits when working with longer timeframes, use the total metric. | Count | autovalue |
Custom metrics classic
| Metric key | Name and description | Unit | Aggregations |
|---|---|---|---|
| builtin:billing | (DPS) Recorded metric data points per metric key The number of reported metric data points split by metric key. This metric does not account for included metric data points available to your environment. | Count | autovalue |
| builtin:billing | (DPS) Total billed metric data points The total number of metric data points after deducting the included metric data points. This is the rate-card value used for billing. Use this total metric to query longer timeframes without losing precision or performance. | Count | autovalue |
| builtin:billing | (DPS) Total metric data points billable for Foundation & Discovery hosts The number of metric data points billable for Foundation & Discovery hosts. | Count | autovalue |
| builtin:billing | (DPS) Total metric data points billed for Full-Stack hosts The number of metric data points billed for Full-Stack hosts. To view the unadjusted usage per host, use builtin:billing.full_stack_monitoring.metric_data_points.ingested_by_host . This trailing metric is reported at 15-minute intervals with up to a 15-minute delay. | Count | autovalue |
| builtin:billing | (DPS) Total metric data points billed for Infrastructure-monitored hosts The number of metric data points billed for Infrastructure-monitored hosts. To view the unadjusted usage per host, use builtin:billing.infrastructure_monitoring.metric_data_points.ingested_by_host . This trailing metric is reported at 15-minute intervals with up to a 15-minute delay. | Count | autovalue |
| builtin:billing | (DPS) Total metric data points billed by other entities The number of metric data points billed that cannot be assigned to a host. The values reported in this metric are not eligible for included metric deduction and will be billed as is. This trailing metric is reported at 15-minute intervals with up to a 15-minute delay. o view the monitored entities that consume this usage, use the other_by_entity metric. | Count | autovalue |
| builtin:billing | (DPS) Billed metric data points reported and split by other entities The number of billed metric data points split by entities that cannot be assigned to a host. The values reported in this metric are not eligible for included metric deduction and will be billed as is. This trailing metric is reported at 15-minute intervals with up to a 15-minute delay. To improve performance and avoid exceeding query limits when working with longer timeframes, use the total metric. | Count | autovalue |
Custom traces classic
| Metric key | Name and description | Unit | Aggregations |
|---|---|---|---|
| builtin:billing | (DPS) Total Custom Traces Classic billing usage The number of spans ingested aggregated over all monitored entities. A span is a single operation within a distributed trace, ingested into Dynatrace. Use this total metric to query longer timeframes without losing precision or performance. | Count | autovalue |
| builtin:billing | (DPS) Custom Traces Classic billing usage by monitored entity The number of spans ingested split by monitored entity. A span is a single operation within a distributed trace, ingested into Dynatrace. For details on span types, refer to the usage_by_span_type metric. To improve performance and avoid exceeding query limits when working with longer timeframes, use the total metric. | Count | autovalue |
| builtin:billing | (DPS) Custom Traces Classic billing usage by span type The number of spans ingested split by span type. A span is a single operation within a distributed trace, ingested into Dynatrace. Span kinds can be CLIENT, SERVER, PRODUCER, CONSUMER or INTERNAL For details on the related monitored entities, refer to the usage_by_entity metric. To improve performance and avoid exceeding query limits when working with longer timeframes, use the total metric. | Count | autovalue |
DDU
| Metric key | Name and description | Unit | Aggregations |
|---|---|---|---|
| builtin:billing | DDU events consumption by event info License consumption of Davis data units by events pool split by event info | autovalue | |
| builtin:billing | DDU events consumption by monitored entity License consumption of Davis data units by events pool split by monitored entity | autovalue | |
| builtin:billing | Total DDU events consumption Sum of license consumption of Davis data units aggregated over all monitored entities for the events pool | autovalue | |
| builtin:billing | DDU log consumption by log path License consumption of Davis data units by log pool split by log path | autovalue | |
| builtin:billing | DDU log consumption by monitored entity License consumption of Davis data units by log pool split by monitored entity | autovalue | |
| builtin:billing | Total DDU log consumption Sum of license consumption of Davis data units aggregated over all logs for the log pool | autovalue | |
| builtin:billing | DDU metrics consumption by monitored entity License consumption of Davis data units by metrics pool split by monitored entity | autovalue | |
| builtin:billing | DDU metrics consumption by monitored entity w/o host-unit included DDUs License consumption of Davis data units by metrics pool split by monitored entity (aggregates host-unit included metrics, so value might be higher than actual consumption) | autovalue | |
| builtin:billing | Reported metrics DDUs by metric key Reported Davis data units usage by metrics pool split by metric key | autovalue | |
| builtin:billing | Total DDU metrics consumption Sum of license consumption of Davis data units aggregated over all metrics for the metrics pool | autovalue | |
| builtin:billing | DDU serverless consumption by function License consumption of Davis data units by serverless pool split by Amazon Resource Names (ARNs) | autovalue | |
| builtin:billing | DDU serverless consumption by service License consumption of Davis data units by serverless pool split by service | autovalue | |
| builtin:billing | Total DDU serverless consumption Sum of license consumption of Davis data units aggregated over all services for the serverless pool | autovalue | |
| builtin:billing | DDU traces consumption by span type License consumption of Davis data units by traces pool split by SpanKind, as defined in OpenTelemetry specification | autovalue | |
| builtin:billing | DDU traces consumption by monitored entity License consumption of Davis data units by traces pool split by monitored entity | autovalue | |
| builtin:billing | Total DDU traces consumption Sum of license consumption of Davis data units aggregated over all monitored entities for the traces pool | autovalue | |
| builtin:billing | DDU included per host Included Davis data units per host | autovalue | |
| builtin:billing | DDU included metric data points per host Included metric data points per host | autovalue |
Events
| Metric key | Name and description | Unit | Aggregations |
|---|---|---|---|
| builtin:billing | [Deprecated] (DPS) Business events usage - Ingest & Process Business events Ingest & Process usage, tracked as bytes ingested within the hour. This trailing metric is reported hourly for the previous hour. Metric values are reported with up to a one-hour delay. [Deprecated] This metric is replaced by billing usage events. | Byte | autovalue |
| builtin:billing | [Deprecated] (DPS) Business events usage - Query Business events Query usage, tracked as bytes read within the hour. This trailing metric is reported hourly for the previous hour. Metric values are reported with up to a one-hour delay. [Deprecated] This metric is replaced by billing usage events. | Byte | autovalue |
| builtin:billing | [Deprecated] (DPS) Business events usage - Retain Business events Retain usage, tracked as total storage used within the hour, in bytes. This trailing metric is reported hourly for the previous hour. Metric values are reported with up to a one-hour delay. [Deprecated] This metric is replaced by billing usage events. | Byte | autoavgmaxmin |
Foundation and discovery
| Metric key | Name and description | Unit | Aggregations |
|---|---|---|---|
| builtin:billing | (DPS) Ingested metric data points for Foundation & Discovery The number of metric data points aggregated over all Foundation & Discovery hosts. | Count | autovalue |
| builtin:billing | (DPS) Ingested metric data points for Foundation & Discovery per host The number of metric data points split by Foundation & Discovery hosts. See further details. | Count | autovalue |
| builtin:billing | (DPS) Foundation & Discovery billing usage The total number of host-hours being monitored by Foundation & Discovery, counted in 15 min intervals. | Count | autovalue |
| builtin:billing | (DPS) Foundation & Discovery billing usage per host The host-hours being monitored by Foundation & Discovery, counted in 15 min intervals. See further details. | Count | autovalue |
Full stack monitoring
| Metric key | Name and description | Unit | Aggregations |
|---|---|---|---|
| builtin:billing | (DPS) Available included metric data points for Full-Stack hosts The total number of included metric data points that can be deducted from the metric data points reported by Full-Stack hosts. This trailing metric is reported at 15-minute intervals with up to a 15-minute delay. To view the number of applied included metric data points, use builtin:billing.full_stack_monitoring.metric_data_points.included_used . If the difference between this metric and the applied metrics is greater than 0, then more metrics can be ingested using Full-Stack Monitoring without incurring additional costs. | Count | autovalue |
| builtin:billing | (DPS) Used included metric data points for Full-Stack hosts The number of consumed included metric data points per host monitored with Full-Stack Monitoring. This trailing metric is reported at 15-minute intervals with up to a 15-minute delay. To view the number of potentially available included metrics, use builtin:billing.full_stack_monitoring.metric_data_points.included_used . If the difference between this metric and the available metrics is greater than zero, then that means that more metrics could be ingested on Full-Stack hosts without incurring additional costs. | Count | autovalue |
| builtin:billing | (DPS) Total metric data points reported by Full-Stack hosts The number of metric data points aggregated over all Full-Stack hosts. The values reported in this metric are eligible for included-metric-data-point deduction. Use this total metric to query longer timeframes without losing precision or performance. This trailing metric is reported at 15-minute intervals with up to a 15-minute delay. To view usage on a per-host basis, use builtin:billing.full_stack_monitoring.metric_data_points.ingested_by_host . | Count | autovalue |
| builtin:billing | (DPS) Metric data points reported and split by Full-Stack hosts The number of metric data points split by Full-Stack hosts. The values reported in this metric are eligible for included-metric-data-point deduction. This trailing metric is reported at 15-minute intervals with up to a 15-minute delay. The pool of available included metrics for a "15-minute interval" is visible via builtin:billing.full_stack_monitoring.metric_data_points.included . To improve performance and avoid exceeding query limits when working with longer timeframes, use the total metric. See further details. | Count | autovalue |
| builtin:billing | (DPS) Full-Stack Monitoring billing usage The total GiB memory of hosts being monitored in full-stack mode, counted in 15 min intervals. Use this total metric to query longer timeframes without losing precision or performance. For details on the hosts causing the usage, refer to the usage_per_host metric. For details on the containers causing the usage, refer to the usage_per_container metric. | GibiByte | autovalue |
| builtin:billing | (DPS) Full-stack usage by container type The total GiB memory of containers being monitored in full-stack mode, counted in 15 min intervals. | GibiByte | autovalue |
| builtin:billing | (DPS) Full-Stack Monitoring billing usage per host The GiB memory per host being monitored in full-stack mode, counted in 15 min intervals. For example, a host with 8 GiB of RAM monitored for 1 hour has 4 data points with a value of | GibiByte | autovalue |
Infrastructure monitoring
| Metric key | Name and description | Unit | Aggregations |
|---|---|---|---|
| builtin:billing | (DPS) Available included metric data points for Infrastructure-monitored hosts The total number of included metric data points that can be deducted from the metric data points reported by Infrastructure-monitored hosts. This trailing metric is reported at 15-minute intervals with up to a 15-minute delay. To view the number of applied included metric data points, use builtin:billing.infrastructure_monitoring.metric_data_points.included_used . If the difference between this metric and the applied metrics is greater than zero, then that means that more metrics could be ingested on Infrastructure-monitored hosts without incurring additional costs. | Count | autovalue |
| builtin:billing | (DPS) Used included metric data points for Infrastructure-monitored hosts The number of consumed included metric data points for Infrastructure-monitored hosts. This trailing metric is reported at 15-minute intervals with up to a 15-minute delay. To view the number of potentially available included metrics, use builtin:billing.infrastructure_monitoring.metric_data_points.included_used . If the difference between this metric and the available metrics is greater than zero, then that means that more metrics could be ingested on Infrastructure-monitored hosts without incurring additional costs. | Count | autovalue |
| builtin:billing | (DPS) Total metric data points reported by Infrastructure-monitored hosts The number of metric data points aggregated over all Infrastructure-monitored hosts. The values reported in this metric are eligible for included-metric-data-point deduction. Use this total metric to query longer timeframes without losing precision or performance. This trailing metric is reported at 15-minute intervals with up to a 15-minute delay. To view usage on a per-host basis, use the builtin:billing.full_stack_monitoring.metric_data_points.ingested_by_host . | Count | autovalue |
| builtin:billing | (DPS) Metric data points reported and split by Infrastructure-monitored hosts The number of metric data points split by Infrastructure-monitored hosts. The values reported in this metric are eligible for included-metric-data-point deduction. This trailing metric is reported at 15-minute intervals with up to a 15-minute delay. The pool of available included metrics for a "15-minute interval" is visible via builtin:billing.infrastructure_monitoring.metric_data_points.included . To improve performance and avoid exceeding query limits when working with longer timeframes, use the total metric. See further details. | Count | autovalue |
| builtin:billing | (DPS) Infrastructure Monitoring billing usage The total number of host-hours being monitored in infrastructure-only mode, counted in 15 min intervals. Use this total metric to query longer timeframes without losing precision or performance. For details on the hosts causing the usage, refer to the usage_per_host metric. | Count | autovalue |
| builtin:billing | (DPS) Infrastructure Monitoring billing usage per host The host-hours being monitored in infrastructure-only mode, counted in 15 min intervals. A host monitored for the whole hour has 4 data points with a value of 0.25, regardless of the memory size. To improve performance and avoid exceeding query limits when working with longer timeframes, use the total metric. See further details. | Count | autovalue |
Kubernetes monitoring
| Metric key | Name and description | Unit | Aggregations |
|---|---|---|---|
| builtin:billing | (DPS) Kubernetes Platform Monitoring billing usage The total number of monitored Kubernetes pods per hour, split by cluster and namespace and counted in 15 min intervals. A pod monitored for the whole hour has 4 data points with a value of 0.25. | Count | autovalue |
Log
| Metric key | Name and description | Unit | Aggregations |
|---|---|---|---|
| builtin:billing | (DPS) Log Management and Analytics usage - Ingest & Process Log Management and Analytics Ingest & Process usage, tracked as bytes ingested within the hour. This trailing metric is reported hourly for the previous hour. Metric values are reported with up to a one-hour delay. | Byte | autovalue |
| builtin:billing | (DPS) Log Management and Analytics usage - Query Log Management and Analytics Query usage, tracked as bytes read within the hour. This trailing metric is reported hourly for the previous hour. Metric values are reported with up to a one-hour delay. | Byte | autovalue |
| builtin:billing | (DPS) Log Management and Analytics usage - Retain Log Management and Analytics Retain usage, tracked as total storage used within the hour, in bytes. This trailing metric is reported hourly for the previous hour. Metric values are reported with up to a one-hour delay. | Byte | autoavgmaxmin |
Log monitoring classic
| Metric key | Name and description | Unit | Aggregations |
|---|---|---|---|
| builtin:billing | (DPS) Total Log Monitoring Classic billing usage The number of log records ingested aggregated over all monitored entities. A log record is recognized by either a timestamp or a JSON object. Use this total metric to query longer timeframes without losing precision or performance. | Count | autovalue |
| builtin:billing | (DPS) Log Monitoring Classic billing usage by monitored entity The number of log records ingested split by monitored entity. A log record is recognized by either a timestamp or a JSON object. For details on the log path, refer to the usage_by_log_path metric. To improve performance and avoid exceeding query limits when working with longer timeframes, use the total metric. | Count | autovalue |
| builtin:billing | (DPS) Log Monitoring Classic billing usage by log path The number of log records ingested split by log path. A log record is recognized by either a timestamp or a JSON object. For details on the related monitored entities, refer to the usage_by_entity metric. To improve performance and avoid exceeding query limits when working with longer timeframes, use the total metric. | Count | autovalue |
Mainframe monitoring
| Metric key | Name and description | Unit | Aggregations |
|---|---|---|---|
| builtin:billing | (DPS) Mainframe Monitoring billing usage The total number of MSU-hours being monitored, counted in 15 min intervals. | MSU | autovalue |
Real user monitoring
| Metric key | Name and description | Unit | Aggregations |
|---|---|---|---|
| builtin:billing | (DPS) Total Real-User Monitoring Property (mobile) billing usage (Mobile) User action and session properties count. For details on how usage is calculated, refer to the documentation or builtin:billing.real_user_monitoring.web.property.usage_by_application . Use this total metric to query longer timeframes without losing precision or performance. | Count | autovalue |
| builtin:billing | (DPS) Real-User Monitoring Property (mobile) billing usage by application (Mobile) User action and session properties count by application. The billed value is calculated based on the number of sessions reported in builtin:billing.real_user_monitoring.mobile.session.usage_by_app + builtin:billing.real_user_monitoring.mobile.session_with_replay.usage_by_app . plus the number of configured properties that exceed the included number of properties (free of charge) offered for a given application. Data points are only written for billed sessions. If the value is 0, you have available metric data points. This trailing metric is reported hourly for the previous hour. Metric values are reported with up to a one-hour delay. To improve performance and avoid exceeding query limits when working with longer timeframes, use the total metric. | Count | autovalue |
| builtin:billing | (DPS) Total Real-User Monitoring (mobile) billing usage (Mobile) Session count without Session Replay. The value billed for each session is the session duration measured in hours. So a 3-hour session results in a single data-point value of | Count | autovalue |
| builtin:billing | (DPS) Real-User Monitoring (mobile) billing usage by application (Mobile) Session count without Session Replay split by application The value billed for each session is the session duration measured in hours. So a 3-hour session results in a single data-point value of | Count | autovalue |
| builtin:billing | (DPS) Total Real-User Monitoring (mobile) with Session Replay billing usage (Mobile) Session count with Session Replay. The value billed for each session is the session duration measured in hours. So a 3-hour session results in a single data-point value of | Count | autovalue |
| builtin:billing | (DPS) Real-User Monitoring (mobile) with Session Replay billing usage by application (Mobile) Session count with Session Replay split by application. The value billed for each session is the session duration measured in hours. So a 3-hour session results in a single data-point value of | Count | autovalue |
| builtin:billing | (DPS) Total Real-User Monitoring Property (web) billing usage (Web) User action and session properties count. For details on how usage is calculated, refer to the documentation or builtin:billing.real_user_monitoring.web.property.usage_by_application . Use this total metric to query longer timeframes without losing precision or performance. | Count | autovalue |
| builtin:billing | (DPS) Real-User Monitoring Property (web) billing usage by application (Web) User action and session properties count by application. The billed value is calculated based on the number of sessions reported in builtin:billing.real_user_monitoring.web.session.usage_by_app + builtin:billing.real_user_monitoring.web.session_with_replay.usage_by_app . plus the number of configured properties that exceed the included number of properties (free of charge) offered for a given application. Data points are only written for billed sessions. If the value is 0, you have available metric data points. This trailing metric is reported hourly for the previous hour. Metric values are reported with up to a one-hour delay. To improve performance and avoid exceeding query limits when working with longer timeframes, use the total metric. | Count | autovalue |
| builtin:billing | (DPS) Total Real-User Monitoring (web) billing usage (Web) Session count without Session Replay. The value billed for each session is the session duration measured in hours. So a 3-hour session results in a single data-point value of | Count | autovalue |
| builtin:billing | (DPS) Real-User Monitoring (web) billing usage by application (Web) Session count without Session Replay split by application. The value billed for each session is the session duration measured in hours. So a 3-hour session results in a single data-point value of | Count | autovalue |
| builtin:billing | (DPS) Total Real-User Monitoring (web) with Session Replay billing usage (Web) Session count with Session Replay. The value billed for each session is the session duration measured in hours. So a 3-hour session results in a single data-point value of | Count | autovalue |
| builtin:billing | (DPS) Real-User Monitoring (web) with Session Replay billing usage by application (Web) Session count with Session Replay split by application. The value billed for each session is the session duration measured in hours. So a 3-hour session results in a single data-point value of | Count | autovalue |
Runtime application protection
| Metric key | Name and description | Unit | Aggregations |
|---|---|---|---|
| builtin:billing | (DPS) Runtime Application Protection billing usage Total GiB-memory of hosts protected with Runtime Application Protection (Application Security), counted at 15-minute intervals. Use this total metric to query longer timeframes without losing precision or performance. For details on the monitored hosts, refer to the usage_per_host metric. | GibiByte | autovalue |
| builtin:billing | (DPS) Runtime Application Protection billing usage per host GiB-memory per host protected with Runtime Application Protection (Application Security), counted at 15-minute intervals. For example, a host with 8 GiB of RAM monitored for 1 hour has 4 data points with a value of | GibiByte | autovalue |
Runtime vulnerability analytics
| Metric key | Name and description | Unit | Aggregations |
|---|---|---|---|
| builtin:billing | (DPS) Runtime Vulnerability Analytics billing usage Total GiB-memory of hosts protected with Runtime Vulnerability Analytics (Application Security), counted at 15-minute intervals. Use this total metric to query longer timeframes without losing precision or performance. For details on the monitored hosts, refer to the usage_per_host metric. | GibiByte | autovalue |
| builtin:billing | (DPS) Runtime Vulnerability Analytics billing usage per host GiB-memory per hosts protected with Runtime Vulnerability Analytics (Application Security), counted at 15-minute intervals. For example, a host with 8 GiB of RAM monitored for 1 hour has 4 data points with a value of | GibiByte | autovalue |
Serverless functions classic
| Metric key | Name and description | Unit | Aggregations |
|---|---|---|---|
| builtin:billing | (DPS) Total Serverless Functions Classic billing usage The number of invocations of the serverless function aggregated over all monitored entities. The term "function invocations" is equivalent to "function requests" or "function executions". Use this total metric to query longer timeframes without losing precision or performance. | Count | autovalue |
| builtin:billing | (DPS) Serverless Functions Classic billing usage by monitored entity The number of invocations of the serverless function split by monitored entity. The term "function invocations" is equivalent to "function requests" or "function executions". For details on which functions are invoked, refer to the usage_by_function metric. To improve performance and avoid exceeding query limits when working with longer timeframes, use the total metric. | Count | autovalue |
| builtin:billing | (DPS) Serverless Functions Classic billing usage by function The number of invocations of the serverless function split by function. The term "function invocations" is equivalent to "function requests" or "function executions". For details on the related monitored entities, refer to the usage_by_entity metric. To improve performance and avoid exceeding query limits when working with longer timeframes, use the total metric. | Count | autovalue |
Synthetic
| Metric key | Name and description | Unit | Aggregations |
|---|---|---|---|
| builtin:billing | Actions The number of billed actions consumed by browser monitors. | Count | autovalue |
| builtin:billing | (DPS) Total Browser Monitor or Clickpath billing usage The number of synthetic actions which triggers a web request that includes a page load, navigation event, or action that triggers an XHR or Fetch request. Scroll downs, keystrokes, or clicks that don't trigger web requests aren't counted as such actions. Use this total metric to query longer timeframes without losing precision or performance. | Count | autovalue |
| builtin:billing | (DPS) Browser Monitor or Clickpath billing usage per synthetic browser monitor The number of synthetic actions which triggers a web request that includes a page load, navigation event, or action that triggers an XHR or Fetch request. Scroll downs, keystrokes, or clicks that don't trigger web requests aren't counted as such actions. Actions are split by the Synthetic Browser Monitors that caused them. To improve performance and avoid exceeding query limits when working with longer timeframes, use the total metric. | Count | autovalue |
| builtin:billing | Third-party results The number of billed results consumed by third-party monitors. | Count | autovalue |
| builtin:billing | (DPS) Total Third-Party Synthetic API Ingestion billing usage The number of synthetic test results pushed into Dynatrace with Synthetic 3rd party API. Use this total metric to query longer timeframes without losing precision or performance. | Count | autovalue |
| builtin:billing | (DPS) Third-Party Synthetic API Ingestion billing usage per external browser monitor The number of synthetic test results pushed into Dynatrace with Synthetic 3rd party API. The ingestions are split by external Synthetic Browser Monitors for which the results where ingested. To improve performance and avoid exceeding query limits when working with longer timeframes, use the total metric. | Count | autovalue |
| builtin:billing | Requests The number of billed requests consumed by HTTP monitors. | Count | autovalue |
| builtin:billing | (DPS) Total HTTP monitor billing usage The number of HTTP requests performed during execution of synthetic HTTP monitor. Use this total metric to query longer timeframes without losing precision or performance. | Count | autovalue |
| builtin:billing | (DPS) HTTP monitor billing usage per HTTP monitor The number of HTTP requests performed, split by synthetic HTTP monitor. To improve performance and avoid exceeding query limits when working with longer timeframes, use the total metric. | Count | autovalue |
Cloud
AWS
| Metric key | Name and description | Unit | Aggregations |
|---|---|---|---|
| builtin:cloud | Number of running EC2 instances (AZ) | Count | autoavgmaxmin |
Azure
| Metric key | Name and description | Unit | Aggregations |
|---|---|---|---|
| builtin:cloud | Number of starting VMs in region | Count | autoavgmaxmin |
| builtin:cloud | Number of active VMs in region | Count | autoavgmaxmin |
| builtin:cloud | Number of stopped VMs in region | Count | autoavgmaxmin |
| builtin:cloud | Number of starting VMs in scale set | Count | autoavgmaxmin |
| builtin:cloud | Number of active VMs in scale set | Count | autoavgmaxmin |
| builtin:cloud | Number of stopped VMs in scale set | Count | autoavgmaxmin |
Cloud Foundry
| Metric key | Name and description | Unit | Aggregations |
|---|---|---|---|
| builtin:cloud | CF: Time to fetch cell states The time that the auctioneer took to fetch state from all the cells when running its auction. | Nanosecond | autoavgmaxmin |
| builtin:cloud | CF: App instance placement failures The number of application instances that the auctioneer failed to place on Diego cells. | Count | autovalue |
| builtin:cloud | CF: App instance starts The number of application instances that the auctioneer successfully placed on Diego cells. | Count | autovalue |
| builtin:cloud | CF: Task placement failures The number of tasks that the auctioneer failed to place on Diego cells. | Count | autovalue |
| builtin:cloud | CF: 502 responses The number of responses that indicate invalid service responses produced by an application. | Count | autovalue |
| builtin:cloud | CF: Response latency The average response time from the application to clients. | Millisecond | autoavgmaxmin |
| builtin:cloud | CF: 5xx responses The number of responses that indicate repeatedly crashing apps or response issues from applications. | Count | autovalue |
| builtin:cloud | CF: Total requests The number of all requests representing the overall traffic flow. | Count | autovalue |
Openstack
| Metric key | Name and description | Unit | Aggregations |
|---|---|---|---|
| builtin:cloud | CPU usage | Percent (%) | autoavgmaxmin |
| builtin:cloud | Disk allocation | Byte | autoavgmaxmin |
| builtin:cloud | Disk capacity | Byte | autoavgmaxmin |
| builtin:cloud | Memory resident | Byte | autoavgmaxmin |
| builtin:cloud | Memory usage | Byte | autoavgmaxmin |
| builtin:cloud | Network incoming bytes rate | Byte | autoavgmaxmin |
| builtin:cloud | Network outgoing bytes rate | Byte | autoavgmaxmin |
VMware
| Metric key | Name and description | Unit | Aggregations |
|---|---|---|---|
| builtin:cloud | Host CPU usage % | Percent (%) | autoavgmaxmin |
| builtin:cloud | Host disk usage rate | kB | autoavgmaxmin |
| builtin:cloud | Host disk commands aborted | Count | autovalue |
| builtin:cloud | Host disk queue latency | Millisecond | autoavgmaxmin |
| builtin:cloud | Host disk read IOPS | Per second | autoavgmaxmin |
| builtin:cloud | Host disk read latency | Millisecond | autoavgmaxmin |
| builtin:cloud | Host disk read rate | kB | autoavgmaxmin |
| builtin:cloud | Host disk write IOPS | Per second | autoavgmaxmin |
| builtin:cloud | Host disk write latency | Millisecond | autoavgmaxmin |
| builtin:cloud | Host disk write rate | kB | autoavgmaxmin |
| builtin:cloud | Host compression rate | Kibibyte | autoavgmaxmin |
| builtin:cloud | Host memory consumed | Kibibyte | autoavgmaxmin |
| builtin:cloud | Host decompression rate | Kibibyte | autoavgmaxmin |
| builtin:cloud | Host swap in rate | Kibibyte | autoavgmaxmin |
| builtin:cloud | Host swap out rate | Kibibyte | autoavgmaxmin |
| builtin:cloud | Host network data received rate | kB | autoavgmaxmin |
| builtin:cloud | Host network data transmitted rate | kB | autoavgmaxmin |
| builtin:cloud | Data received rate | kB | autoavgmaxmin |
| builtin:cloud | Data transmitted rate | kB | autoavgmaxmin |
| builtin:cloud | Packets received dropped | Count | autovalue |
| builtin:cloud | Packets transmitted dropped | Count | autovalue |
| builtin:cloud | Number of VMs | Count | autoavgmaxmin |
| builtin:cloud | Number of VMs powered-off | Count | autoavgmaxmin |
| builtin:cloud | Number of VMs suspended | Count | autoavgmaxmin |
| builtin:cloud | Host availability % | Percent (%) | autoavg |
| builtin:cloud | VM CPU ready % | Percent (%) | autoavgmaxmin |
| builtin:cloud | VM swap wait | Millisecond | autovalue |
| builtin:cloud | VM CPU usage MHz | Count | autoavgmaxmin |
| builtin:cloud | VM CPU usage % | Percent (%) | autoavgmaxmin |
| builtin:cloud | VM disk usage rate | kB | autoavgmaxmin |
| builtin:cloud | VM memory active | Kibibyte | autoavgmaxmin |
| builtin:cloud | VM compression rate | Kibibyte | autoavgmaxmin |
| builtin:cloud | VM memory consumed | Kibibyte | autoavgmaxmin |
| builtin:cloud | VM decompression rate | Kibibyte | autoavgmaxmin |
| builtin:cloud | VM swap in rate | Kibibyte | autoavgmaxmin |
| builtin:cloud | VM swap out rate | Kibibyte | autoavgmaxmin |
| builtin:cloud | VM network data received rate | kB | autoavgmaxmin |
| builtin:cloud | VM network data transmitted rate | kB | autoavgmaxmin |
Containers
CPU
| Metric key | Name and description | Unit | Aggregations |
|---|---|---|---|
| builtin:containers | Containers: CPU limit, mCores CPU resource limit per container in millicores. | Millicores | autoavgmaxmin |
| builtin:containers | Containers: CPU logical cores Number of logical CPU cores of the host. | Cores | autoavgmaxmin |
| builtin:containers | Containers: CPU shares Number of CPU shares allocated per container. | Count | autoavgmaxmin |
| builtin:containers | Containers: CPU throttling, mCores CPU throttling per container in millicores. | Millicores | autoavgmaxmin |
| builtin:containers | Containers: CPU throttled time, ns/min Total amount of time a container has been throttled, in nanoseconds per minute. | Nanosecond | autoavgmaxmin |
| builtin:containers | Containers: CPU usage, mCores CPU usage per container in millicores | Millicores | autoavgmaxmin |
| builtin:containers | Containers: CPU usage, % of limit Percent CPU usage per container relative to CPU resource limit. Logical cores are used if CPU limit isn't set. | Percent (%) | autoavgmaxmin |
| builtin:containers | Containers: CPU system usage, mCores CPU system usage per container in millicores. | Millicores | autoavgmaxmin |
| builtin:containers | Containers: CPU system usage time, ns/min Used system time per container in nanoseconds per minute. | Nanosecond | autoavgmaxmin |
| builtin:containers | Containers: CPU usage time, ns/min Sum of used system and user time per container in nanoseconds per minute. | Nanosecond | autoavgmaxmin |
| builtin:containers | Containers: CPU user usage, mCores CPU user usage per container in millicores. | Millicores | autoavgmaxmin |
| builtin:containers | Containers: CPU user usage time, ns/min Used user time per container in nanoseconds per minute. | Nanosecond | autoavgmaxmin |
Memory
| Metric key | Name and description | Unit | Aggregations |
|---|---|---|---|
| builtin:containers | Containers: Memory cache, bytes Page cache memory per container in bytes. | Byte | autoavgmaxmin |
| builtin:containers | Containers: Memory limit, bytes Memory limit per container in bytes. If no limit is set, this is an empty value. | Byte | autoavgmaxmin |
| builtin:containers | Containers: Memory limit, % of physical memory Percent memory limit per container relative to total physical memory. If no limit is set, this is an empty value. | Percent (%) | autoavg |
| builtin:containers | Containers: Memory - out of memory kills Number of out of memory kills for a container. | Count | autovalue |
| builtin:containers | Containers: Memory - total physical memory, bytes Total physical memory on the host in bytes. | Byte | autoavgmaxmin |
| builtin:containers | Containers: Memory usage, bytes Resident set size (Linux) or private working set size (Windows) per container in bytes. | Byte | autoavgmaxmin |
| builtin:containers | Containers: Memory usage, % of limit Resident set size (Linux) or private working set size (Windows) per container in percent relative to container memory limit. If no limit is set, this equals total physical memory. | Percent (%) | autoavgmaxmin |
Dashboards
Other dashboards metrics
| Metric key | Name and description | Unit | Aggregations |
|---|---|---|---|
| builtin:dashboards | Dashboard view count | Count | autovalue |
Infrastructure
Availability
| Metric key | Name and description | Unit | Aggregations |
|---|---|---|---|
| builtin:host | Host availability Host availability state metric reported in 1 minute intervals | Count | autovalue |
CPU
| Metric key | Name and description | Unit | Aggregations |
|---|---|---|---|
| builtin:host | z/OS General CPU usage The percent of the general-purpose central processor (GCP) used | Percent (%) | autoavgmaxmin |
| builtin:host | z/OS Rolling 4 hour MSU average The 4h average of consumed million service units on this LPAR | MSU | autoavgmaxmin |
| builtin:host | z/OS MSU capacity The over all capacity of million service units on this LPAR | MSU | autoavgmaxmin |
| builtin:host | z/OS zIIP eligible time The zIIP eligible time spent on the general-purpose central processor (GCP) after process start per minute | Second | autoavgcountmaxminsum |
| builtin:host | AIX Entitlement configured Capacity Entitlement is the number of virtual processors assigned to the AIX partition. It's measured in fractions of processor equal to 0.1 or 0.01. For more information about entitlement, see Assigning the appropriate processor entitled capacity in official IBM documentation. | Ratio | autoavgmaxmin |
| builtin:host | AIX Entitlement used Percentage of entitlement used. Capacity Entitlement is the number of virtual cores assigned to the AIX partition. See for more information about entitlement, see Assigning the appropriate processor entitled capacity in official IBM documentation. | Percent (%) | autoavgmaxmin |
| builtin:host | CPU idle Average CPU time, when the CPU didn't have anything to do | Percent (%) | autoavgmaxmin |
| builtin:host | CPU I/O wait Percentage of time when CPU was idle during which the system had an outstanding I/O request. It is not available on Windows. | Percent (%) | autoavgmaxmin |
| builtin:host | System load The average number of processes that are being executed by CPU or waiting to be executed by CPU over the last minute | Ratio | autoavgmaxmin |
| builtin:host | System load15m The average number of processes that are being executed by CPU or waiting to be executed by CPU over the last 15 minutes | Ratio | autoavgmaxmin |
| builtin:host | System load5m The average number of processes that are being executed by CPU or waiting to be executed by CPU over the last 5 minutes | Ratio | autoavgmaxmin |
| builtin:host | CPU other Average CPU time spent on other tasks: servicing interrupt requests (IRQ), running virtual machines under the control of the host's kernel (meaning the host is a hypervisor for VMs). It's available only for Linux hosts | Percent (%) | autoavgmaxmin |
| builtin:host | AIX Physical consumed Total CPUs consumed by the AIX partition | Ratio | autoavgmaxmin |
| builtin:host | CPU steal Average CPU time, when a virtual machine waits to get CPU cycles from the hypervisor. In a virtual environment, CPU cycles are shared across virtual machines on the hypervisor server. If your virtualized host displays a high CPU steal, it means CPU cycles are being taken away from your virtual machine to serve other purposes. It may indicate an overloaded hypervisor. It's available only for Linux hosts | Percent (%) | autoavgmaxmin |
| builtin:host | CPU system Average CPU time when CPU was running in kernel mode | Percent (%) | autoavgmaxmin |
| builtin:host | CPU usage % Percentage of CPU time when CPU was utilized. A value close to 100% means most host processing resources are in use, and host CPUs can't handle additional work | Percent (%) | autoavgmaxmin |
| builtin:host | CPU user Average CPU time when CPU was running in user mode | Percent (%) | autoavgmaxmin |
DNS
| Metric key | Name and description | Unit | Aggregations |
|---|---|---|---|
| builtin:host | Number of DNS errors by type Number of DNS errors by type | Count | autoavgcountmaxminsum |
| builtin:host | Number of orphaned DNS responses Number of orphaned DNS responses on the host | Count | autoavgcountmaxminsum |
| builtin:host | Number of DNS queries Number of DNS queries on the host | Count | autoavgcountmaxminsum |
| builtin:host | DNS query time sum The time of all DNS queries on the host | Millisecond | autoavgcountmaxminsum |
| builtin:host | DNS query time Average time of DNS query. Calculated with DNS query time sum divided by number of DNS queries for each host and DNS server pair. | Millisecond | autoavgmaxmin |
| builtin:host | DNS query time by DNS server The weighted average time of DNS query by DNS server ip. Calculated with DNS query time sum divided by number of DNS queries. It weights the result taking into account number of requests from each host. | Millisecond | autoavgmaxmin |
| builtin:host | DNS query time on host The weighted average time of DNS query on a host. Calculated with DNS query time sum divided by number of DNS queries on a host. It weights the result taking into account number of requests to each dns server | Millisecond | autoavgmaxmin |
Disk
| Metric key | Name and description | Unit | Aggregations |
|---|---|---|---|
| builtin:host | Disk throughput read File system read throughput in bits per second | bit | autoavgmaxmin |
| builtin:host | Disk throughput write File system write throughput in bits per second | bit | autoavgmaxmin |
| builtin:host | Disk available Amount of free space available for user in file system. On Linux and AIX it is free space available for unprivileged user. It doesn't contain part of free space reserved for the root. | Byte | autoavgmaxmin |
| builtin:host | Disk read bytes per second Speed of read from file system in bytes per second | Byte | autoavgmaxmin |
| builtin:host | Disk write bytes per second Speed of write to file system in bytes per second | Byte | autoavgmaxmin |
| builtin:host | Disk available % Percentage of free space available for user in file system. On Linux and AIX it is % of free space available for unprivileged user. It doesn't contain part of free space reserved for the root. | Percent (%) | autoavgmaxmin |
| builtin:host | Inodes available % Percentage of free inodes available for unprivileged user in file system. Metric not available on Windows. | Percent (%) | autoavgmaxmin |
| builtin:host | Inodes total Total amount of inodes available for unprivileged user in file system. Metric not available on Windows. | Count | autoavgmaxmin |
| builtin:host | Disk average queue length Average number of read and write operations in disk queue | Count | autoavgmaxmin |
| builtin:host | Disk read operations per second Number of read operations from file system per second | Per second | autoavgmaxmin |
| builtin:host | Disk read time Average time of read from file system. It shows average disk latency during read. | Millisecond | autoavgcountmaxminsum |
| builtin:host | Disk used Amount of used space in file system | Byte | autoavgmaxmin |
| builtin:host | Disk used % Percentage of used space in file system | Percent (%) | autoavgmaxmin |
| builtin:host | Disk utilization time Percent of time spent on disk I/O operations | Percent (%) | autoavgmaxmin |
| builtin:host | Disk write operations per second Number of write operations to file system per second | Per second | autoavgmaxmin |
| builtin:host | Disk write time Average time of write to file system. It shows average disk latency during write. | Millisecond | autoavgcountmaxminsum |
Handles
| Metric key | Name and description | Unit | Aggregations |
|---|---|---|---|
| builtin:host | File descriptors max Maximum amount of file descriptors for use | Count | autoavgmaxmin |
| builtin:host | File descriptors used Amount of file descriptors used | Count | autoavgmaxmin |
Kernel threads
| Metric key | Name and description | Unit | Aggregations |
|---|---|---|---|
| builtin:host | AIX Kernel threads blocked Length of the swap queue. The swap queue contains the threads ready to run but swapped out with the currently running threads | Count | autoavgmaxmin |
| builtin:host | AIX Kernel threads I/O event wait Number of threads that are waiting for file system direct (cio) + Number of processes that are asleep waiting for buffered I/O | Count | autoavgmaxmin |
| builtin:host | AIX Kernel threads I/O message wait Number of threads that are sleeping and waiting for raw I/O operations at a particular time. Raw I/O operation allows applications to direct write to the Logical Volume Manager (LVM) layer | Count | autoavgmaxmin |
| builtin:host | AIX Kernel threads runnable Number of runnable threads (running or waiting for run time) (threads ready). The average number of runnable threads is seen in the first column of the vmstat command output | Count | autoavgmaxmin |
Memory
| Metric key | Name and description | Unit | Aggregations |
|---|---|---|---|
| builtin:host | Memory available The amount of memory (RAM) available on the host. The memory that is available for allocation to new or existing processes. Available memory is an estimation of how much memory is available for use without swapping. | Byte | autoavgmaxmin |
| builtin:host | Memory available % The percentage of memory (RAM) available on the host. The memory that is available for allocation to new or existing processes. Available memory is an estimation of how much memory is available for use without swapping. Shows available memory as percentages. | Percent (%) | autoavgmaxmin |
| builtin:host | Page faults per second The measure of the number of page faults per second on the monitored host. This value includes soft faults and hard faults. | Per second | autoavgmaxmin |
| builtin:host | Swap available The amount of swap memory or swap space (also known as paging, which is the on-disk component of the virtual memory system) available. | Byte | autoavgmaxmin |
| builtin:host | Swap total Amount of total swap memory or total swap space (also known as paging, which is the on-disk component of the virtual memory system) for use. | Byte | autovalue |
| builtin:host | Swap used The amount of swap memory or swap space (also known as paging, which is the on-disk component of the virtual memory system) used. | Byte | autoavgmaxmin |
| builtin:host | Kernel memory The memory used by the system kernel. It includes memory used by core components of OS along with any device drivers. Typically, the number will be very small. | Byte | autoavgmaxmin |
| builtin:host | Memory reclaimable The memory usage for specific purposes. Reclaimable memory is calculated as available memory (estimation of how much memory is available for use without swapping) minus free memory (amount of memory that is currently not used for anything). For more information on reclaimable memory, see this blog post. | Byte | autoavgmaxmin |
| builtin:host | Memory total The amount of memory (RAM) installed on the system. | Byte | autovalue |
| builtin:host | Memory used % Shows percentage of memory currently used. Used memory is calculated by OneAgent as follows: used = total - available. So the used memory metric displayed in Dynatrace analysis views is not equal to the used memory metric displayed by system tools. At the same time, it's important to remember that system tools report used memory the way they do due to historical reasons, and that this particular method of calculating used memory isn't really representative of how the Linux kernel manages memory in modern systems. The difference in these measurements is in fact quite significant, too. Note: Calculated by taking 100% - "Memory available %". | Percent (%) | autoavgmaxmin |
| builtin:host | Memory used Used memory is calculated by OneAgent as follows: used = total - available. So the used memory metric displayed in Dynatrace analysis views is not equal to the used memory metric displayed by system tools. At the same time, it's important to remember that system tools report used memory the way they do due to historical reasons, and that this particular method of calculating used memory isn't really representative of how the Linux kernel manages memory in modern systems. The difference in these measurements is in fact quite significant, too. | Byte | autoavgmaxmin |
Network
| Metric key | Name and description | Unit | Aggregations |
|---|---|---|---|
| builtin:host | NIC packets dropped Network interface packets dropped on the host | Per second | autovalue |
| builtin:host | NIC received packets dropped Network interface received packets dropped on the host | Per second | autoavgmaxmin |
| builtin:host | NIC sent packets dropped Network interface sent packets dropped on the host | Per second | autoavgmaxmin |
| builtin:host | NIC packet errors Network interface packet errors on the host | Per second | autovalue |
| builtin:host | NIC received packet errors Network interface received packet errors on a host | Per second | autoavgmaxmin |
| builtin:host | NIC sent packet errors Network interface sent packet errors on the host | Per second | autoavgmaxmin |
| builtin:host | NIC packets received Network interface packets received on the host | Per second | autoavgmaxmin |
| builtin:host | NIC packets sent Network interface packets sent on the host | Per second | autoavgmaxmin |
| builtin:host | NIC bytes received Network interface bytes received on the host | Byte | autoavgmaxmin |
| builtin:host | NIC bytes sent on host Network interface bytes sent on the host | Byte | autoavgmaxmin |
| builtin:host | NIC connectivity Network interface connectivity on the host | Percent (%) | autoavgmaxmin |
| builtin:host | NIC receive link utilization Network interface receive link utilization on the host | Percent (%) | autoavgmaxmin |
| builtin:host | NIC transmit link utilization Network interface transmit link utilization on the host | Percent (%) | autoavgmaxmin |
| builtin:host | NIC retransmission Network interface retransmission on the host | Percent (%) | autoavgmaxmin |
| builtin:host | NIC received packets retransmission Network interface retransmission for received packets on the host | Percent (%) | autoavgmaxmin |
| builtin:host | NIC sent packets retransmission Network interface retransmission for sent packets on the host | Percent (%) | autoavgmaxmin |
| builtin:host | Traffic Network traffic on the host | bit | autovalue |
| builtin:host | Traffic in Traffic incoming at the host | bit | autoavgmaxmin |
| builtin:host | Traffic out Traffic outgoing from the host | bit | autoavgmaxmin |
| builtin:host | Host retransmission base received Host aggregated process retransmission base received per second | Per second | autoavgmaxmin |
| builtin:host | Host retransmission base sent Host aggregated process retransmission base sent per second | Per second | autoavgmaxmin |
| builtin:host | Host retransmitted packets received Host aggregated process retransmitted packets received per second | Per second | autoavgmaxmin |
| builtin:host | Host retransmitted packets sent Host aggregated process retransmitted packets sent per second | Per second | autoavgmaxmin |
| builtin:host | Localhost session reset received Host aggregated session reset received per second on localhost | Per second | autoavgmaxmin |
| builtin:host | Localhost session timeout received Host aggregated session timeout received per second on localhost | Per second | autoavgmaxmin |
| builtin:host | Localhost new session received Host aggregated new session received per second on localhost | Per second | autoavgmaxmin |
| builtin:host | Host session reset received Host aggregated process session reset received per second | Per second | autoavgmaxmin |
| builtin:host | Host session timeout received Host aggregated process session timeout received per second | Per second | autoavgmaxmin |
| builtin:host | Host new session received Host aggregated process new session received per second | Per second | autoavgmaxmin |
| builtin:host | Host bytes received Host aggregated process bytes received per second | Byte | autoavgmaxmin |
| builtin:host | Host bytes sent Host aggregated process bytes sent per second | Byte | autoavgmaxmin |
OS service
| Metric key | Name and description | Unit | Aggregations |
|---|---|---|---|
| builtin:host | OS Service availability This metric provides the status of the OS service. If the OS service is running, the OS module is reporting "1" as a value of the metric. In any other case, the metric has a value of "0"Note that this metric provides data only from Classic Windows services monitoring (supported only on Windows), currently replaced by the new OS Services monitoring. To learn more, see Classic Windows services monitoring. | Count | autoavgmaxmin |
Processes
| Metric key | Name and description | Unit | Aggregations |
|---|---|---|---|
| builtin:host | OS Process count This metric shows an average number of processes, over one minute, running on the host. The reported number of processes is based on processes detected by the OS module, read in 10 seconds cycles. | Count | autoavgmaxmin |
| builtin:host | PGI count This metric shows the number of PGIs created by the OS module every minute. It includes every PGI, even those which are considered not important and are not reported to Dynatrace. | Count | autoavgmaxmin |
| builtin:host | Reported PGI count This metric shows the number of PGIs created and reported by the OS module every minute. It includes only PGIs, which are considered important and reported to Dynatrace. Important PGIs are those in which OneAgent recognizes the technology, have open network ports, generate significant resource usage, or are created via Declarative process grouping rules. To learn what makes process important, see Which are the most important processes? | Count | autoavgmaxmin |
z/OS
| Metric key | Name and description | Unit | Aggregations |
|---|---|---|---|
| builtin:host | z/OS General CPU time Total General CPU time per minute | Count | autoavgcountmaxminsum |
| builtin:host | z/OS Consumed MSUs per SMF interval (SMF70EDT) Number of consumed MSUs per SMF interval (SMF70EDT) | Count | autoavgcountmaxminsum |
| builtin:host | z/OS zIIP time Total zIIP time per minute | Count | autoavgcountmaxminsum |
| builtin:host | z/OS zIIP usage Actively used zIIP as a percentage of available zIIP | Count | autoavgcountmaxminsum |
Other infrastructure metrics
| Metric key | Name and description | Unit | Aggregations |
|---|---|---|---|
| builtin:host | Availability rate Operational Availability Metric for Hosts | Percent (%) | autoavg |
| builtin:host | Host uptime Time since last host boot up. Requires OneAgent 1.259+. The metric is not supported for application-only OneAgent deployments. | Second | autoavgmaxmin |
Kubernetes
Cluster
| Metric key | Name and description | Unit | Aggregations |
|---|---|---|---|
| builtin:kubernetes | Kubernetes: Cluster readyz status Current status of the Kubernetes API server reported by the /readyz endpoint (0 or 1). | autoavgmaxmin |
Container
| Metric key | Name and description | Unit | Aggregations |
|---|---|---|---|
| builtin:kubernetes | Kubernetes: Container - out of memory (OOM) kill count This metric measures the out of memory (OOM) kills. The most detailed level of aggregation is container. The value corresponds to the status 'OOMKilled' of a container in the pod resource's container status. The metric is only written if there was at least one container OOM kill. | Count | autovalue |
| builtin:kubernetes | Kubernetes: Container - restart count This metric measures the amount of container restarts. The most detailed level of aggregation is container. The value corresponds to the delta of the 'restartCount' defined in the pod resource's container status. The metric is only written if there was at least one container restart. | Count | autovalue |
Node
| Metric key | Name and description | Unit | Aggregations |
|---|---|---|---|
| builtin:kubernetes | Kubernetes: Node conditions This metric describes the status of a Kubernetes node. The most detailed level of aggregation is node. | Count | autoavgmaxmin |
| builtin:kubernetes | Kubernetes: Node - CPU allocatable This metric measures the total allocatable cpu. The most detailed level of aggregation is node. The value corresponds to the allocatable cpu of a node. | Millicores | autoavgmaxmin |
| builtin:kubernetes | Kubernetes: Container - CPU throttled (by node) This metric measures the total CPU throttling by container. The most detailed level of aggregation is node. | Millicores | autoavgmaxmin |
| builtin:kubernetes | Kubernetes: Container - CPU usage (by node) This metric measures the total CPU consumed (user usage + system usage) by container. The most detailed level of aggregation is node. | Millicores | autoavgmaxmin |
| builtin:kubernetes | Kubernetes: Pod - CPU limits (by node) This metric measures the cpu limits. The most detailed level of aggregation is node. The value is the sum of the cpu limits of all app containers of a pod. | Millicores | autoavgmaxmin |
| builtin:kubernetes | Kubernetes: Pod - memory limits (by node) This metric measures the memory limits. The most detailed level of aggregation is node. The value is the sum of the memory limits of all app containers of a pod. | Byte | autoavgmaxmin |
| builtin:kubernetes | Kubernetes: Node - memory allocatable This metric measures the total allocatable memory. The most detailed level of aggregation is node. The value corresponds to the allocatable memory of a node. | Byte | autoavgmaxmin |
| builtin:kubernetes | Kubernetes: Container - Working set memory (by node) This metric measures the current working set memory (memory that cannot be reclaimed under pressure) by container. The OOM Killer is invoked if the working set exceeds the limit. The most detailed level of aggregation is node. | Byte | autoavgmaxmin |
| builtin:kubernetes | Kubernetes: Pod count (by node) This metric measures the number of pods. The most detailed level of aggregation is node. The value corresponds to the count of all pods. | Count | autoavgmaxmin |
| builtin:kubernetes | Kubernetes: Node - pod allocatable count This metric measures the total number of allocatable pods. The most detailed level of aggregation is node. The value corresponds to the allocatable pods of a node. | Count | autoavgmaxmin |
| builtin:kubernetes | Kubernetes: Pod - CPU requests (by node) This metric measures the cpu requests. The most detailed level of aggregation is node. The value is the sum of the cpu requests of all app containers of a pod. | Millicores | autoavgmaxmin |
| builtin:kubernetes | Kubernetes: Pod - memory requests (by node) This metric measures the memory requests. The most detailed level of aggregation is node. The value is the sum of the memory requests of all app containers of a pod. | Byte | autoavgmaxmin |
Persistentvolumeclaim
| Metric key | Name and description | Unit | Aggregations |
|---|---|---|---|
| builtin:kubernetes | Kubernetes: PVC - available This metric measures the number of available bytes in the volume. The most detailed level of aggregation is persistent volume claim. | Byte | autoavgmaxmin |
| builtin:kubernetes | Kubernetes: PVC - capacity This metric measures the capacity in bytes of the volume. The most detailed level of aggregation is persistent volume claim. | Byte | autoavgmaxmin |
| builtin:kubernetes | Kubernetes: PVC - used This metric measures the number of used bytes in the volume. The most detailed level of aggregation is persistent volume claim. | Byte | autoavgmaxmin |
Resource Quota
| Metric key | Name and description | Unit | Aggregations |
|---|---|---|---|
| builtin:kubernetes | Kubernetes: Resource quota - CPU limits This metric measures the cpu limit quota. The most detailed level of aggregation is resource quota. The value corresponds to the cpu limits of a resource quota. | Millicores | autoavgmaxmin |
| builtin:kubernetes | Kubernetes: Resource quota - CPU limits used This metric measures the used cpu limit quota. The most detailed level of aggregation is resource quota. The value corresponds to the used cpu limits of a resource quota. | Millicores | autoavgmaxmin |
| builtin:kubernetes | Kubernetes: Resource quota - memory limits This metric measures the memory limit quota. The most detailed level of aggregation is resource quota. The value corresponds to the memory limits of a resource quota. | Byte | autoavgmaxmin |
| builtin:kubernetes | Kubernetes: Resource quota - memory limits used This metric measures the used memory limits quota. The most detailed level of aggregation is resource quota. The value corresponds to the used memory limits of a resource quota. | Byte | autoavgmaxmin |
| builtin:kubernetes | Kubernetes: Resource quota - pod count This metric measures the pods quota. The most detailed level of aggregation is resource quota. The value corresponds to the pods of a resource quota. | Count | autoavgmaxmin |
| builtin:kubernetes | Kubernetes: Resource quota - pod used count This metric measures the used pods quota. The most detailed level of aggregation is resource quota. The value corresponds to the used pods of a resource quota. | Count | autoavgmaxmin |
| builtin:kubernetes | Kubernetes: Resource quota - CPU requests This metric measures the cpu requests quota. The most detailed level of aggregation is resource quota. The value corresponds to the cpu requests of a resource quota. | Millicores | autoavgmaxmin |
| builtin:kubernetes | Kubernetes: Resource quota - CPU requests used This metric measures the used cpu requests quota. The most detailed level of aggregation is resource quota. The value corresponds to the used cpu requests of a resource quota. | Millicores | autoavgmaxmin |
| builtin:kubernetes | Kubernetes: Resource quota - memory requests This metric measures the memory requests quota. The most detailed level of aggregation is resource quota. The value corresponds to the memory requests of a resource quota. | Byte | autoavgmaxmin |
| builtin:kubernetes | Kubernetes: Resource quota - memory requests used This metric measures the used memory requests quota. The most detailed level of aggregation is resource quota. The value corresponds to the used memory requests of a resource quota. | Byte | autoavgmaxmin |
Workload
| Metric key | Name and description | Unit | Aggregations |
|---|---|---|---|
| builtin:kubernetes | Kubernetes: Workload conditions This metric describes the status of a Kubernetes workload. The most detailed level of aggregation is workload. | Count | autoavgmaxmin |
| builtin:kubernetes | Kubernetes: Pod - desired container count This metric measures the number of desired containers. The most detailed level of aggregation is workload. The value is the count of all containers in the pod's specification. | Count | autoavgmaxmin |
| builtin:kubernetes | Kubernetes: Container - CPU throttled (by workload) This metric measures the total CPU throttling by container. The most detailed level of aggregation is workload. | Millicores | autoavgmaxmin |
| builtin:kubernetes | Kubernetes: Container - CPU usage (by workload) This metric measures the total CPU consumed (user usage + system usage) by container. The most detailed level of aggregation is workload. | Millicores | autoavgmaxmin |
| builtin:kubernetes | Kubernetes: Pod - CPU limits (by workload) This metric measures the cpu limits. The most detailed level of aggregation is workload. The value is the sum of the cpu limits of all app containers of a pod. | Millicores | autoavgmaxmin |
| builtin:kubernetes | Kubernetes: Pod - memory limits (by workload) This metric measures the memory limits. The most detailed level of aggregation is workload. The value is the sum of the memory limits of all app containers of a pod. | Byte | autoavgmaxmin |
| builtin:kubernetes | [Deprecated] Kubernetes: Container - Memory RSS (by workload) This metric measures the true resident set size (RSS) by container. RSS is the amount of physical memory used by the container's cgroup - either total_rss + total_mapped_file (cgroup v1) or anon + file_mapped (cgroup v2). The most detailed level of aggregation is workload. Deprecated - use builtin:kubernetes.workload.memory_working_set instead. | Byte | autoavgmaxmin |
| builtin:kubernetes | Kubernetes: Container - Working set memory (by workload) This metric measures the current working set memory (memory that cannot be reclaimed under pressure) by container. The OOM Killer is invoked if the working set exceeds the limit. The most detailed level of aggregation is workload. | Byte | autoavgmaxmin |
| builtin:kubernetes | Kubernetes: Workload - desired pod count This metric measures the number of desired pods. The most detailed level of aggregation is workload. The value corresponds to the 'replicas' defined in a deployment resource and to the 'desiredNumberScheduled' for a daemon set resource's status as example. | Count | autoavgmaxmin |
| builtin:kubernetes | Kubernetes: Pod - CPU requests (by workload) This metric measures the cpu requests. The most detailed level of aggregation is workload. The value is the sum of the cpu requests of all app containers of a pod. | Millicores | autoavgmaxmin |
| builtin:kubernetes | Kubernetes: Pod - memory requests (by workload) This metric measures the memory requests. The most detailed level of aggregation is workload. The value is the sum of the memory requests of all app containers of a pod. | Byte | autoavgmaxmin |
Other kubernetes metrics
| Metric key | Name and description | Unit | Aggregations |
|---|---|---|---|
| builtin:kubernetes | Kubernetes: Container count This metric measures the number of containers. The most detailed level of aggregation is workload. The metric counts the number of all containers. | Count | autoavgmaxmin |
| builtin:kubernetes | Kubernetes: Event count This metric counts Kubernetes events. The most detailed level of aggregation is the event reason. The value corresponds to the count of events returned by the Kubernetes events endpoint. This metric depends on Kubernetes event monitoring. It will not show any datapoints for the period in which event monitoring is deactivated. | Count | autovalue |
| builtin:kubernetes | Kubernetes: Node count This metric measures the number of nodes. The most detailed level of aggregation is cluster. The value is the count of all nodes. | Count | autoavgmaxmin |
| builtin:kubernetes | Kubernetes: Pod count (by workload) This metric measures the number of pods. The most detailed level of aggregation is workload. The value corresponds to the count of all pods. | Count | autoavgmaxmin |
| builtin:kubernetes | Kubernetes: Workload count This metric measures the number of workloads. The most detailed level of aggregation is namespace. The value corresponds to the count of all workloads. | Count | autoavgmaxmin |
Process
Availability
| Metric key | Name and description | Unit | Aggregations |
|---|---|---|---|
| builtin:pgi | Process availability Process availability state metric reported in 1 minute intervals | Count | autovalue |
Other process metrics
| Metric key | Name and description | Unit | Aggregations |
|---|---|---|---|
| builtin:pgi | Process Availability rate Operational Availability Metric for PGIs | Percent (%) | autoavg |
Process
Other process metrics
| Metric key | Name and description | Unit | Aggregations |
|---|---|---|---|
| builtin:process | Process traffic in This metric provides size of incoming traffic of a process. It helps to identify processes generating high network traffic on a host. The result is expressed in kilobytes. It has a "PID" (process.pid), "Parent PID" (process.parent_pid), "process owner" (process.owner), "process executable name" (process.executable.name), "process executable path" (process.executable.path), "process command line" (process.command_line) and "Process group instance" (dt.entity.process_group_instance) dimensions This metric is collected only if the Process instance snapshot feature is turned on and triggered, and the time this metric is collected for is restricted to feature limits. To learn more, see Process instance snapshots. | kB | autoavgcountmaxminsum |
| builtin:process | Process traffic out This metric provides size of outgoing traffic of a process. It helps to identify processes generating high network traffic on a host. The result is expressed in kilobytes. It has a "PID" (process.pid), "Parent PID" (process.parent_pid), "process owner" (process.owner), "process executable name" (process.executable.name), "process executable path" (process.executable.path), "process command line" (process.command_line) and "Process group instance" (dt.entity.process_group_instance) dimensions This metric is collected only if the Process instance snapshot feature is turned on and triggered, and the time this metric is collected for is restricted to feature limits. To learn more, see Process instance snapshots. | kB | autoavgcountmaxminsum |
| builtin:process | Process average CPU This metric provides the percentage of the CPU usage of a process. The metric value is the sum of CPU time every process worker uses divided by the total available CPU time. The result is expressed in percentage. A value of 100% indicates that the process uses all available CPU resources of the host. It has a "PID" (process.pid), "Parent PID" (process.parent_pid), "process owner" (process.owner), "process executable name" (process.executable.name), "process executable path" (process.executable.path), "process command line" (process.command_line) and "Process group instance" (dt.entity.process_group_instance) dimensions. This metric is collected only if the Process instance snapshot feature is turned on and triggered, and the time this metric is collected for is restricted to feature limits. To learn more, see Process instance snapshots. | Percent (%) | autoavgcountmaxminsum |
| builtin:process | Process memory This metric provides the memory usage of a process. It helps to identify processes with high memory resource consumption and memory leaks. The result is expressed in bytes. It has a "PID" (process.pid), "Parent PID" (process.parent_pid), "process owner" (process.owner), "process executable name" (process.executable.name), "process executable path" (process.executable.path), "process command line" (process.command_line) and "Process group instance" (dt.entity.process_group_instance) dimensions This metric is collected only if the Process instance snapshot feature is turned on and triggered, and the time this metric is collected for is restricted to feature limits. To learn more, see Process instance snapshots. | Byte | autoavgcountmaxminsum |
Queue
Other queue metrics
| Metric key | Name and description | Unit | Aggregations |
|---|---|---|---|
| builtin:queue | Incoming messages The number of incoming messages on the queue or topic | Count | autoavgcountmaxminsum |
| builtin:queue | Outgoing messages The number of outgoing messages from the queue or topic | Count | autoavgcountmaxminsum |
Security
Attack
| Metric key | Name and description | Unit | Aggregations |
|---|---|---|---|
| builtin:security | New attacks Number of attacks that were recently created. The metric supports the management zone selector. | Count | autovalue |
Security problems
| Metric key | Name and description | Unit | Aggregations |
|---|---|---|---|
| builtin:security | New Muted Security Problems (global) Number of vulnerabilities that were recently muted. The metric value is independent of any configured management zone (and thus global). | Count | autovalue |
| builtin:security | New Open Security Problems (global) Number of vulnerabilities that were recently created. The metric value is independent of any configured management zone (and thus global). | Count | autovalue |
| builtin:security | New Open Security Problems (split by Management Zone) Number of vulnerabilities that were recently created. The metric value is split by management zone. | Count | autovalue |
| builtin:security | Open Security Problems (global) Number of currently open vulnerabilities seen within the last minute. The metric value is independent of any configured management zone (and thus global). | Count | autoavgmaxmin |
| builtin:security | Open Security Problems (split by Management Zone) Number of currently open vulnerabilities seen within the last minute. The metric value is split by management zone. | Count | autoavgmaxmin |
| builtin:security | New Resolved Security Problems (global) Number of vulnerabilities that were recently resolved. The metric value is independent of any configured management zone (and thus global). | Count | autovalue |
Vulnerabilities
| Metric key | Name and description | Unit | Aggregations |
|---|---|---|---|
| builtin:security | Vulnerabilities - affected process groups count (global) Total number of unique affected process groups across all open vulnerabilities per technology. The metric value is independent of any configured management zone (and thus global). | Count | autoavgmaxmin |
| builtin:security | Vulnerabilities - affected not-muted process groups count (global) Total number of unique affected process groups across all open, unmuted vulnerabilities per technology. The metric value is independent of any configured management zone (and thus global). | Count | autoavgmaxmin |
| builtin:security | Vulnerabilities - affected entities count Total number of unique affected entities across all open vulnerabilities. The metric supports the management zone selector. | Count | autovalue |
Services
CPU
| Metric key | Name and description | Unit | Aggregations |
|---|---|---|---|
| builtin:service | CPU time CPU time consumed by a particular request. To learn how Dynatrace calculates service timings, see Service analysis timings. | Microsecond | autoavgcountmaxminsum |
| builtin:service | Service CPU time CPU time consumed by a particular service. To learn how Dynatrace calculates service timings, see Service analysis timings. | Microsecond | autovalue |
Database connections
| Metric key | Name and description | Unit | Aggregations |
|---|---|---|---|
| builtin:service | Failed connections Unsuccessful connection attempts compared to all connection attempts. To learn about database analysis, see Analyze database services. | Count | autovalue |
| builtin:service | Connection failure rate Rate of unsuccessful connection attempts compared to all connection attempts. To learn about database analysis, see Analyze database services. | Percent (%) | autovalue |
| builtin:service | Successful connections Total number of database connections successfully established by this service. To learn about database analysis, see Analyze database services. | Count | autovalue |
| builtin:service | Connection success rate Rate of successful connection attempts compared to all connection attempts. To learn about database analysis, see Analyze database services. | Percent (%) | autovalue |
| builtin:service | Total number of connections Total number of database connections that were attempted to be established by this service. To learn about database analysis, see Analyze database services. | Count | autovalue |
Errors
| Metric key | Name and description | Unit | Aggregations |
|---|---|---|---|
| builtin:service | Number of client side errors Failed requests for a service measured on client side. To learn about failure detection, see Configure service failure detection. | Count | autovalue |
| builtin:service | Failure rate (client side errors) | Percent (%) | autoavg |
| builtin:service | Number of calls without client side errors | Count | autovalue |
| builtin:service | Number of HTTP 5xx errors HTTP requests with a status code between 500 and 599 for a given key request measured on server side. To learn about failure detection, see Configure service failure detection. | Count | autovalue |
| builtin:service | Failure rate (HTTP 5xx errors) | Percent (%) | autoavg |
| builtin:service | Number of calls without HTTP 5xx errors | Count | autovalue |
| builtin:service | Number of HTTP 4xx errors HTTP requests with a status code between 400 and 499 for a given key request measured on server side. To learn about failure detection, see Configure service failure detection. | Count | autovalue |
| builtin:service | Failure rate (HTTP 4xx errors) | Percent (%) | autoavg |
| builtin:service | Number of calls without HTTP 4xx errors | Count | autovalue |
| builtin:service | Number of server side errors Failed requests for a service measured on server side. To learn about failure detection, see Configure service failure detection. | Count | autovalue |
| builtin:service | Failure rate (server side errors) | Percent (%) | autoavg |
| builtin:service | Number of calls without server side errors | Count | autovalue |
| builtin:service | Number of any errors Failed requests for a service measured on server side or client side. To learn about failure detection, see Configure service failure detection. | Count | autovalue |
| builtin:service | Failure rate (any errors) | Percent (%) | autoavg |
| builtin:service | Number of calls without any errors | Count | autovalue |
Key requests
| Metric key | Name and description | Unit | Aggregations |
|---|---|---|---|
| builtin:service | Request count - client Number of requests for a given key request - measured on the client side. This metric is written for each key request. To learn more about key requests, see Monitor key request. | Count | autovalue |
| builtin:service | Request count - server Number of requests for a given key request - measured on the server side. This metric is written for each key request. To learn more about key requests, see Monitor key request. | Count | autovalue |
| builtin:service | Request count Number of requests for a given key request. This metric is written for each key request. To learn more about key requests, see Monitor key request. | Count | autovalue |
| builtin:service | CPU per request CPU time for a given key request. This metric is written for each key request. To learn more about key requests, see Monitor key request. | Microsecond | autoavgcountmaxminsum |
| builtin:service | Service key request CPU time CPU time for a given key request. This metric is written for each key request. To learn more about key requests, see Monitor key request. | Microsecond | autoavgcountmaxminsum |
| builtin:service | Number of client side errors Failed requests for a given key request measured on client side. To learn about failure detection, see Configure service failure detection. | Count | autovalue |
| builtin:service | Failure rate (client side errors) | Percent (%) | autoavg |
| builtin:service | Number of calls without client side errors | Count | autovalue |
| builtin:service | Number of HTTP 5xx errors Rate of HTTP requests with a status code between 500 and 599 of a given key request. To learn about failure detection, see Configure service failure detection. | Count | autovalue |
| builtin:service | Failure rate (HTTP 5xx errors) | Percent (%) | autoavg |
| builtin:service | Number of calls without HTTP 5xx errors | Count | autovalue |
| builtin:service | Number of HTTP 4xx errors Rate of HTTP requests with a status code between 400 and 499 of a given key request. To learn about failure detection, see Configure service failure detection. | Count | autovalue |
| builtin:service | Failure rate (HTTP 4xx errors) | Percent (%) | autoavg |
| builtin:service | Number of calls without HTTP 4xx errors | Count | autovalue |
| builtin:service | Number of server side errors Failed requests for a given key request measured on server side. To learn about failure detection, see Configure service failure detection. | Count | autovalue |
| builtin:service | Failure rate (server side errors) | Percent (%) | autoavg |
| builtin:service | Number of calls without server side errors | Count | autovalue |
| builtin:service | Client side response time Response time for a given key request - measured on the client side. This metric is written for each key request. To learn more about key requests, see Monitor key request. | Microsecond | autoavgcountmaxmedianminpercentilesum |
| builtin:service | Server side response time Response time for a given key request - measured on the server side. This metric is written for each request. To learn more about key requests, see Monitor key request. | Microsecond | autoavgcountmaxmedianminpercentilesum |
| builtin:service | Key request response time Response time for a given key request. This metric is written for each key request. To learn more about key requests, see Monitor key request. | Microsecond | autoavgcountmaxmedianminpercentilesum |
| builtin:service | Success rate (server side) | Percent (%) | autoavg |
| builtin:service | Number of calls to databases | Count | autovalue |
| builtin:service | Time spent in database calls | Microsecond | autovalue |
| builtin:service | IO time | Microsecond | autovalue |
| builtin:service | Lock time | Microsecond | autovalue |
| builtin:service | Number of calls to other services | Count | autovalue |
| builtin:service | Time spent in calls to other services | Microsecond | autovalue |
| builtin:service | Total processing time Total processing time for a given key request. This time includes potential further asynchronous processing. This metric is written for each key request. To learn more about key requests, see Monitor key request. | Microsecond | autoavgcountmaxmedianminpercentilesum |
| builtin:service | Wait time | Microsecond | autovalue |
Request
| Metric key | Name and description | Unit | Aggregations |
|---|---|---|---|
| builtin:service | Unified service mesh request count Number of service mesh requests received by a given service. To learn how Dynatrace detects services, see Service detection and naming. | Count | autovalue |
| builtin:service | Unified service mesh request count (by service) Number of service mesh requests received by a given service. Reduced dimensions for faster charting. To learn how Dynatrace detects services, see Service detection and naming. | Count | autovalue |
| builtin:service | Unified service mesh request failure count Number of failed service mesh requests received by a given service. To learn how Dynatrace detects service failures, see Configure service failure detection. | Count | autovalue |
| builtin:service | Unified service mesh request failure count (by service) Number of failed service mesh requests received by a given service. Reduced dimensions for faster charting. To learn how Dynatrace detects service failures, see Configure service failure detection. | Count | autovalue |
| builtin:service | Unified service mesh request response time Response time of a service mesh ingress measured in microseconds. To learn how Dynatrace calculates service timings, see Service analysis timings. | Millisecond | autocountmaxmedianminpercentile |
| builtin:service | Unified service mesh request response time (by service) Response time of a service mesh ingress measured in microseconds. Reduced dimensions for faster charting. To learn how Dynatrace calculates service timings, see Service analysis timings. | Millisecond | autocountmaxmedianminpercentile |
| builtin:service | Unified service request count (by service, endpoint) Number of requests received by a given service. Reduced dimensions for faster charting. To learn how Dynatrace detects and analyzes services, see Services. | Count | autovalue |
| builtin:service | Unified service request count (by service) Number of requests received by a given service. Reduced dimensions for faster charting. To learn how Dynatrace detects and analyzes services, see Services. | Count | autovalue |
| builtin:service | Unified service failure count Number of failed requests received by a given service. To learn how Dynatrace detects and analyzes services, see Services. | Count | autovalue |
| builtin:service | Unified service failure count (by service, endpoint) Number of failed requests received by a given service. Reduced dimensions for faster charting. To learn how Dynatrace detects and analyzes services, see Services. | Count | autovalue |
| builtin:service | Unified service failure count (by service) Number of failed requests received by a given service. Reduced dimensions for faster charting. To learn how Dynatrace detects and analyzes services, see Services. | Count | autovalue |
| builtin:service | Unified service request response time (by service, endpoint) Response time of a service measured in microseconds on the server side. Response time is the time until a response is sent to a calling application, process or other service. It does not include further asynchronous processing. Reduced dimensions for faster charting. To learn how Dynatrace calculates service timings, see Service analysis timings. | Millisecond | autocountmaxmedianminpercentile |
| builtin:service | Unified service request response time (by service) Response time of a service measured in microseconds on the server side. Response time is the time until a response is sent to a calling application, process or other service. It does not include further asynchronous processing. Reduced dimensions for faster charting. To learn how Dynatrace calculates service timings, see Service analysis timings. | Millisecond | autocountmaxmedianminpercentile |
Request count
| Metric key | Name and description | Unit | Aggregations |
|---|---|---|---|
| builtin:service | Request count - client Number of requests received by a given service - measured on the client side. This metric allows service splittings. To learn how Dynatrace detects and analyzes services, see Services. | Count | autovalue |
| builtin:service | Request count - server Number of requests received by a given service - measured on the server side. This metric allows service splittings. To learn how Dynatrace detects and analyzes services, see Services. | Count | autovalue |
| builtin:service | Request count Number of requests received by a given service. This metric allows service splittings. To learn how Dynatrace detects and analyzes services, see Services. | Count | autovalue |
Response time
| Metric key | Name and description | Unit | Aggregations |
|---|---|---|---|
| builtin:service | Client side response time Response time for a given key request per request type - measured on the client side. This metric is written for each key request. To learn more about key requests, see Monitor key request. | Microsecond | autoavgcountmaxmedianminpercentilesum |
| builtin:service | Server side response time Response time for a given key request per request type - measured on the server side. This metric is written for each key request. To learn more about key requests, see Monitor key request. | Microsecond | autoavgcountmaxmedianminpercentilesum |
| builtin:service | Client side response time | Microsecond | autoavgcountmaxmedianminpercentilesum |
| builtin:service | Server side response time | Microsecond | autoavgcountmaxmedianminpercentilesum |
| builtin:service | Response time Time consumed by a particular service until a response is sent back to the calling application, process, service etc.To learn how Dynatrace calculates service timings, see Service analysis timings. | Microsecond | autoavgcountmaxmedianminpercentilesum |
Success rate
| Metric key | Name and description | Unit | Aggregations |
|---|---|---|---|
| builtin:service | Success rate (server side) | Percent (%) | autoavg |
Total processing time
| Metric key | Name and description | Unit | Aggregations |
|---|---|---|---|
| builtin:service | Total processing time Total time consumed by a particular request type including asynchronous processing. Time includes the factor that asynchronous processing can still occur after responses are sent. To learn how Dynatrace calculates service timings, see Service analysis timings. | Microsecond | autoavgcountmaxmedianminpercentilesum |
Other services metrics
| Metric key | Name and description | Unit | Aggregations |
|---|---|---|---|
| builtin:service | Total processing time Total time consumed by a particular service including asynchronous processing. Time includes the factor that asynchronous processing can still occur after responses are sent.To learn how Dynatrace calculates service timings, see Service analysis timings. | Microsecond | autoavgcountmaxmedianminpercentilesum |
| builtin:service | Number of calls to databases | Count | autovalue |
| builtin:service | Time spent in database calls | Microsecond | autovalue |
| builtin:service | IO time | Microsecond | autovalue |
| builtin:service | Lock time | Microsecond | autovalue |
| builtin:service | Number of calls to other services | Count | autovalue |
| builtin:service | Time spent in calls to other services | Microsecond | autovalue |
| builtin:service | Wait time | Microsecond | autovalue |
Synthetic monitoring
Browser
| Metric key | Name and description | Unit | Aggregations |
|---|---|---|---|
| builtin:synthetic | Action duration - custom action [browser monitor] The duration of custom actions; split by monitor. | Millisecond | autoavgcountmaxmedianminpercentilesum |
| builtin:synthetic | Action duration - custom action (by geolocation) [browser monitor] The duration of custom actions; split by monitor, geolocation. | Millisecond | autoavgcountmaxminsum |
| builtin:synthetic | Action duration - load action [browser monitor] The duration of load actions; split by monitor. | Millisecond | autoavgcountmaxmedianminpercentilesum |
| builtin:synthetic | Action duration - load action (by geolocation) [browser monitor] The duration of load actions; split by monitor, geolocation. | Millisecond | autoavgcountmaxminsum |
| builtin:synthetic | Action duration - XHR action [browser monitor] The duration of XHR actions; split by monitor. | Millisecond | autoavgcountmaxmedianminpercentilesum |
| builtin:synthetic | Action duration - XHR action (by geolocation) [browser monitor] The duration of XHR actions; split by monitor, geolocation. | Millisecond | autoavgcountmaxminsum |
| builtin:synthetic | Monitor availability [browser monitor] | Count | autoavgcountmaxminsum |
| builtin:synthetic | Availability rate (by location) [browser monitor] The availability rate of browser monitors. | Percent (%) | autoavg |
| builtin:synthetic | Availability rate - excl. maintenance windows (by location) [browser monitor] The availability rate of browser monitors excluding maintenance windows. | Percent (%) | autoavg |
| builtin:synthetic | Cumulative layout shift - load action [browser monitor] The score measuring the unexpected shifting of visible webpage elements. Calculated for load actions; split by monitor. | autoavgcountmaxmedianminpercentilesum | |
| builtin:synthetic | Cumulative layout shift - load action (by geolocation) [browser monitor] The score measuring the unexpected shifting of visible webpage elements. Calculated for load actions; split by monitor, geolocation. | autoavgcountmaxmedianminpercentilesum | |
| builtin:synthetic | DOM interactive - load action [browser monitor] The time taken until a page's status is set to "interactive" and it's ready to receive input. Calculated for load actions; split by monitor | Millisecond | autoavgcountmaxmedianminpercentilesum |
| builtin:synthetic | DOM interactive - load action (by geolocation) [browser monitor] The time taken until a page's status is set to "interactive" and it's ready to receive input. Calculated for load actions; split by monitor, geolocation | Millisecond | autoavgcountmaxminsum |
| builtin:synthetic | Error details (by error code) [browser monitor] The number of detected errors; split by monitor, error code. | Count | autovalue |
| builtin:synthetic | Error details (by geolocation, error code) [browser monitor] The number of detected errors; split by monitor executions. | Count | autovalue |
| builtin:synthetic | Action duration - custom action (by event) [browser monitor] The duration of custom actions; split by event. | Millisecond | autoavgcountmaxmedianminpercentilesum |
| builtin:synthetic | Action duration - custom action (by event, geolocation) [browser monitor] The duration of custom actions; split by event, geolocation. | Millisecond | autoavgcountmaxminsum |
| builtin:synthetic | Action duration - load action (by event) [browser monitor] The duration of load actions; split by event. | Millisecond | autoavgcountmaxmedianminpercentilesum |
| builtin:synthetic | Action duration - load action (by event, geolocation) [browser monitor] The duration of load actions; split by event, geolocation. | Millisecond | autoavgcountmaxminsum |
| builtin:synthetic | Action duration - XHR action (by event) [browser monitor] The duration of XHR actions; split by event. | Millisecond | autoavgcountmaxmedianminpercentilesum |
| builtin:synthetic | Action duration - XHR action (by event, geolocation) [browser monitor] The duration of XHR actions; split by event, geolocation. | Millisecond | autoavgcountmaxminsum |
| builtin:synthetic | Cumulative layout shift - load action (by event) [browser monitor] The score measuring the unexpected shifting of visible webpage elements. Calculated for load actions; split by event. | autoavgcountmaxmedianminpercentilesum | |
| builtin:synthetic | Cumulative layout shift - load action (by event, geolocation) [browser monitor] The score measuring the unexpected shifting of visible webpage elements. Calculated for load actions; split by event, geolocation. | autoavgcountmaxmedianminpercentilesum | |
| builtin:synthetic | DOM interactive - load action (by event) [browser monitor] The time taken until a page's status is set to "interactive" and it's ready to receive input. Calculated for load actions; split by event | Millisecond | autoavgcountmaxmedianminpercentilesum |
| builtin:synthetic | DOM interactive - load action (by event, geolocation) [browser monitor] The time taken until a page's status is set to "interactive" and it's ready to receive input. Calculated for load actions; split by event, geolocation | Millisecond | autoavgcountmaxminsum |
| builtin:synthetic | Error details (by event, error code) [browser monitor] The number of detected errors; split by event, error code. | Count | autovalue |
| builtin:synthetic | Error details (by event, geolocation, error code) [browser monitor] The number of detected errors; split by event, geolocation, error code. | Count | autovalue |
| builtin:synthetic | Failed events count (by event) [browser monitor] The number of failed monitor events; split by event. | Count | autovalue |
| builtin:synthetic | Failed events count (by event, geolocation) [browser monitor] The number of failed monitor events; split by event, geolocation. | Count | autovalue |
| builtin:synthetic | Time to first byte - load action (by event) [browser monitor] The time taken until the first byte of the response is received from the server, relevant application caches, or a local resource. Calculated for load actions; split by event. | Millisecond | autoavgcountmaxmedianminpercentilesum |
| builtin:synthetic | Time to first byte - load action (by event, geolocation) [browser monitor] The time taken until the first byte of the response is received from the server, relevant application caches, or a local resource. Calculated for load actions; split by event, geolocation. | Millisecond | autoavgcountmaxminsum |
| builtin:synthetic | Time to first byte - XHR action (by event) [browser monitor] The time taken until the first byte of the response is received from the server, relevant application caches, or a local resource. Calculated for XHR actions; split by event. | Millisecond | autoavgcountmaxmedianminpercentilesum |
| builtin:synthetic | Time to first byte - XHR action (by event, geolocation) [browser monitor] The time taken until the first byte of the response is received from the server, relevant application caches, or a local resource. Calculated for XHR actions; split by event, geolocation. | Millisecond | autoavgcountmaxminsum |
| builtin:synthetic | Largest contentful paint - load action (by event) [browser monitor] The time taken to render the largest element in the viewport. Calculated for load actions; split by event. | Millisecond | autoavgcountmaxmedianminpercentilesum |
| builtin:synthetic | Largest contentful paint - load action (by event, geolocation) [browser monitor] The time taken to render the largest element in the viewport. Calculated for load actions; split by event, geolocation. | Millisecond | autoavgcountmaxmedianminpercentilesum |
| builtin:synthetic | Load event end - load action (by event) [browser monitor] The time taken to complete the load event of a page. Calculated for load actions; split by event. | Millisecond | autoavgcountmaxmedianminpercentilesum |
| builtin:synthetic | Load event end - load action (by event, geolocation) [browser monitor] The time taken to complete the load event of a page. Calculated for load actions; split by event, geolocation. | Millisecond | autoavgcountmaxminsum |
| builtin:synthetic | Load event start - load action (by event) [browser monitor] The time taken to begin the load event of a page. Calculated for load actions; split by event. | Millisecond | autoavgcountmaxmedianminpercentilesum |
| builtin:synthetic | Load event start - load action (by event, geolocation) [browser monitor] The time taken to begin the load event of a page. Calculated for load actions; split by event, geolocation. | Millisecond | autoavgcountmaxminsum |
| builtin:synthetic | Network contribution - load action (by event) [browser monitor] The time taken to request and receive resources (including DNS lookup, redirect, and TCP connect time). Calculated for load actions; split by event. | Millisecond | autoavgcountmaxmedianminpercentilesum |
| builtin:synthetic | Network contribution - load action (by event, geolocation) [browser monitor] The time taken to request and receive resources (including DNS lookup, redirect, and TCP connect time). Calculated for load actions; split by event, geolocation. | Millisecond | autoavgcountmaxminsum |
| builtin:synthetic | Network contribution - XHR action (by event) [browser monitor] The time taken to request and receive resources (including DNS lookup, redirect, and TCP connect time). Calculated for XHR actions; split by event. | Millisecond | autoavgcountmaxmedianminpercentilesum |
| builtin:synthetic | Network contribution - XHR action (by event, geolocation) [browser monitor] The time taken to request and receive resources (including DNS lookup, redirect, and TCP connect time). Calculated for XHR actions; split by event, geolocation. | Millisecond | autoavgcountmaxminsum |
| builtin:synthetic | Response end - load action (by event) [browser monitor] (AKA HTML downloaded) The time taken until the user agent receives the last byte of the response or the transport connection is closed, whichever comes first. Calculated for load actions; split by event. | Millisecond | autoavgcountmaxmedianminpercentilesum |
| builtin:synthetic | Response end - load action (by event, geolocation) [browser monitor] (AKA HTML downloaded) The time taken until the user agent receives the last byte of the response or the transport connection is closed, whichever comes first. Calculated for load actions; split by event, geolocation. | Millisecond | autoavgcountmaxminsum |
| builtin:synthetic | Response end - XHR action (by event) [browser monitor] (AKA HTML downloaded) The time taken until the user agent receives the last byte of the response or the transport connection is closed, whichever comes first. Calculated for XHR actions; split by event. | Millisecond | autoavgcountmaxmedianminpercentilesum |
| builtin:synthetic | Response end - XHR action (by event, geolocation) [browser monitor] (AKA HTML downloaded) The time taken until the user agent receives the last byte of the response or the transport connection is closed, whichever comes first. Calculated for XHR actions; split by event, geolocation. | Millisecond | autoavgcountmaxminsum |
| builtin:synthetic | Server contribution - load action (by event) [browser monitor] The time spent on server-side processing for a page. Calculated for load actions; split by event. | Millisecond | autoavgcountmaxmedianminpercentilesum |
| builtin:synthetic | Server contribution - load action (by event, geolocation) [browser monitor] The time spent on server-side processing for a page. Calculated for load actions; split by event, geolocation. | Millisecond | autoavgcountmaxminsum |
| builtin:synthetic | Server contribution - XHR action (by event) [browser monitor] The time spent on server-side processing for a page. Calculated for XHR actions; split by event. | Millisecond | autoavgcountmaxmedianminpercentilesum |
| builtin:synthetic | Server contribution - XHR action (by event, geolocation) [browser monitor] The time spent on server-side processing for a page. Calculated for XHR actions; split by event, geolocation. | Millisecond | autoavgcountmaxminsum |
| builtin:synthetic | Speed index - load action (by event) [browser monitor] The score measuring how quickly the visible parts of a page are rendered. Calculated for load actions; split by event. | Millisecond | autoavgcountmaxmedianminpercentilesum |
| builtin:synthetic | Speed index - load action (by event, geolocation) [browser monitor] The score measuring how quickly the visible parts of a page are rendered. Calculated for load actions; split by event, geolocation. | Millisecond | autoavgcountmaxminsum |
| builtin:synthetic | Successful events count (by event) [browser monitor] The number of successful monitor events; split by event. | Count | autovalue |
| builtin:synthetic | Successful events count (by event, geolocation) [browser monitor] The number of successful monitor events; split by event, geolocation. | Count | autovalue |
| builtin:synthetic | Total events count (by event) [browser monitor] The total number of monitor events executions executions; split by event. | Count | autovalue |
| builtin:synthetic | Total events count (by event, geolocation) [browser monitor] The total number of monitor events executions; split by event, geolocation. | Count | autovalue |
| builtin:synthetic | Total duration (by event) [browser monitor] The duration of all actions in an event; split by event. | Millisecond | autoavgcountmaxmedianminpercentilesum |
| builtin:synthetic | Total duration (by event, geolocation) [browser monitor] The duration of all actions in an event; split by event, geolocation. | Millisecond | autoavgcountmaxminsum |
| builtin:synthetic | Visually complete - load action (by event) [browser monitor] The time taken to fully render content in the viewport. Calculated for load actions; split by event. | Millisecond | autoavgcountmaxmedianminpercentilesum |
| builtin:synthetic | Visually complete - load action (by event, geolocation) [browser monitor] The time taken to fully render content in the viewport. Calculated for load actions; split by event, geolocation. | Millisecond | autoavgcountmaxminsum |
| builtin:synthetic | Visually complete - XHR action (by event) [browser monitor] The time taken to fully render content in the viewport. Calculated for XHR actions; split by event. | Millisecond | autoavgcountmaxmedianminpercentilesum |
| builtin:synthetic | Visually complete - XHR action (by event, geolocation) [browser monitor] The time taken to fully render content in the viewport. Calculated for XHR actions; split by event, geolocation. | Millisecond | autoavgcountmaxminsum |
| builtin:synthetic | Failed executions count [browser monitor] The number of failed monitor executions; split by monitor. | Count | autovalue |
| builtin:synthetic | Failed executions count (by geolocation) [browser monitor] The number of failed monitor executions; split by monitor, geolocation. | Count | autovalue |
| builtin:synthetic | Time to first byte - load action [browser monitor] The time taken until the first byte of the response is received from the server, relevant application caches, or a local resource. Calculated for load actions; split by monitor. | Millisecond | autoavgcountmaxmedianminpercentilesum |
| builtin:synthetic | Time to first byte - load action (by geolocation) [browser monitor] The time taken until the first byte of the response is received from the server, relevant application caches, or a local resource. Calculated for load actions; split by monitor, geolocation. | Millisecond | autoavgcountmaxminsum |
| builtin:synthetic | Time to first byte - XHR action [browser monitor] The time taken until the first byte of the response is received from the server, relevant application caches, or a local resource. Calculated for XHR actions; split by monitor. | Millisecond | autoavgcountmaxmedianminpercentilesum |
| builtin:synthetic | Time to first byte - XHR action (by geolocation) [browser monitor] The time taken until the first byte of the response is received from the server, relevant application caches, or a local resource. Calculated for XHR actions; split by monitor, geolocation. | Millisecond | autoavgcountmaxminsum |
| builtin:synthetic | Largest contentful paint - load action [browser monitor] The time taken to render the largest element in the viewport. Calculated for load actions; split by monitor. | Millisecond | autoavgcountmaxmedianminpercentilesum |
| builtin:synthetic | Largest contentful paint - load action (by geolocation) [browser monitor] The time taken to render the largest element in the viewport. Calculated for load actions; split by monitor, geolocation. | Millisecond | autoavgcountmaxmedianminpercentilesum |
| builtin:synthetic | Load event end - load action [browser monitor] The time taken to complete the load event of a page. Calculated for load actions; split by monitor. | Millisecond | autoavgcountmaxmedianminpercentilesum |
| builtin:synthetic | Load event end - load action (by geolocation) [browser monitor] The time taken to complete the load event of a page. Calculated for load actions; split by monitor, geolocation. | Millisecond | autoavgcountmaxminsum |
| builtin:synthetic | Load event start - load action [browser monitor] The time taken to begin the load event of a page. Calculated for load actions; split by monitor. | Millisecond | autoavgcountmaxmedianminpercentilesum |
| builtin:synthetic | Load event start - load action (by geolocation) [browser monitor] The time taken to begin the load event of a page. Calculated for load actions; split by monitor, geolocation. | Millisecond | autoavgcountmaxminsum |
| builtin:synthetic | Network contribution - load action [browser monitor] The time taken to request and receive resources (including DNS lookup, redirect, and TCP connect time). Calculated for load actions; split by monitor. | Millisecond | autoavgcountmaxmedianminpercentilesum |
| builtin:synthetic | Network contribution - load action (by geolocation) [browser monitor] The time taken to request and receive resources (including DNS lookup, redirect, and TCP connect time). Calculated for load actions; split by monitor, geolocation. | Millisecond | autoavgcountmaxminsum |
| builtin:synthetic | Network contribution - XHR action [browser monitor] The time taken to request and receive resources (including DNS lookup, redirect, and TCP connect time). Calculated for XHR actions; split by monitor. | Millisecond | autoavgcountmaxmedianminpercentilesum |
| builtin:synthetic | Network contribution - XHR action (by geolocation) [browser monitor] The time taken to request and receive resources (including DNS lookup, redirect, and TCP connect time). Calculated for XHR actions; split by monitor, geolocation. | Millisecond | autoavgcountmaxminsum |
| builtin:synthetic | Response end - load action [browser monitor] (AKA HTML downloaded) The time taken until the user agent receives the last byte of the response or the transport connection is closed, whichever comes first. Calculated for load actions; split by monitor. | Millisecond | autoavgcountmaxmedianminpercentilesum |
| builtin:synthetic | Response end - load action (by geolocation) [browser monitor] (AKA HTML downloaded) The time taken until the user agent receives the last byte of the response or the transport connection is closed, whichever comes first. Calculated for load actions; split by monitor, geolocation. | Millisecond | autoavgcountmaxminsum |
| builtin:synthetic | Response end - XHR action [browser monitor] (AKA HTML downloaded) The time taken until the user agent receives the last byte of the response or the transport connection is closed, whichever comes first. Calculated for XHR actions; split by monitor. | Millisecond | autoavgcountmaxmedianminpercentilesum |
| builtin:synthetic | Response end - XHR action (by geolocation) [browser monitor] (AKA HTML downloaded) The time taken until the user agent receives the last byte of the response or the transport connection is closed, whichever comes first. Calculated for XHR actions; split by monitor, geolocation. | Millisecond | autoavgcountmaxminsum |
| builtin:synthetic | Server contribution - load action [browser monitor] The time spent on server-side processing for a page. Calculated for load actions; split by monitor. | Millisecond | autoavgcountmaxmedianminpercentilesum |
| builtin:synthetic | Server contribution - load action (by geolocation) [browser monitor] The time spent on server-side processing for a page. Calculated for load actions; split by monitor, geolocation. | Millisecond | autoavgcountmaxminsum |
| builtin:synthetic | Server contribution - XHR action [browser monitor] The time spent on server-side processing for a page. Calculated for XHR actions; split by monitor. | Millisecond | autoavgcountmaxmedianminpercentilesum |
| builtin:synthetic | Server contribution - XHR action (by geolocation) [browser monitor] The time spent on server-side processing for a page. Calculated for XHR actions; split by monitor, geolocation. | Millisecond | autoavgcountmaxminsum |
| builtin:synthetic | Speed index - load action [browser monitor] The score measuring how quickly the visible parts of a page are rendered. Calculated for load actions; split by monitor. | Millisecond | autoavgcountmaxmedianminpercentilesum |
| builtin:synthetic | Speed index - load action (by geolocation) [browser monitor] The score measuring how quickly the visible parts of a page are rendered. Calculated for load actions; split by monitor, geolocation. | Millisecond | autoavgcountmaxminsum |
| builtin:synthetic | User actions duration (step) [browser monitor] Duration of individual browser monitor step, measured from the start of the first user action of the step to the end of the last user action of the step. The metric source is the new RUM JavaScript. | Millisecond | autoavgcountmaxminsum |
| builtin:synthetic | User actions total duration (step) [browser monitor] Total duration of individual browser monitor step, measured as a sum of durations of all user actions in the step. The metric source is the new RUM JavaScript. | Millisecond | autoavgcountmaxminsum |
| builtin:synthetic | User events duration (step) [browser monitor] Duration of individual browser monitor step, measured from the start of the first user event of the step to the end of the last user event of the step. The metric source is the new RUM JavaScript. | Millisecond | autoavgcountmaxminsum |
| builtin:synthetic | User events total duration (step) [browser monitor] Total duration of individual browser monitor step, measured as a sum of durations of all user events in the step. The metric source is the new RUM JavaScript. | Millisecond | autoavgcountmaxminsum |
| builtin:synthetic | Duration (step) [browser monitor] Duration of individual browser monitor step, measured as a sum of durations of user action events in the step. | Millisecond | autoavgcountmaxminsum |
| builtin:synthetic | Successful executions count [browser monitor] The number of successful monitor executions; split by monitor. | Count | autovalue |
| builtin:synthetic | Successful executions count (by geolocation) [browser monitor] The number of successful monitor executions; split by monitor, geolocation. | Count | autovalue |
| builtin:synthetic | Total executions count [browser monitor] The total number of monitor executions executions; split by monitor. | Count | autovalue |
| builtin:synthetic | Total executions count (by geolocation) [browser monitor] The total number of monitor executions executions; split by monitor, geolocation. | Count | autovalue |
| builtin:synthetic | Total duration [browser monitor] The duration of all actions in an event; split by monitor. | Millisecond | autoavgcountmaxmedianminpercentilesum |
| builtin:synthetic | Total duration (by geolocation) [browser monitor] The duration of all actions in an event; split by monitor, geolocation. | Millisecond | autoavgcountmaxminsum |
| builtin:synthetic | User actions duration [browser monitor] Duration of browser monitor, calculated as a sum of all steps-level user actions durations. The metric source is the new RUM JavaScript. | Millisecond | autoavgcountmaxminsum |
| builtin:synthetic | User actions total duration [browser monitor] Total duration of browser monitor, measured as a sum of all steps-level values of "User actions total duration" metric. The metric source is the new RUM JavaScript. | Millisecond | autoavgcountmaxminsum |
| builtin:synthetic | User events duration [browser monitor] Duration of browser monitor, calculated as a sum of all steps-level user events durations. The metric source is the new RUM JavaScript. | Millisecond | autoavgcountmaxminsum |
| builtin:synthetic | User events total duration [browser monitor] Total duration of browser monitor, measured as a sum of all steps-level values of "User events total duration" metric. The metric source is the new RUM JavaScript. | Millisecond | autoavgcountmaxminsum |
| builtin:synthetic | Visually complete - load action [browser monitor] The time taken to fully render content in the viewport. Calculated for load actions; split by monitor. | Millisecond | autoavgcountmaxmedianminpercentilesum |
| builtin:synthetic | Visually complete - load action (by geolocation) [browser monitor] The time taken to fully render content in the viewport. Calculated for load actions; split by monitor, geolocation. | Millisecond | autoavgcountmaxminsum |
| builtin:synthetic | Visually complete - XHR action [browser monitor] The time taken to fully render content in the viewport. Calculated for XHR actions; split by monitor. | Millisecond | autoavgcountmaxmedianminpercentilesum |
| builtin:synthetic | Visually complete - XHR action (by geolocation) [browser monitor] The time taken to fully render content in the viewport. Calculated for XHR actions; split by monitor, geolocation. | Millisecond | autoavgcountmaxminsum |
| builtin:synthetic | Duration [browser monitor] Duration of browser monitor, calculated as a sum of all steps durations. | Millisecond | autoavgcountmaxminsum |
HTTP
| Metric key | Name and description | Unit | Aggregations |
|---|---|---|---|
| builtin:synthetic | Monitor availability [HTTP monitor] | Count | autoavgcountmaxminsum |
| builtin:synthetic | Availability rate (by location) [HTTP monitor] The availability rate of HTTP monitors. | Percent (%) | autoavg |
| builtin:synthetic | Availability rate - excl. maintenance windows (by location) [HTTP monitor] The availability rate of HTTP monitors excluding maintenance windows. | Percent (%) | autoavg |
| builtin:synthetic | DNS lookup time (by location) [HTTP monitor] The time taken to resolve the hostname for a target URL for the sum of all requests. | Millisecond | autoavgcountmaxminsum |
| builtin:synthetic | Duration (by location) [HTTP monitor] The duration of the sum of all requests. | Millisecond | autoavgcountmaxminsum |
| builtin:synthetic | Execution count (by status) [HTTP monitor] The number of monitor executions. | Count | autovalue |
| builtin:synthetic | DNS lookup time (by request, location) [HTTP monitor] The time taken to resolve the hostname for a target URL for individual HTTP requests. | Millisecond | autoavgcountmaxminsum |
| builtin:synthetic | Duration (by request, location) [HTTP monitor] The duration of individual HTTP requests. | Millisecond | autoavgcountmaxminsum |
| builtin:synthetic | Response size (by request, location) [HTTP monitor] The response size of individual HTTP requests. | Byte | autoavgcountmaxminsum |
| builtin:synthetic | TCP connect time (by request, location) [HTTP monitor] The time taken to establish the TCP connection to the server (including SSL) for individual HTTP requests. | Millisecond | autoavgcountmaxminsum |
| builtin:synthetic | Time to first byte (by request, location) [HTTP monitor] The time taken until the first byte of the response is received from the server, relevant application caches, or a local resource. Calculated for individual HTTP requests. | Millisecond | autoavgcountmaxminsum |
| builtin:synthetic | TLS handshake time (by request, location) [HTTP monitor] The time taken to complete the TLS handshake for individual HTTP requests. | Millisecond | autoavgcountmaxminsum |
| builtin:synthetic | Duration threshold (request) (by request) [HTTP monitor] The performance threshold for individual HTTP requests. | Millisecond | autoavgcountmaxminsum |
| builtin:synthetic | Result status count (by request, location) [HTTP monitor] The number of request executions with success/failure result status. | Count | autoavgcountmaxminsum |
| builtin:synthetic | Status code count (by request, location) [HTTP monitor] The number of request executions that end with an HTTP status code. | Count | autovalue |
| builtin:synthetic | Response size (by location) [HTTP monitor] The response size of the sum of all requests. | Byte | autoavgcountmaxminsum |
| builtin:synthetic | TCP connect time (by location) [HTTP monitor] The time taken to establish the TCP connection to the server (including SSL) for the sum of all requests. | Millisecond | autoavgcountmaxminsum |
| builtin:synthetic | Time to first byte (by location) [HTTP monitor] The time taken until the first byte of the response is received from the server, relevant application caches, or a local resource. Calculated for the sum of all requests. | Millisecond | autoavgcountmaxminsum |
| builtin:synthetic | TLS handshake time (by location) [HTTP monitor] The time taken to complete the TLS handshake for the sum of all requests. | Millisecond | autoavgcountmaxminsum |
| builtin:synthetic | Duration threshold [HTTP monitor] The performance threshold for the sum of all requests. | Millisecond | autoavgcountmaxminsum |
| builtin:synthetic | Result status count (by location) [HTTP monitor] The number of monitor executions with success/failure result status. | Count | autoavgcountmaxminsum |
| builtin:synthetic | Status code count (by location) [HTTP monitor] The number of monitor executions that end with an HTTP status code. | Count | autovalue |
Location
| Metric key | Name and description | Unit | Aggregations |
|---|---|---|---|
| builtin:synthetic | Node health status count [synthetic] The number of private Synthetic nodes and their health status. | Count | autoavgcountmaxminsum |
| builtin:synthetic | Private location health status count [synthetic] The number of private Synthetic locations and their health status. | Count | autoavgcountmaxminsum |
MultiProtocol
| Metric key | Name and description | Unit | Aggregations |
|---|---|---|---|
| builtin:synthetic | Monitor availability [Network Availability monitor] | Count | autoavgcountmaxminsum |
| builtin:synthetic | Monitor availability excluding maintenance windows [Network Availability monitor] | Count | autoavgcountmaxminsum |
| builtin:synthetic | DNS request resolution time [Network Availability request] | Millisecond | autoavgcountmaxminsum |
| builtin:synthetic | Number of successful ICMP packets [Network Availability request] | Count | autoavgcountmaxminsum |
| builtin:synthetic | Number of ICMP packets [Network Availability request] | Count | autoavgcountmaxminsum |
| builtin:synthetic | ICMP request execution time [Network Availability request] | Millisecond | autoavgcountmaxminsum |
| builtin:synthetic | ICMP round trip time [Network Availability request] | Millisecond | autoavgcountmaxminsum |
| builtin:synthetic | ICMP request success rate [Network Availability request] | Count | autoavgcountmaxminsum |
| builtin:synthetic | Request availability [Network Availability request] | Count | autoavgcountmaxminsum |
| builtin:synthetic | Request availability excluding maintenance windows [Network Availability request] | Count | autoavgcountmaxminsum |
| builtin:synthetic | Request execution time [Network Availability request] | Millisecond | autoavgcountmaxminsum |
| builtin:synthetic | Execution count (by status) [Network Availability request] | Count | autovalue |
| builtin:synthetic | Step availability [Network Availability step] | Count | autoavgcountmaxminsum |
| builtin:synthetic | Step availability excluding maintenance windows [Network Availability step] | Count | autoavgcountmaxminsum |
| builtin:synthetic | Step execution time [Network Availability step] | Millisecond | autoavgcountmaxminsum |
| builtin:synthetic | Execution count (by status) [Network Availability step] | Count | autovalue |
| builtin:synthetic | Step success rate [Network Availability step] | Count | autoavgcountmaxminsum |
| builtin:synthetic | TCP request connection time [Network Availability request] | Millisecond | autoavgcountmaxminsum |
| builtin:synthetic | Monitor execution time [Network Availability monitor] | Millisecond | autoavgcountmaxminsum |
| builtin:synthetic | Execution count (by status) [Network Availability monitor] | Count | autovalue |
| builtin:synthetic | Monitor success rate [Network Availability monitor] | Count | autoavgcountmaxminsum |
Third party
| Metric key | Name and description | Unit | Aggregations |
|---|---|---|---|
| builtin:synthetic | Availability rate (by location) [third-party monitor] The availability rate of third-party monitors. | Percent (%) | autoavg |
| builtin:synthetic | Availability rate - excl. maintenance windows (by location) [third-party monitor] The availability rate of third-party monitors excluding maintenance windows. | Percent (%) | autoavg |
| builtin:synthetic | Error count [third-party monitor] The number of detected errors; split by monitor, step, error code. | Count | autovalue |
| builtin:synthetic | Error count (by location) [third-party monitor] The number of detected errors; split by monitor, location, step, error code. | Count | autovalue |
| builtin:synthetic | Test quality rate [third-party monitor] The test quality rate. Calculated by dividing successful steps by the total number of steps executed; split by monitor. | Percent (%) | autoavgmaxmin |
| builtin:synthetic | Test quality rate (by location) [third-party monitor] The test quality rate. Calculated by dividing successful steps by the total number of steps executed; split by monitor, location. | Percent (%) | autoavgmaxmin |
| builtin:synthetic | Response time [third-party monitor] The response time of third-party monitors; split by monitor. | Millisecond | autoavgcountmaxminsum |
| builtin:synthetic | Response time (by location) [third-party monitor] The response time of third-party monitors; split by monitor, location. | Millisecond | autoavgcountmaxminsum |
| builtin:synthetic | Response time (by step) [third-party monitor] The response time of third-party monitors; split by step. | Millisecond | autoavgcountmaxminsum |
| builtin:synthetic | Response time (by step, location) [third-party monitor] The response time of third-party monitors; split by step, location. | Millisecond | autoavgcountmaxminsum |
Technologies
.NET
| Metric key | Name and description | Unit | Aggregations |
|---|---|---|---|
| builtin:tech | .NET garbage collection (# Gen 0) Number of completed GC runs that collected objects in Gen0 Heap within the given time range, https://dt-url.net/i1038bq | Count | autovalue |
| builtin:tech | .NET garbage collection (# Gen 1) Number of completed GC runs that collected objects in Gen1 Heap within the given time range, https://dt-url.net/i1038bq | Count | autovalue |
| builtin:tech | .NET garbage collection (# Gen 2) Number of completed GC runs that collected objects in Gen2 Heap within the given time range, https://dt-url.net/i1038bq | Count | autovalue |
| builtin:tech | .NET % time in GC Percentage time spend within garbage collection | Percent (%) | autoavgmaxmin |
| builtin:tech | .NET % time in JIT .NET % time in Just in Time compilation | Percent (%) | autoavgmaxmin |
| builtin:tech | .NET average number of active threads | Count | autoavgmaxmin |
| builtin:tech | .NET memory consumption (Large Object Heap) .NET memory consumption for objects within Large Object Heap, https://dt-url.net/es238z7 | Byte | autoavgmaxmin |
| builtin:tech | .NET memory consumption (heap size Gen 0) .NET memory consumption for objects within heap Gen0, https://dt-url.net/i1038bq | Byte | autoavgmaxmin |
| builtin:tech | .NET memory consumption (heap size Gen 1) .NET memory consumption for objects within heap Gen1, https://dt-url.net/i1038bq | Byte | autoavgmaxmin |
| builtin:tech | .NET memory consumption (heap size Gen 2) .NET memory consumption for objects within heap Gen2, https://dt-url.net/i1038bq | Byte | autoavgmaxmin |
| builtin:tech | Bytes in all heaps | Byte | autoavgcountmaxminsum |
| builtin:tech | Gen 0 Collections | Count | autoavgcountmaxminsum |
| builtin:tech | Gen 1 Collections | Count | autoavgcountmaxminsum |
| builtin:tech | Gen 2 Collections | Count | autoavgcountmaxminsum |
| builtin:tech | Logical threads | Count | autoavgcountmaxminsum |
| builtin:tech | Physical threads | Count | autoavgcountmaxminsum |
| builtin:tech | Committed bytes | Byte | autoavgcountmaxminsum |
| builtin:tech | Reserved bytes | Byte | autoavgcountmaxminsum |
| builtin:tech | Time in GC | Percent (%) | autoavgcountmaxminsum |
| builtin:tech | Contention rate | Per second | autoavgcountmaxminsum |
| builtin:tech | Queue length | Count | autoavgcountmaxminsum |
| builtin:tech | Gen 0 Heap size | Byte | autoavgcountmaxminsum |
| builtin:tech | Gen 1 Heap size | Byte | autoavgcountmaxminsum |
| builtin:tech | Gen 2 Heap size | Byte | autoavgcountmaxminsum |
| builtin:tech | .NET managed thread pool active io completion threads .NET managed thread pool active io completion threads | Count | autoavgmaxmin |
| builtin:tech | .NET managed thread pool queued work items .NET managed thread pool queued work items | Count | autoavgmaxmin |
| builtin:tech | .NET managed thread pool active worker threads .NET managed thread pool active worker threads | Count | autoavgmaxmin |
Apache Hadoop
| Metric key | Name and description | Unit | Aggregations |
|---|---|---|---|
| builtin:tech | Blocks number | Count | autoavgcountmaxminsum |
| builtin:tech | Cache capacity | Count | autoavgcountmaxminsum |
| builtin:tech | Cache used | Count | autoavgcountmaxminsum |
| builtin:tech | Remaining capacity | Count | autoavgcountmaxminsum |
| builtin:tech | Total capacity | Count | autoavgcountmaxminsum |
| builtin:tech | Used capacity | Count | autoavgcountmaxminsum |
| builtin:tech | Capacity used non DFS | Count | autoavgcountmaxminsum |
| builtin:tech | Corrupted blocks | Count | autoavgcountmaxminsum |
| builtin:tech | Estimated capacity total loses | Count | autoavgcountmaxminsum |
| builtin:tech | Appended files | Count | autoavgcountmaxminsum |
| builtin:tech | Created files | Count | autoavgcountmaxminsum |
| builtin:tech | Deleted files | Count | autoavgcountmaxminsum |
| builtin:tech | Renamed files | Count | autoavgcountmaxminsum |
| builtin:tech | Files number | Count | autoavgcountmaxminsum |
| builtin:tech | Dead DataNodes | Count | autoavgcountmaxminsum |
| builtin:tech | Dead decommissioning DataNodes | Count | autoavgcountmaxminsum |
| builtin:tech | Live decommissioning DataNodes | Count | autoavgcountmaxminsum |
| builtin:tech | Number of decommissioning DataNodes | Count | autoavgcountmaxminsum |
| builtin:tech | Live DataNodes | Count | autoavgcountmaxminsum |
| builtin:tech | Number of stale dataNodes | Count | autoavgcountmaxminsum |
| builtin:tech | Number of missing blocks | Count | autoavgcountmaxminsum |
| builtin:tech | Pending deletion blocks | Count | autoavgcountmaxminsum |
| builtin:tech | Pending replication blocks | Count | autoavgcountmaxminsum |
| builtin:tech | Scheduled replication blocks | Count | autoavgcountmaxminsum |
| builtin:tech | Total load | Count | autoavgcountmaxminsum |
| builtin:tech | Under replicated blocks | Count | autoavgcountmaxminsum |
| builtin:tech | Volume failures total | Count | autoavgcountmaxminsum |
| builtin:tech | Allocated containers | Count | autoavgcountmaxminsum |
| builtin:tech | Allocated memory | MB | autoavgcountmaxminsum |
| builtin:tech | Allocated CPU in virtual cores | Count | autoavgcountmaxminsum |
| builtin:tech | Completed applications | Count | autoavgcountmaxminsum |
| builtin:tech | Failed applications | Count | autoavgcountmaxminsum |
| builtin:tech | Killed applications | Count | autoavgcountmaxminsum |
| builtin:tech | Pending applications | Count | autoavgcountmaxminsum |
| builtin:tech | Running applications | Count | autoavgcountmaxminsum |
| builtin:tech | Submitted applications | Count | autoavgcountmaxminsum |
| builtin:tech | Available memory | MB | autoavgcountmaxminsum |
| builtin:tech | Available CPU in virtual cores | Count | autoavgcountmaxminsum |
| builtin:tech | Active NodeManagers | Count | autoavgcountmaxminsum |
| builtin:tech | Decommissioned NodeManagers | Count | autoavgcountmaxminsum |
| builtin:tech | Lost NodeManagers | Count | autoavgcountmaxminsum |
| builtin:tech | Rebooted NodeManagers | Count | autoavgcountmaxminsum |
| builtin:tech | Unhealthy NodeManagers | Count | autoavgcountmaxminsum |
| builtin:tech | Pending memory requests | MB | autoavgcountmaxminsum |
| builtin:tech | Pending CPU in virtual cores requests | Count | autoavgcountmaxminsum |
| builtin:tech | Reserved memory | MB | autoavgcountmaxminsum |
| builtin:tech | Reserved CPU in virtual cores requests | Count | autoavgcountmaxminsum |
Apache Tomcat
| Metric key | Name and description | Unit | Aggregations |
|---|---|---|---|
| builtin:tech | Max active | Count | autoavgcountmaxminsum |
| builtin:tech | Max active (global) | Count | autoavgcountmaxminsum |
| builtin:tech | Max total | Count | autoavgcountmaxminsum |
| builtin:tech | Max total (global) | Count | autoavgcountmaxminsum |
| builtin:tech | Num active | Count | autoavgcountmaxminsum |
| builtin:tech | Num active (global) | Count | autoavgcountmaxminsum |
| builtin:tech | Num idle | Count | autoavgcountmaxminsum |
| builtin:tech | Num idle (global) | Count | autoavgcountmaxminsum |
| builtin:tech | Num waiters | Count | autoavgcountmaxminsum |
| builtin:tech | Num waiters (global) | Count | autoavgcountmaxminsum |
| builtin:tech | Wait count | Count | autoavgcountmaxminsum |
| builtin:tech | Wait count (global) | Count | autoavgcountmaxminsum |
| builtin:tech | Tomcat received bytes / sec | Byte | autoavgcountmaxminsum |
| builtin:tech | Tomcat sent bytes / sec | Byte | autoavgcountmaxminsum |
| builtin:tech | Tomcat busy threads | Count | autoavgcountmaxminsum |
| builtin:tech | Tomcat idle threads | Count | autoavgcountmaxminsum |
| builtin:tech | Tomcat request count / sec | Per second | autoavgcountmaxminsum |
Couchbase
| Metric key | Name and description | Unit | Aggregations |
|---|---|---|---|
| builtin:tech | cluster basicStats diskFetches | Count | autoavgcountmaxminsum |
| builtin:tech | cluster count membase | Count | autoavgcountmaxminsum |
| builtin:tech | cluster count memcached | Count | autoavgcountmaxminsum |
| builtin:tech | cluster samples cmd_get | Per second | autoavgcountmaxminsum |
| builtin:tech | cluster samples cmd_set | Per second | autoavgcountmaxminsum |
| builtin:tech | cluster samples curr_items | Count | autoavgcountmaxminsum |
| builtin:tech | cluster samples ep_cache_miss_rate | Percent (%) | autoavgcountmaxminsum |
| builtin:tech | cluster samples ep_num_value_ejects | Per minute | autoavgcountmaxminsum |
| builtin:tech | cluster samples ep_oom_errors | Per second | autoavgcountmaxminsum |
| builtin:tech | cluster samples ep_tmp_oom_errors | Per second | autoavgcountmaxminsum |
| builtin:tech | cluster samples ops | Per second | autoavgcountmaxminsum |
| builtin:tech | cluster samples swap_used | Byte | autoavgcountmaxminsum |
| builtin:tech | cluster status healthy | Count | autoavgcountmaxminsum |
| builtin:tech | cluster status unhealthy | Count | autoavgcountmaxminsum |
| builtin:tech | cluster status warmup | Count | autoavgcountmaxminsum |
| builtin:tech | cluster storageTotals hdd free | Byte | autoavgcountmaxminsum |
| builtin:tech | cluster storageTotals hdd quotaTotal | Byte | autoavgcountmaxminsum |
| builtin:tech | cluster storageTotals hdd total | Byte | autoavgcountmaxminsum |
| builtin:tech | cluster storageTotals hdd used | Byte | autoavgcountmaxminsum |
| builtin:tech | cluster storageTotals hdd usedByData | Byte | autoavgcountmaxminsum |
| builtin:tech | cluster storageTotals ram percentageUsage | Percent (%) | autoavgcountmaxminsum |
| builtin:tech | cluster storageTotals ram quotaTotal | Byte | autoavgcountmaxminsum |
| builtin:tech | cluster storageTotals ram quotaTotalPerNode | Byte | autoavgcountmaxminsum |
| builtin:tech | cluster storageTotals ram quotaUsed | Byte | autoavgcountmaxminsum |
| builtin:tech | cluster storageTotals ram quotaUsedPerNode | Byte | autoavgcountmaxminsum |
| builtin:tech | cluster storageTotals ram total | Byte | autoavgcountmaxminsum |
| builtin:tech | cluster storageTotals ram used | Byte | autoavgcountmaxminsum |
| builtin:tech | cluster storageTotals ram usedByData | Byte | autoavgcountmaxminsum |
| builtin:tech | liveview basicStats diskFetches | Count | autoavgcountmaxminsum |
| builtin:tech | liveview basicStats diskUsed | Byte | autoavgcountmaxminsum |
| builtin:tech | liveview basicStats memUsed | Byte | autoavgcountmaxminsum |
| builtin:tech | liveview samples cmd_get | Per second | autoavgcountmaxminsum |
| builtin:tech | liveview samples cmd_set | Per second | autoavgcountmaxminsum |
| builtin:tech | liveview samples couch_docs_data_size | Byte | autoavgcountmaxminsum |
| builtin:tech | liveview samples couch_total_disk_size | Byte | autoavgcountmaxminsum |
| builtin:tech | liveview samples disk_write_queue | Count | autoavgcountmaxminsum |
| builtin:tech | liveview samples ep_cache_miss_rate | Per second | autoavgcountmaxminsum |
| builtin:tech | liveview samples ep_mem_high_wat | Byte | autoavgcountmaxminsum |
| builtin:tech | liveview samples ep_num_value_ejects | Per minute | autoavgcountmaxminsum |
| builtin:tech | liveview samples ops | Per second | autoavgcountmaxminsum |
Custom device
| Metric key | Name and description | Unit | Aggregations |
|---|---|---|---|
| builtin:tech | Custom Device Count | Count | autovalue |
Elastic search
| Metric key | Name and description | Unit | Aggregations |
|---|---|---|---|
| builtin:tech | Documents count | Count | autoavgcountmaxminsum |
| builtin:tech | Deleted documents | Count | autoavgcountmaxminsum |
| builtin:tech | Field data evictions | Count | autoavgcountmaxminsum |
| builtin:tech | Field data size | Byte | autoavgcountmaxminsum |
| builtin:tech | Query cache count | Count | autoavgcountmaxminsum |
| builtin:tech | Query cache size | Byte | autoavgcountmaxminsum |
| builtin:tech | Query cache evictions | Count | autoavgcountmaxminsum |
| builtin:tech | Segment count | Count | autoavgcountmaxminsum |
| builtin:tech | Replica shards | Count | autoavgcountmaxminsum |
| builtin:tech | Indices count | Count | autoavgcountmaxminsum |
| builtin:tech | Active primary shards | Count | autoavgcountmaxminsum |
| builtin:tech | Active shards | Count | autoavgcountmaxminsum |
| builtin:tech | Delayed unassigned shards | Count | autoavgcountmaxminsum |
| builtin:tech | Initializing shards | Count | autoavgcountmaxminsum |
| builtin:tech | Number of data nodes | Count | autoavgcountmaxminsum |
| builtin:tech | Number of nodes | Count | autoavgcountmaxminsum |
| builtin:tech | Relocating shards | Count | autoavgcountmaxminsum |
| builtin:tech | Status green | Count | autoavgcountmaxminsum |
| builtin:tech | Status red | Count | autoavgcountmaxminsum |
| builtin:tech | Status unknown | Count | autoavgcountmaxminsum |
| builtin:tech | Status yellow | Count | autoavgcountmaxminsum |
| builtin:tech | Unassigned shards | Count | autoavgcountmaxminsum |
Generic
| Metric key | Name and description | Unit | Aggregations |
|---|---|---|---|
| builtin:tech | Process group total CPU time during GC suspensions This metric provides statistics about CPU usage for process groups of garbage-collected technologies. The metric value is the sum of CPU time used during garbage collector suspensions for every process (including its workers) in a process group. It has a "Process Group" dimension. | Microsecond | autovalue |
| builtin:tech | Process group total CPU time This metric provides the total CPU time used by a process group. The metric value is the sum of CPU time every process (including its workers) of the process group uses. The result is expressed in microseconds. It can help to identify the most CPU-intensive technologies in the monitored environment. It has a "Process Group" dimension. | Microsecond | autovalue |
| builtin:tech | Process total CPU time during GC suspensions This metric provides statistics about CPU usage for garbage-collected processes. The metric value is the sum of CPU time used during garbage collector suspensions for all process workers. It has a "Process" dimension (dt.entity.process_group_instance). | Microsecond | autovalue |
| builtin:tech | Process total CPU time This metric provides the CPU time used by a process. The metric value is the sum of CPU time every process worker uses. The result is expressed in microseconds. It has a "Process" dimension (dt.entity.process_group_instance). | Microsecond | autovalue |
| builtin:tech | Process CPU usage This metric is the percentage of the CPU usage of a process. The metric value is the sum of CPU time every process worker uses divided by the total available CPU time. The result is expressed in percentage. A value of 100% indicates that the process uses all available CPU resources of the host. | Percent (%) | autoavgmaxmin |
| builtin:tech | z/OS General CPU time The time spent on the general-purpose central processor (GCP) after process start per minute | Second | autoavgcountmaxminsum |
| builtin:tech | z/OS General CPU usage The percent of the general-purpose central processor (GCP) used | Percent (%) | autoavgmaxmin |
| builtin:tech | Process file descriptors used per PID This metric provides the file descriptor usage statistics. It is supported on Linux. The metric value is the highest percentage of the currently used file descriptor limit among process workers. It is sent once per minute with a 10-second granularity - (six samples are aggregated every minute). It offers two dimensions: "Process" ( | Percent (%) | autoavgmaxmin |
| builtin:tech | autoavgmaxmin | ||
| builtin:tech | Process file descriptors max This metric provides statistics about the file descriptor resource limits. It is supported on Linux. The metric value is the total limit of file descriptors that all process workers can open. It is sent once per minute with a 10-second granularity - (six samples are aggregated every minute). | Count | autoavgmaxmin |
| builtin:tech | Process file descriptors used This metric provides statistics about file descriptor usage. It is supported on Linux. The metric value is the total number of file descriptors all process workers have opened. You can use it to detect processes that may cause the system to reach the limit of open file descriptors. | Count | autoavgmaxmin |
| builtin:tech | Process I/O read bytes This metric provides statistics about the I/O read operations of a process. The metric value is a sum of I/O bytes read from the storage layer by all process workers per second. High values help to identify bottlenecks reducing process performance caused by the slow read speed of the storage device. | Byte | autoavgmaxmin |
| builtin:tech | Process I/O bytes total This metric provides statistics about I/O operations for a process. The metric value is a sum of I/O bytes read and written by all process workers per second. | Byte | autovalue |
| builtin:tech | Process I/O write bytes This metric provides statistics about the I/O write operations of a process. The metric value is a sum of I/O bytes written to the storage layer by all process workers per second. High values help to identify bottlenecks reducing process performance caused by the slow write speed of the storage device. | Byte | autoavgmaxmin |
| builtin:tech | Process I/O requested read bytes This metric provides statistics about the I/O read operations a process requests. It is supported only on Linux and AIX. The metric value is a sum of I/O bytes requested to be read from the storage by worker processes per second. It includes additional read operations, such as terminal I/O. It does not indicate the actual disk I/O operations, as some parts of the read operation might have been satisfied from the page cache. | Byte | autoavgmaxmin |
| builtin:tech | Process I/O requested write bytes This metric provides statistics about the I/O write operations a process requests. It is supported on Linux and AIX. The metric value is a sum of I/O bytes requested to be written to the storage by PGI processes per second. It includes additional write operations, such as terminal I/O. It does not indicate the actual disk I/O operations, as some parts of the write operation might have been satisfied from the page cache. | Byte | autoavgmaxmin |
| builtin:tech | Process memory usage This metric is the percentage of memory used by a process. It helps to identify processes with high memory resource consumption and memory leaks. The metric value is the sum of the memory used by every process worker divided by the total available memory in the host. | Percent (%) | autoavgmaxmin |
| builtin:tech | Process memory usage This metric is the percentage of memory used by a process. It helps to identify processes with high memory resource consumption and memory leaks. The metric value is the sum of the memory used by every process worker divided by the total available memory in the host. | Percent (%) | autoavgmaxmin |
| builtin:tech | Process resource exhausted memory counter This metric is a count of "Memory resource exhausted" events for a process. The metric value is the number of events all process workers generated in a minute. JVM generates the memory resource exhausted events when it is out of memory. This metric helps to identify Java processes with excessive memory usage. | Count | autovalue |
| builtin:tech | Process page faults counter This metric is the rate of page faults for a process. The metric value is the sum of page faults per time unit of every process worker. A page fault occurs when the process attempts to access a memory block not stored in the RAM, which means that the block has to be identified in the virtual memory and then loaded from the storage. Lower values are better. A high number of page faults may indicate reduced performance due to insufficient memory size. | Per second | autoavgmaxmin |
| builtin:tech | Process memory This metric is the memory usage of a process. It helps to identify processes with high memory resource consumption and memory leaks. The metric value represents the sum of every process worker's used memory size (including shared memory). | Byte | autoavgmaxmin |
| builtin:tech | Retransmission base received Number of retransmitted packets base received per second on host | Per second | autoavgmaxmin |
| builtin:tech | Retransmission base received Number of retransmitted packets base received per second | Per second | autoavgmaxmin |
| builtin:tech | Retransmission base sent Number of retransmitted packets base sent per second on host | Per second | autoavgmaxmin |
| builtin:tech | Retransmission base sent Number of retransmitted packets base sent per second | Per second | autoavgmaxmin |
| builtin:tech | Retransmitted packets received Number of retransmitted packets received per second on host | Per second | autoavgmaxmin |
| builtin:tech | Retransmitted packets received Number of retransmitted packets received per second | Per second | autoavgmaxmin |
| builtin:tech | Retransmitted packets sent Number of retransmitted packets base sent per second on host | Per second | autoavgmaxmin |
| builtin:tech | Retransmitted packets Number of retransmitted packets sent per second | Per second | autoavgmaxmin |
| builtin:tech | Packet retransmissions Packet retransmissions percent | Percent (%) | autoavgmaxmin |
| builtin:tech | Incoming packet retransmissions Incoming packet retransmissions percent | Percent (%) | autoavgmaxmin |
| builtin:tech | Outgoing packet retransmissions Outgoing packet retransmissions percent | Percent (%) | autoavgmaxmin |
| builtin:tech | Packets received Number of packets received per second | Per second | autoavgmaxmin |
| builtin:tech | Packets sent Number of packets sent per second | Per second | autoavgmaxmin |
| builtin:tech | TCP connectivity Percentage of successfully established TCP sessions | Percent (%) | autoavgmaxmin |
| builtin:tech | New session received Number of new incoming TCP sessions per second | Per second | autoavgmaxmin |
| builtin:tech | New session received Number of new sessions received per second | Per second | autoavgmaxmin |
| builtin:tech | New session received Number of new sessions received per second on localhost | Per second | autoavgmaxmin |
| builtin:tech | Session reset received Number of incoming TCP sessions with reset error per second | Per second | autoavgmaxmin |
| builtin:tech | Session reset received Number of session resets received per second | Per second | autoavgmaxmin |
| builtin:tech | Session reset received Number of session resets received per second on localhost | Per second | autoavgmaxmin |
| builtin:tech | Session timeout received Number of incoming TCP sessions with timeout error per second | Per second | autoavgmaxmin |
| builtin:tech | Session timeout received Number of session timeouts received per second | Per second | autoavgmaxmin |
| builtin:tech | Session timeout received Number of session timeouts received per second on localhost | Per second | autoavgmaxmin |
| builtin:tech | Traffic Summary of incoming and outgoing network traffic | bit | autovalue |
| builtin:tech | Traffic in Incoming network traffic at PGI | bit | autoavgmaxmin |
| builtin:tech | Traffic out Outgoing network traffic from PGI | bit | autoavgmaxmin |
| builtin:tech | Bytes received Number of bytes received per second | Byte | autoavgmaxmin |
| builtin:tech | Bytes sent Number of bytes sent per second | Byte | autoavgmaxmin |
| builtin:tech | Ack-round-trip time Average latency between outgoing TCP data and ACK | Millisecond | autoavgmaxmin |
| builtin:tech | Requests Number of requests per second | Per second | autoavgmaxmin |
| builtin:tech | Server responsiveness Server responsiveness in microseconds | Microsecond | autoavgcountmaxmedianminpercentilesum |
| builtin:tech | Round-trip time Average TCP session handshake RTT | Millisecond | autoavgmaxmin |
| builtin:tech | Throughput Used network bandwidth | Byte | autoavgmaxmin |
| builtin:tech | Process count per process group This metric provides the number of processes in a process group. It can tell how many instances of the technology are running in the monitored environment. It has a "Process Group" dimension. | Count | autovalue |
| builtin:tech | Worker processes This metric is the number of process workers. Too few worker processes may lead to performance degradation, while too many may waste available resources. Configuration of workers should be suitable for the average workload and be able to scale up with higher demand. | Count | autoavgmaxmin |
| builtin:tech | Process resource exhausted threads counter This metric is a count of "Thread resource exhausted" events for a process. The metric value is the number of events all process workers generated in a minute. JVM generates the thread resource exhausted events when it cannot create a new thread. This metric helps to identify Java processes with excessive memory usage. | Count | autovalue |
| builtin:tech | z/OS zIIP time The time spent on the system z integrated information processor (zIIP) after process start per minute | Second | autoavgcountmaxminsum |
| builtin:tech | z/OS zIIP eligible time The zIIP eligible time spent on the general-purpose central processor (GCP) after process start per minute | Second | autoavgcountmaxminsum |
Go
| Metric key | Name and description | Unit | Aggregations |
|---|---|---|---|
| builtin:tech | Go: 502 responses The number of responses that indicate invalid service responses produced by an application. | Count | autovalue |
| builtin:tech | Go: Response latency The average response time from the application to clients. | Millisecond | autoavgmaxmin |
| builtin:tech | Go: 5xx responses The number of responses that indicate repeatedly crashing apps or response issues from applications. | Count | autovalue |
| builtin:tech | Go: Total requests The number of all requests representing the overall traffic flow. | Count | autovalue |
| builtin:tech | Go: Heap idle size The amount of memory not assigned to the heap or stack. Idle memory can be returned to the operating system or retained by the Go runtime for later reassignment to the heap or stack. | Byte | autoavgmaxmin |
| builtin:tech | Go: Heap live size The amount of memory considered live by the Go garbage collector. This metric accumulates memory retained by the most recent garbage collector run and allocated since then. | Byte | autoavgmaxmin |
| builtin:tech | Go: Heap allocated Go objects count The number of Go objects allocated on the Go heap. | Count | autoavgmaxmin |
| builtin:tech | Go: Committed memory The amount of memory committed to the Go runtime heap. | Byte | autoavgmaxmin |
| builtin:tech | Go: Used memory The amount of memory used by the Go runtime heap. | Byte | autoavgmaxmin |
| builtin:tech | Go: Garbage collector invocation count The number of Go garbage collector runs. | Count | autovalue |
| builtin:tech | Go: Go to C language (cgo) call count The number of Go to C language (cgo) calls. | Count | autovalue |
| builtin:tech | Go: Go runtime system call count The number of system calls executed by the Go runtime. This number doesn't include system calls performed by user code. | Count | autovalue |
| builtin:tech | Go: Average number of active Goroutines The average number of active Goroutines. | Count | autoavgmaxmin |
| builtin:tech | Go: Average number of inactive Goroutines The average number of inactive Goroutines. | Count | autoavgmaxmin |
| builtin:tech | Go: Application Goroutine count The number of Goroutines instantiated by the user application. | Count | autoavgmaxmin |
| builtin:tech | Go: System Goroutine count The number of Goroutines instantiated by the Go runtime. | Count | autoavgmaxmin |
| builtin:tech | Go: Worker thread count The number of operating system threads instantiated to execute Goroutines. Go doesn't terminate worker threads; it keeps them in a parked state for future reuse. | Count | autoavgmaxmin |
| builtin:tech | Go: Parked worker thread count The number of worker threads parked by Go runtime. A parked worker thread doesn't consume CPU cycles until the Go runtime unparks the thread. | Count | autoavgmaxmin |
| builtin:tech | Go: Out-of-work worker thread count The number of worker threads whose associated scheduling context has no more Goroutines to execute. When this happens, the worker thread attempts to steal Goroutines from another scheduling context or the global run queue. If the stealing fails, the worker thread parks itself after some time. This same mechanism applies to a high workload scenario. When an idle scheduling context exists, the Go runtime unparks a parked worker thread and associates it with the idle scheduling context. The unparked worker thread is now in the 'out of work' state and starts Goroutine stealing. | Count | autoavgmaxmin |
| builtin:tech | Go: Idle scheduling context count The number of scheduling contexts that have no more Goroutines to execute and for which Goroutine acquisition from the global run queue or other scheduling contexts has failed. | Count | autoavgmaxmin |
| builtin:tech | Go: Global Goroutine run queue size The number of Goroutines in the global run queue. Goroutines are placed in the global run queue if the worker thread used to execute a blocking system call can't acquire a scheduling context. Scheduling contexts periodically acquire Goroutines from the global run queue. | Count | autoavgmaxmin |
JVM
| Metric key | Name and description | Unit | Aggregations |
|---|---|---|---|
| builtin:tech | JVM loaded classes The number of classes that are currently loaded in the Java virtual machine, https://dt-url.net/l2c34jw | Count | autoavgmaxmin |
| builtin:tech | JVM total number of loaded classes The total number of classes that have been loaded since the Java virtual machine has started execution, https://dt-url.net/d0y347x | Count | autoavgmaxmin |
| builtin:tech | JVM unloaded classes The total number of classes unloaded since the Java virtual machine has started execution, https://dt-url.net/d7g34bi | Count | autoavgmaxmin |
| builtin:tech | Garbage collection total activation count The total number of collections that have occurred for all pools, https://dt-url.net/oz834vd | Count | autovalue |
| builtin:tech | Garbage collection total collection time The approximate accumulated collection elapsed time in milliseconds for all pools, https://dt-url.net/oz834vd | Millisecond | autovalue |
| builtin:tech | Garbage collection suspension time Time spent in milliseconds between GC pause starts and GC pause ends, https://dt-url.net/zj434js | Percent (%) | autoavgmaxmin |
| builtin:tech | Garbage collection count The total number of collections that have occurred in that pool, https://dt-url.net/z9034yg | Count | autovalue |
| builtin:tech | Garbage collection time The approximate accumulated collection elapsed time in milliseconds in that pool, https://dt-url.net/z9034yg | Millisecond | autovalue |
| builtin:tech | JVM heap memory pool committed bytes The amount of memory (in bytes) that is guaranteed to be available for use by the Java virtual machine, https://dt-url.net/1j034o0 | Byte | autoavgmaxmin |
| builtin:tech | JVM heap memory max bytes The maximum amount of memory (in bytes) that can be used for memory management, https://dt-url.net/1j034o0 | Byte | autoavgmaxmin |
| builtin:tech | JVM heap memory pool used bytes The amount of memory currently used by the memory pool (in bytes), https://dt-url.net/1j034o0 | Byte | autoavgmaxmin |
| builtin:tech | JVM runtime free memory An approximation to the total amount of memory currently available for future allocated objects, measured in bytes, https://dt-url.net/2mm34yx | Byte | autoavgmaxmin |
| builtin:tech | JVM runtime max memory The maximum amount of memory that the virtual machine will attempt to use, measured in bytes, https://dt-url.net/lzq34mm | Byte | autoavgmaxmin |
| builtin:tech | JVM runtime total memory The total amount of memory currently available for current and future objects, measured in bytes, https://dt-url.net/otu34eo | Byte | autoavgmaxmin |
| builtin:tech | Process memory allocation bytes | Byte | autovalue |
| builtin:tech | Process memory allocation objects count | Count | autovalue |
| builtin:tech | Process memory survived objects bytes | Byte | autovalue |
| builtin:tech | Process memory survived objects count | Count | autovalue |
| builtin:tech | Alive workers | Count | autoavgcountmaxminsum |
| builtin:tech | Alive workers | Count | autoavgcountmaxminsum |
| builtin:tech | Master apps | Count | autoavgcountmaxminsum |
| builtin:tech | Master apps | Count | autoavgcountmaxminsum |
| builtin:tech | Processing time - count | Count | autoavgcountmaxminsum |
| builtin:tech | Processing time - count | Count | autoavgcountmaxminsum |
| builtin:tech | Processing time - mean | Millisecond | autoavgcountmaxminsum |
| builtin:tech | Processing time - mean | Millisecond | autoavgcountmaxminsum |
| builtin:tech | Processing time - one minute rate | Per second | autoavgcountmaxminsum |
| builtin:tech | Processing time - one minute rate | Per second | autoavgcountmaxminsum |
| builtin:tech | Active jobs | Count | autoavgcountmaxminsum |
| builtin:tech | Active jobs | Count | autoavgcountmaxminsum |
| builtin:tech | Total jobs | Count | autoavgcountmaxminsum |
| builtin:tech | Total jobs | Count | autoavgcountmaxminsum |
| builtin:tech | Failed stages | Count | autoavgcountmaxminsum |
| builtin:tech | Failed stages | Count | autoavgcountmaxminsum |
| builtin:tech | Running stages | Count | autoavgcountmaxminsum |
| builtin:tech | Running stages | Count | autoavgcountmaxminsum |
| builtin:tech | Waiting stages | Count | autoavgcountmaxminsum |
| builtin:tech | Waiting stages | Count | autoavgcountmaxminsum |
| builtin:tech | Waiting apps | Count | autoavgcountmaxminsum |
| builtin:tech | Waiting apps | Count | autoavgcountmaxminsum |
| builtin:tech | Master workers | Count | autoavgcountmaxminsum |
| builtin:tech | Master workers | Count | autoavgcountmaxminsum |
| builtin:tech | JVM average number of active threads | Count | autoavgmaxmin |
| builtin:tech | JVM average number of inactive threads | Count | autoavgmaxmin |
| builtin:tech | JVM thread count The current number of live threads including both daemon and non-daemon threads, https://dt-url.net/s02346y | Count | autoavgmaxmin |
| builtin:tech | JVM total CPU time | Millisecond | autovalue |
Kafka
| Metric key | Name and description | Unit | Aggregations |
|---|---|---|---|
| builtin:tech | Kafka broker - Leader election rate | Millisecond | autoavgcountmaxminsum |
| builtin:tech | Kafka broker - Unclean election rate | Per second | autoavgcountmaxminsum |
| builtin:tech | Kafka controller - Active cluster controllers | Count | autoavgcountmaxminsum |
| builtin:tech | Kafka controller - Offline partitions | Count | autoavgcountmaxminsum |
| builtin:tech | Kafka broker - Partitions | Count | autoavgcountmaxminsum |
| builtin:tech | Kafka broker - Under replicated partitions | Count | autoavgcountmaxminsum |
Nettracer
| Metric key | Name and description | Unit | Aggregations |
|---|---|---|---|
| builtin:tech | Bytes received Number of bytes received | Byte | autoavgcountmaxminsum |
| builtin:tech | Bytes transmitted Number of bytes transmitted | Byte | autoavgcountmaxminsum |
| builtin:tech | Retransmitted packets Number of retransmitted packets | Count | autovalue |
| builtin:tech | Packets received Number of packets received | Count | autovalue |
| builtin:tech | Packets transmitted Number of packets transmitted | Count | autovalue |
| builtin:tech | Retransmission Percentage of retransmitted packets | Percent (%) | autoavgmaxmin |
| builtin:tech | Round trip time Round trip time in milliseconds. Aggregates data from active sessions | Millisecond | autoavgcountmaxminsum |
| builtin:tech | Network traffic Summary of incoming and outgoing network traffic in bits per second | bit | autovalue |
| builtin:tech | Incoming traffic Incoming network traffic in bits per second | bit | autovalue |
| builtin:tech | Outgoing traffic Outgoing network traffic in bits per second | bit | autovalue |
Nginx
| Metric key | Name and description | Unit | Aggregations |
|---|---|---|---|
| builtin:tech | Nginx Plus cache free space | MB | autoavgmaxmin |
| builtin:tech | Nginx Plus cache hit ratio | Percent (%) | autoavgmaxmin |
| builtin:tech | Nginx Plus cache hits | Per second | autoavgmaxmin |
| builtin:tech | Nginx Plus cache misses | Per second | autoavgmaxmin |
| builtin:tech | Nginx Plus cache used space | MB | autoavgmaxmin |
| builtin:tech | Active Nginx Plus server zones | Count | autoavgmaxmin |
| builtin:tech | Inactive Nginx Plus server zones | Count | autoavgmaxmin |
| builtin:tech | Nginx Plus server zone requests | Per second | autoavgmaxmin |
| builtin:tech | Nginx Plus server zone traffic in | Byte | autoavgmaxmin |
| builtin:tech | Nginx Plus server zone traffic out | Byte | autoavgmaxmin |
| builtin:tech | Healthy Nginx Plus upstream servers | Count | autoavgmaxmin |
| builtin:tech | Nginx Plus upstream requests | Per second | autoavgmaxmin |
| builtin:tech | Nginx Plus upstream traffic in | Byte | autoavgmaxmin |
| builtin:tech | Nginx Plus upstream traffic out | Byte | autoavgmaxmin |
| builtin:tech | Unhealthy Nginx Plus upstream servers | Count | autoavgmaxmin |
Node.js
| Metric key | Name and description | Unit | Aggregations |
|---|---|---|---|
| builtin:tech | Node.js: Active handles Average number of active handles in the event loop | Count | autoavgmaxmin |
| builtin:tech | Node.js: Event loop tick frequency Average number of event loop iterations (per 10 seconds interval) | Count | autoavgmaxmin |
| builtin:tech | Node.js: Event loop latency Average latency of expected event completion | Nanosecond | autoavgmaxmin |
| builtin:tech | Node.js: Work processed latency Average latency of a work item being enqueued and callback being called | Nanosecond | autoavgmaxmin |
| builtin:tech | Node.js: Event loop tick duration Average duration of an event loop iteration (tick) | Nanosecond | autoavgmaxmin |
| builtin:tech | Node.js: Event loop utilization Event loop utilization represents the percentage of time the event loop has been active | Percent (%) | autoavgmaxmin |
| builtin:tech | Node.js: GC heap used Total size of allocated V8 heap used by application data (post-GC memory snapshot) | Byte | autoavgmaxmin |
| builtin:tech | Node.js: Process Resident Set Size (RSS) Amount of space occupied in the main memory | Byte | autoavgmaxmin |
| builtin:tech | Node.js: V8 heap total Total size of allocated V8 heap | Byte | autoavgmaxmin |
| builtin:tech | Node.js: V8 heap used Total size of allocated V8 heap used by application data (periodic memory snapshot) | Byte | autoavgmaxmin |
| builtin:tech | Node.js: Number of active threads Average number of active Node.js worker threads | Count | autoavgmaxmin |
Oracle Database
| Metric key | Name and description | Unit | Aggregations |
|---|---|---|---|
| builtin:tech | Background CPU usage | Percent (%) | autoavgmaxmin |
| builtin:tech | Foreground CPU usage | Percent (%) | autoavgmaxmin |
| builtin:tech | CPU idle | Percent (%) | autoavgmaxmin |
| builtin:tech | CPU other processes | Percent (%) | autoavgmaxmin |
| builtin:tech | Physical read bytes | Byte | autovalue |
| builtin:tech | Physical write bytes | Byte | autovalue |
| builtin:tech | Total wait time | Microsecond | autovalue |
| builtin:tech | Allocated PGA | Byte | autoavgmaxmin |
| builtin:tech | PGA aggregate Limit | Byte | autoavgmaxmin |
| builtin:tech | PGA aggregate target | Byte | autoavgmaxmin |
| builtin:tech | PGA used for work areas | Percent (%) | autoavgmaxmin |
| builtin:tech | Shared pool free | Percent (%) | autoavgmaxmin |
| builtin:tech | Redo log space wait time | Microsecond | autovalue |
| builtin:tech | Redo size increase | Count | autovalue |
| builtin:tech | Redo write time | Microsecond | autovalue |
| builtin:tech | Buffer cache hit | Percent (%) | autoavgmaxmin |
| builtin:tech | Sorts in memory | Percent (%) | autoavgmaxmin |
| builtin:tech | Time spent on connection management | Microsecond | autovalue |
| builtin:tech | Time spent on other activities | Microsecond | autovalue |
| builtin:tech | PL SQL exec elapsed time | Microsecond | autovalue |
| builtin:tech | SQL exec time | Microsecond | autovalue |
| builtin:tech | Time spent on SQL parsing | Microsecond | autovalue |
| builtin:tech | Active sessions | Count | autoavgmaxmin |
| builtin:tech | All sessions | Count | autoavgmaxmin |
| builtin:tech | User calls count | Count | autovalue |
| builtin:tech | Application wait time | Microsecond | autovalue |
| builtin:tech | Cluster wait time | Microsecond | autovalue |
| builtin:tech | Concurrency wait time | Microsecond | autovalue |
| builtin:tech | CPU time | Microsecond | autovalue |
| builtin:tech | Elapsed time | Microsecond | autovalue |
| builtin:tech | User I/O wait time | Microsecond | autovalue |
| builtin:tech | Buffer gets | Count | autovalue |
| builtin:tech | Direct writes | Count | autovalue |
| builtin:tech | Disk reads | Count | autovalue |
| builtin:tech | Executions | Count | autovalue |
| builtin:tech | Parse calls | Count | autovalue |
| builtin:tech | Rows processed | Count | autovalue |
| builtin:tech | Total space | Byte | autoavgmaxmin |
| builtin:tech | Used space | Byte | autoavgmaxmin |
| builtin:tech | Number of wait events | Count | autovalue |
| builtin:tech | Total wait time | Microsecond | autovalue |
| builtin:tech | Background CPU usage | Percent (%) | autoavgmaxmin |
| builtin:tech | Foreground CPU usage | Percent (%) | autoavgmaxmin |
| builtin:tech | CPU idle | Percent (%) | autoavgmaxmin |
| builtin:tech | CPU other processes | Percent (%) | autoavgmaxmin |
| builtin:tech | Physical read bytes | Byte | autovalue |
| builtin:tech | Physical write bytes | Byte | autovalue |
| builtin:tech | Total wait time | Microsecond | autovalue |
| builtin:tech | Allocated PGA | Byte | autoavgmaxmin |
| builtin:tech | PGA aggregate Limit | Byte | autoavgmaxmin |
| builtin:tech | PGA aggregate target | Byte | autoavgmaxmin |
| builtin:tech | PGA used for work areas | Percent (%) | autoavgmaxmin |
| builtin:tech | Shared pool free | Percent (%) | autoavgmaxmin |
| builtin:tech | Redo log space wait time | Microsecond | autovalue |
| builtin:tech | Redo size increase | Count | autovalue |
| builtin:tech | Redo write time | Microsecond | autovalue |
| builtin:tech | Time spent on connection management | Microsecond | autovalue |
| builtin:tech | Time spent on other activities | Microsecond | autovalue |
| builtin:tech | PL SQL exec elapsed time | Microsecond | autovalue |
| builtin:tech | SQL exec time | Microsecond | autovalue |
| builtin:tech | Time spent on SQL parsing | Microsecond | autovalue |
| builtin:tech | Active sessions | Count | autoavgmaxmin |
| builtin:tech | All sessions | Count | autoavgmaxmin |
| builtin:tech | User calls count | Count | autovalue |
| builtin:tech | Application wait time | Microsecond | autovalue |
| builtin:tech | Cluster wait time | Microsecond | autovalue |
| builtin:tech | Concurrency wait time | Microsecond | autovalue |
| builtin:tech | CPU time | Microsecond | autovalue |
| builtin:tech | Elapsed time | Microsecond | autovalue |
| builtin:tech | User I/O wait time | Microsecond | autovalue |
| builtin:tech | Buffer gets | Count | autovalue |
| builtin:tech | Direct writes | Count | autovalue |
| builtin:tech | Disk reads | Count | autovalue |
| builtin:tech | Executions | Count | autovalue |
| builtin:tech | Parse calls | Count | autovalue |
| builtin:tech | Rows processed | Count | autovalue |
| builtin:tech | Total space | Byte | autoavgmaxmin |
| builtin:tech | Used space | Byte | autoavgmaxmin |
| builtin:tech | Number of wait events | Count | autovalue |
| builtin:tech | Total wait time | Microsecond | autovalue |
| builtin:tech | Buffer cache hit | Percent (%) | autoavgmaxmin |
| builtin:tech | Sorts in memory | Percent (%) | autoavgmaxmin |
PHP
| Metric key | Name and description | Unit | Aggregations |
|---|---|---|---|
| builtin:tech | PHP GC collected count | Count | autoavgcountmaxminsum |
| builtin:tech | PHP GC collection duration | Millisecond | autoavgcountmaxminsum |
| builtin:tech | PHP GC effectiveness | Percent (%) | autoavgcountmaxminsum |
| builtin:tech | PHP OPCache JIT buffer free | Byte | autoavgmaxmin |
| builtin:tech | PHP OPCache JIT buffer size | Byte | autoavgmaxmin |
| builtin:tech | PHP OPCache free memory | Byte | autoavgmaxmin |
| builtin:tech | PHP OPCache used memory | Byte | autoavgmaxmin |
| builtin:tech | PHP OPCache wasted memory | Byte | autoavgmaxmin |
| builtin:tech | PHP OPCache restarts due to lack of keys | Count | autoavgmaxmin |
| builtin:tech | PHP OPCache manual restarts | Count | autoavgmaxmin |
| builtin:tech | PHP OPCache restarts due to out of memory | Count | autoavgmaxmin |
| builtin:tech | PHP OPCache blocklist misses | Count | autoavgmaxmin |
| builtin:tech | PHP OPCache number of cached keys | Count | autoavgmaxmin |
| builtin:tech | PHP OPCache number of cached scripts | Count | autoavgmaxmin |
| builtin:tech | PHP OPCache hits | Count | autoavgmaxmin |
| builtin:tech | PHP OPCache max number of keys | Count | autoavgmaxmin |
| builtin:tech | PHP OPCache misses | Count | autoavgmaxmin |
| builtin:tech | PHP OPCache interned string buffer size | Count | autoavgmaxmin |
| builtin:tech | PHP OPCache number of interned strings | Count | autoavgmaxmin |
| builtin:tech | PHP OPCache interned string memory usage | Byte | autoavgmaxmin |
| builtin:tech | PHP average number of active threads | Count | autoavgmaxmin |
| builtin:tech | PHP average number of inactive threads | Count | autoavgmaxmin |
Python
| Metric key | Name and description | Unit | Aggregations |
|---|---|---|---|
| builtin:tech | Python GC collected items from gen 0 | Count | autoavgmaxmin |
| builtin:tech | Python GC collected items from gen 1 | Count | autoavgmaxmin |
| builtin:tech | Python GC collected items from gen 2 | Count | autoavgmaxmin |
| builtin:tech | Python GC collections number in gen 0 | Count | autoavgmaxmin |
| builtin:tech | Python GC collections number in gen 1 | Count | autoavgmaxmin |
| builtin:tech | Python GC collections number in gen 2 | Count | autoavgmaxmin |
| builtin:tech | Python GC time in gen 0 | Microsecond | autoavgmaxmin |
| builtin:tech | Python GC time in gen 1 | Microsecond | autoavgmaxmin |
| builtin:tech | Python GC time in gen 2 | Microsecond | autoavgmaxmin |
| builtin:tech | Python GC uncollectable items in gen 0 | Count | autoavgmaxmin |
| builtin:tech | Python GC uncollectable items in gen 1 | Count | autoavgmaxmin |
| builtin:tech | Python GC uncollectable items in gen 2 | Count | autoavgmaxmin |
| builtin:tech | Number of memory blocks allocated by Python | Count | autoavgmaxmin |
| builtin:tech | Number of active Python threads | Count | autoavgmaxmin |
RabbitMQ
| Metric key | Name and description | Unit | Aggregations |
|---|---|---|---|
| builtin:tech | cluster channels | Count | autoavgcountmaxminsum |
| builtin:tech | cluster connections | Count | autoavgcountmaxminsum |
| builtin:tech | cluster consumers | Count | autoavgcountmaxminsum |
| builtin:tech | cluster exchanges | Count | autoavgcountmaxminsum |
| builtin:tech | cluster ack messages | Per second | autoavgcountmaxminsum |
| builtin:tech | cluster delivered and get messages | Per second | autoavgcountmaxminsum |
| builtin:tech | cluster published messages | Per second | autoavgcountmaxminsum |
| builtin:tech | cluster ready messages | Count | autoavgcountmaxminsum |
| builtin:tech | cluster redelivered messages | Per second | autoavgcountmaxminsum |
| builtin:tech | cluster unroutable messages | Per second | autoavgcountmaxminsum |
| builtin:tech | cluster unacknowledged messages | Count | autoavgcountmaxminsum |
| builtin:tech | cluster node failed | Count | autoavgcountmaxminsum |
| builtin:tech | cluster node ok | Count | autoavgcountmaxminsum |
| builtin:tech | cluster crashed queues | Count | autoavgcountmaxminsum |
| builtin:tech | cluster queues down | Count | autoavgcountmaxminsum |
| builtin:tech | cluster flow queues | Count | autoavgcountmaxminsum |
| builtin:tech | cluster idle queues | Count | autoavgcountmaxminsum |
| builtin:tech | cluster running queues | Count | autoavgcountmaxminsum |
| builtin:tech | topn ack | Per second | autoavgcountmaxminsum |
| builtin:tech | topn consumers | Count | autoavgcountmaxminsum |
| builtin:tech | topn deliver/get | Per second | autoavgcountmaxminsum |
| builtin:tech | topn ready messages | Count | autoavgcountmaxminsum |
| builtin:tech | topn unacknowledged messages | Count | autoavgcountmaxminsum |
| builtin:tech | topn publish | Per second | autoavgcountmaxminsum |
Ruby
| Metric key | Name and description | Unit | Aggregations |
|---|---|---|---|
| builtin:tech | Ruby GC collection count | Count | autovalue |
| builtin:tech | Ruby GC collection time | Millisecond | autovalue |
| builtin:tech | Ruby MRI allocated heap size | Byte | autoavgmaxmin |
| builtin:tech | Ruby MRI heap free slots | Count | autoavgmaxmin |
| builtin:tech | Ruby MRI heap live slots | Count | autoavgmaxmin |
| builtin:tech | Ruby JVM committed memory | Byte | autoavgmaxmin |
| builtin:tech | Ruby JVM max memory | Byte | autoavgmaxmin |
| builtin:tech | Ruby JVM used memory | Byte | autoavgmaxmin |
| builtin:tech | Number of managed Ruby threads | Count | autoavgmaxmin |
Varnish
| Metric key | Name and description | Unit | Aggregations |
|---|---|---|---|
| builtin:tech | Cache hit ratio | Percent (%) | autoavgmaxmin |
| builtin:tech | Cache hits for passes | Per second | autoavgmaxmin |
| builtin:tech | Cache hits | Per second | autoavgmaxmin |
| builtin:tech | Cache misses | Per second | autoavgmaxmin |
| builtin:tech | Cache passes | Per second | autoavgmaxmin |
| builtin:tech | Backend connections | Per second | autoavgmaxmin |
| builtin:tech | Backend connections failed | Per second | autoavgmaxmin |
| builtin:tech | Backend connections reused | Per second | autoavgmaxmin |
| builtin:tech | Sessions accepted | Per second | autoavgmaxmin |
| builtin:tech | Sessions dropped | Per second | autoavgmaxmin |
| builtin:tech | Sessions queued | Per second | autoavgmaxmin |
| builtin:tech | Threads failed | Per second | autoavgmaxmin |
| builtin:tech | Maximum number of threads | Count | autoavgmaxmin |
| builtin:tech | Minimum number of threads | Count | autoavgmaxmin |
| builtin:tech | Total number of threads | Count | autoavgmaxmin |
| builtin:tech | Requests | Per second | autoavgmaxmin |
| builtin:tech | Traffic | Byte | autoavgmaxmin |
Web server
| Metric key | Name and description | Unit | Aggregations |
|---|---|---|---|
| builtin:tech | Dropped connections Number of dropped connections | Per second | autoavgmaxmin |
| builtin:tech | Handled connections Number of successfully finished and closed requests | Per second | autoavgmaxmin |
| builtin:tech | Reading connections Number of connections which are receiving data from the client | Count | autoavgmaxmin |
| builtin:tech | Socket backlog waiting time Average time needed to queue and handle incoming connections | Microsecond | autovalue |
| builtin:tech | Waiting connections Number of connections with no active requests | Count | autoavgmaxmin |
| builtin:tech | Writing connections Number of connections which are sending data to the client | Count | autoavgmaxmin |
| builtin:tech | Active worker threads Number of active worker threads | Count | autoavgmaxmin |
| builtin:tech | Idle worker threads Number of idle worker threads | Count | autoavgmaxmin |
| builtin:tech | Maximum worker threads Maximum number of worker threads | Count | autoavgmaxmin |
| builtin:tech | Requests Number of requests | Per second | autoavgmaxmin |
| builtin:tech | Traffic Amount of data transferred | Byte | autoavgmaxmin |
WebSphere
| Metric key | Name and description | Unit | Aggregations |
|---|---|---|---|
| builtin:tech | Free pool size | Count | autoavgcountmaxminsum |
| builtin:tech | Percent used | Percent (%) | autoavgcountmaxminsum |
| builtin:tech | Pool size | Count | autoavgcountmaxminsum |
| builtin:tech | In use time | Millisecond | autoavgcountmaxminsum |
| builtin:tech | Wait time | Millisecond | autoavgcountmaxminsum |
| builtin:tech | Number of waiting threads | Count | autoavgcountmaxminsum |
| builtin:tech | Live sessions | Count | autoavgcountmaxminsum |
| builtin:tech | Active threads | Count | autoavgcountmaxminsum |
| builtin:tech | Pool size | Count | autoavgcountmaxminsum |
| builtin:tech | Number of requests | Per second | autoavgcountmaxminsum |
z/OS
| Metric key | Name and description | Unit | Aggregations |
|---|---|---|---|
| builtin:tech | z/OS DB2 CPU usage The percentage of the z/OS DB2 CPU usage | Percent (%) | autoavgcountmaxminsum |
| builtin:tech | z/OS DB2 DBM1 CPU usage The percentage of z/OS DB2 DBM1 CPU usage | Percent (%) | autoavgcountmaxminsum |
| builtin:tech | z/OS DB2 MSTR CPU usage The percentage of the z/OS DB2 MSTR CPU usage | Percent (%) | autoavgcountmaxminsum |
| builtin:tech | z/OS DB2 latch suspension time DB2 latch suspension time in a one-minute interval | Microsecond | autoavgcountmaxminsum |
| builtin:tech | z/OS DB2 active connections The calculated number of active z/OS DB2 connections | Count | autoavgcountmaxminsum |
| builtin:tech | z/OS DB2 active inbound connections The calculated number of z/OS DB2 active inbound connections | Count | autoavgcountmaxminsum |
| builtin:tech | z/OS DB2 active outbound connections The calculated number of z/OS DB2 active outbound connections | Count | autoavgcountmaxminsum |
| builtin:tech | z/OS DB2 cache hits The calculated number of inserts and requests into the dynamic statement cache | Count | autoavgcountmaxminsum |
| builtin:tech | z/OS DB2 SQL close The number of z/OS DB2 SQL close statements in a one-minute interval | Count | autoavgcountmaxminsum |
| builtin:tech | z/OS DB2 deadlock The number of z/OS DB2 deadlocks in a one-minute interval | Count | autoavgcountmaxminsum |
| builtin:tech | z/OS DB2 SQL delete The number of z/OS DB2 SQL delete statements in a one-minute interval | Count | autoavgcountmaxminsum |
| builtin:tech | z/OS DB2 EDM pool requests The calculated number of requests made to the z/OS DB2 Environmental Descriptor Manager (EDM) pools | Count | autoavgcountmaxminsum |
| builtin:tech | z/OS DB2 failed connections The calculated number of z/OS DB2 unsuccessful connection attempts | Count | autoavgcountmaxminsum |
| builtin:tech | z/OS DB2 SQL fetch The number of z/OS DB2 SQL fetch statements in a one-minute interval | Count | autoavgcountmaxminsum |
| builtin:tech | z/OS DB2 SQL insert The number of z/OS DB2 SQL insert statements in a one-minute interval | Count | autoavgcountmaxminsum |
| builtin:tech | z/OS DB2 SQL open The number of z/OS DB2 SQL open statements in a one-minute interval | Count | autoavgcountmaxminsum |
| builtin:tech | z/OS DB2 SQL select The number of z/OS DB2 SQL select statements in a one-minute interval | Count | autoavgcountmaxminsum |
| builtin:tech | z/OS DB2 deadlock timeout The number of z/OS DB2 deadlock timeouts in a one-minute interval | Count | autoavgcountmaxminsum |
| builtin:tech | z/OS DB2 SQL update The number of z/OS DB2 SQL update statements in a one-minute interval | Count | autoavgcountmaxminsum |
| builtin:tech | z/OS DB2 ZIIP time The time spent by the z/OS DB2 on z Integrated Information Processor (zIIP) to optimize CPU usage | Second | autoavgcountmaxminsum |
| builtin:tech | z/OS Consumed Service Units per minute The calculated number of consumed Service Units per minute | Count | autoavgcountmaxminsum |