Use logs in context to troubleshoot issues
- Tutorial
- 3-min read
- Published Apr 24, 2023
Introduction
Modern applications run in distributed environments. They generate observability data like metrics, logs and traces. Having all data in one place is often not enough because manual correlation can be required. Understanding the behavior and performance of distributed applications is important for effective troubleshooting. Dynatrace automatically connects and puts data in context for a smooth troubleshooting and analytics experience. This automated approach not only streamlines troubleshooting but also enhances the overall analytics experience, enabling teams to optimize application performance with ease.
Target audience
This article is intended for developers and site reliability engineers (SRE) who are involved in the development, deployment, and maintenance of modern applications. This article shares advice that help developers and SREs make the most of Dynatrace's automated observability tools for smoother troubleshooting and analytics.
Scenario
The SRE is doing proactive health and performance check of the apps running on maintained cluster and learns about errors in logs that are caused by another component.
Prerequisites
Make sure all of these are true before you start:
- Log ingest on Kubernetes;
- Logs enriched with TraceId;
- Knowledge of the Kubernetes Application;
-
- Make sure the following permissions are enabled.
- Grail:
storage:logs:read. For instructions, see Assign permissions in Grail.To access permissions, go to the Settings menu in the upper-right corner of the Workflows app and select Authorization settings.
- You should have the necessary permissions to configure and access monitoring tools within Dynatrace.
- You should have permissions to ingest log data into Dynatrace.
- You can integrate Dynatrace with various bug tracking tools and frameworks used in your pipeline.
Steps
- Go to the Kubernetes application: in the main menu, go to Apps > Application Observability > Kubernetes.
- Navigate to Workloads.
- Select the record of your interest, with problems reported by DavisAI, from the list of workloads.
- Open the Log tab to get an overview of the distribution of logs for the selected workload.
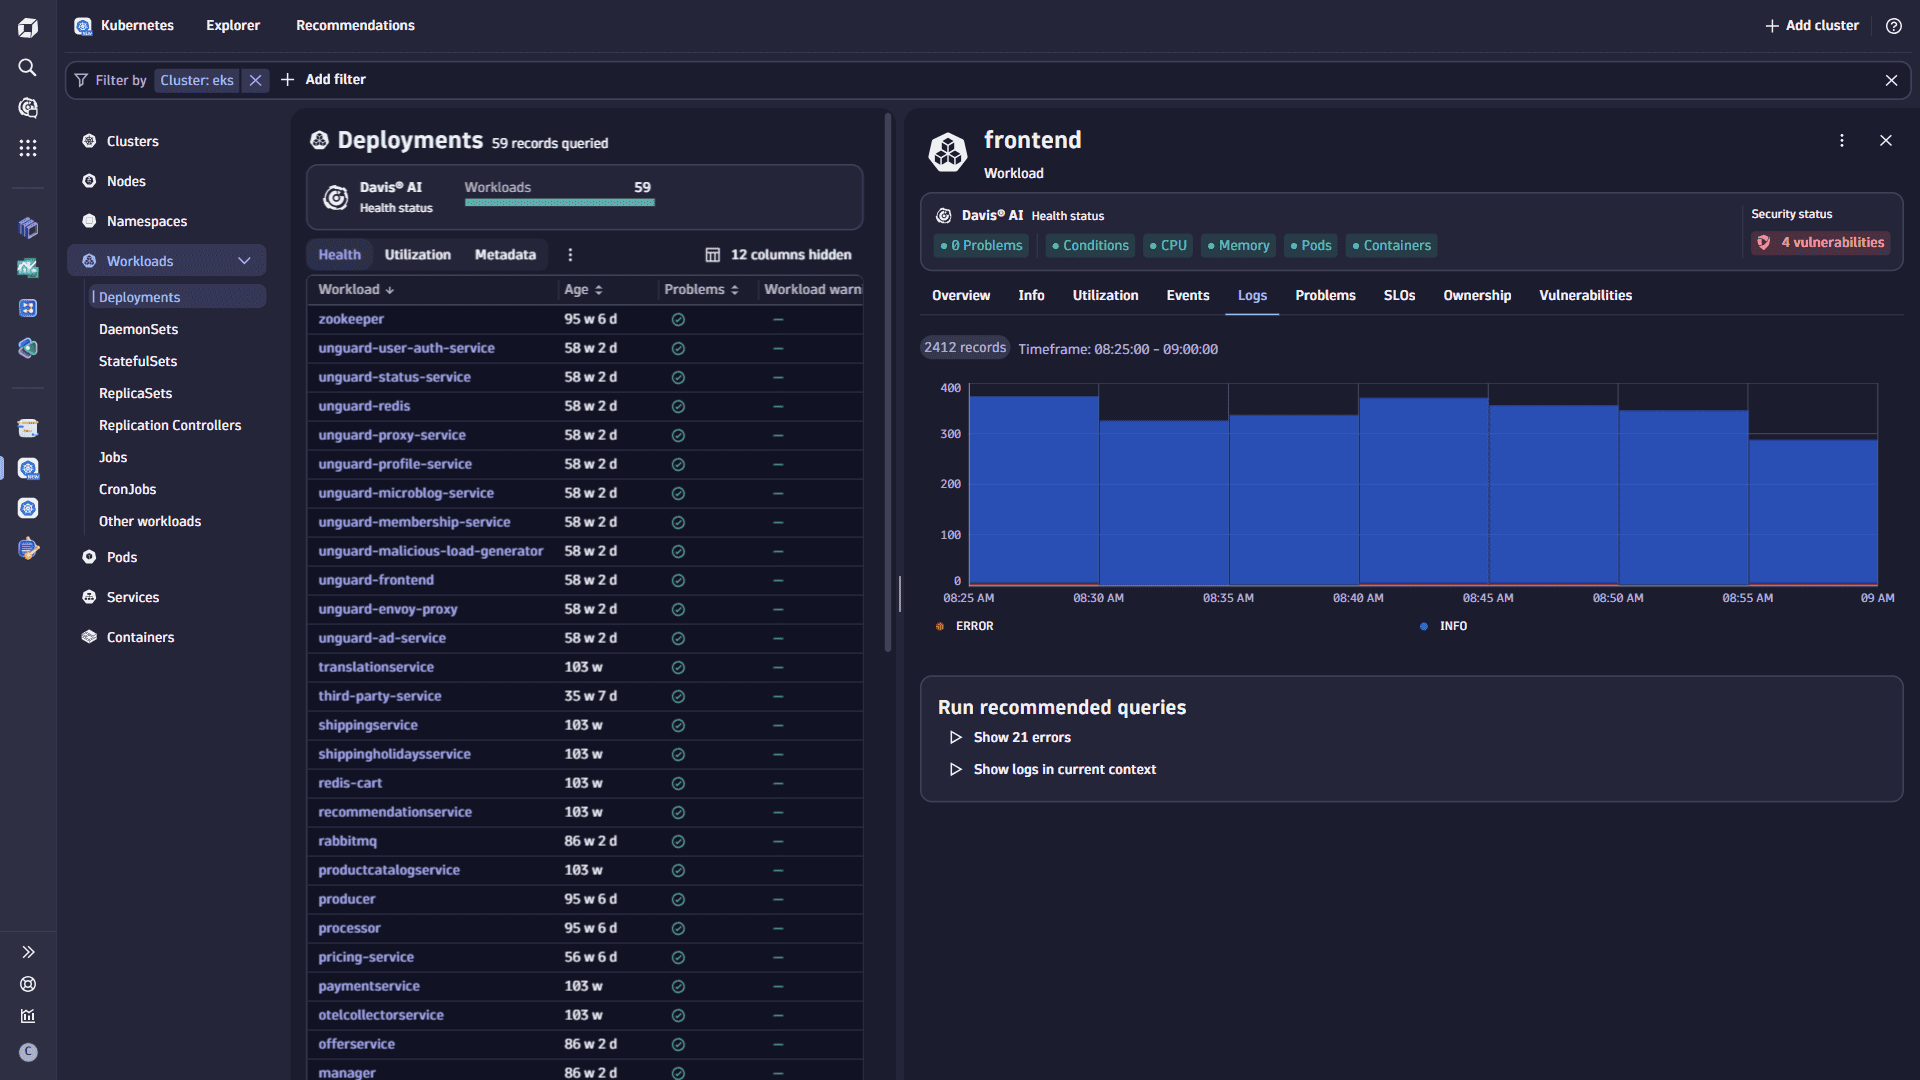
- Select Show errors in the Run recommended queries section, in case you notice errors on the chart. For records that have a Problem, you can select Show logs for problem to see the causes.
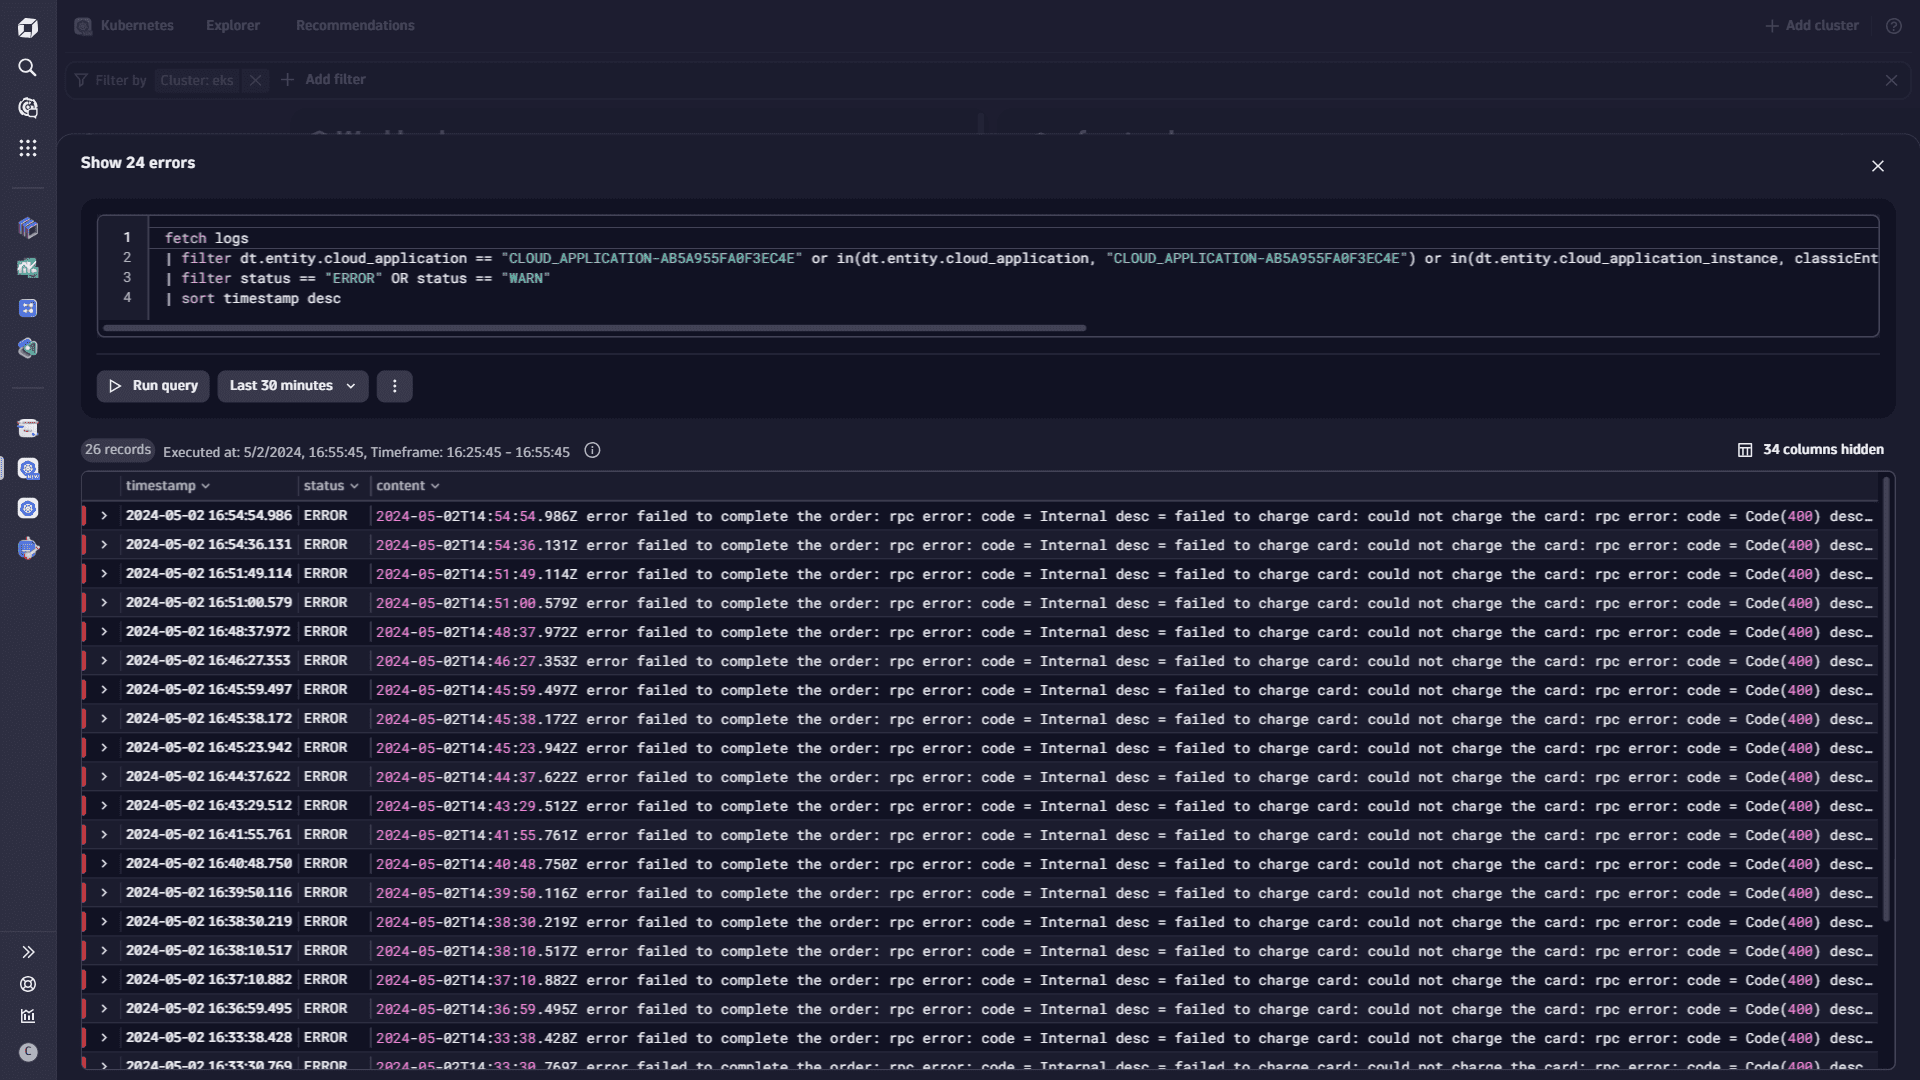
- Select a log record to view the error details.
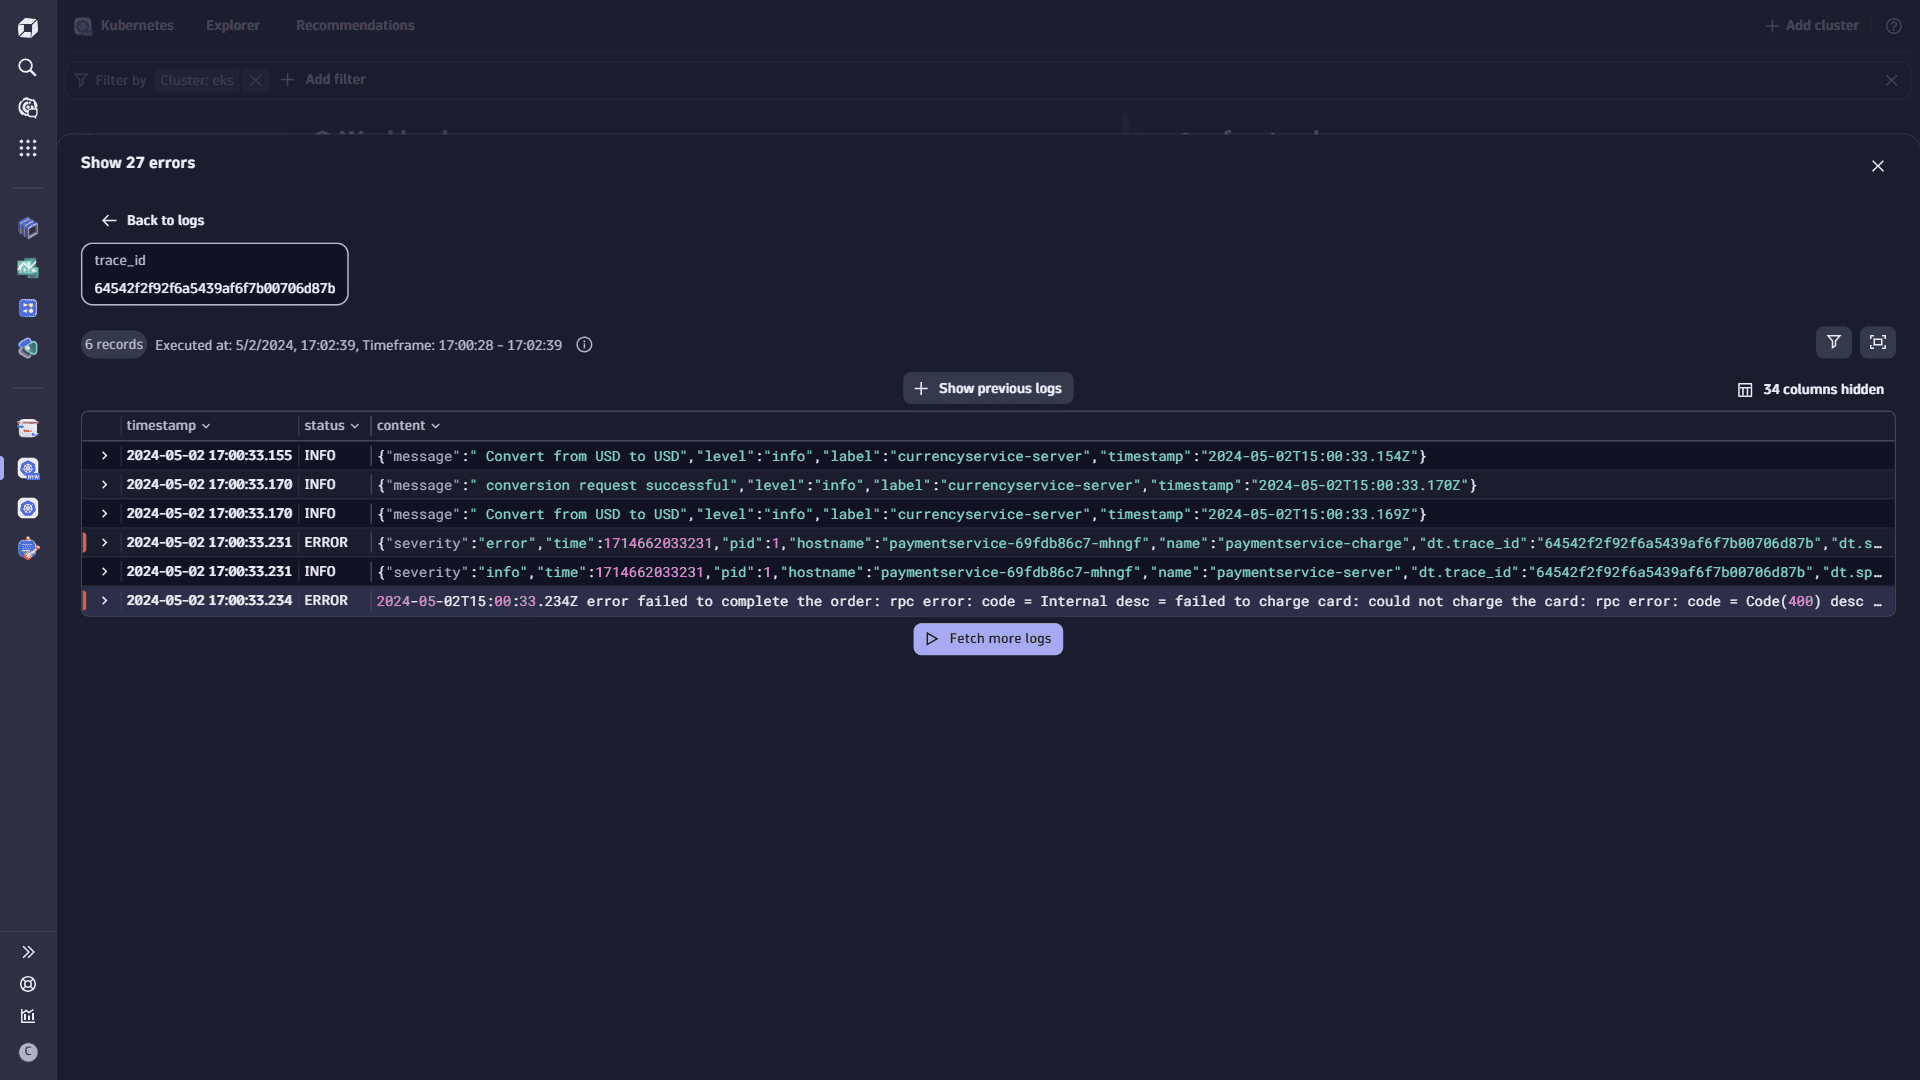
- optional Select Show surrounding logs to gather more information about what caused the error, in case you didn't find what you were looking for, and want to expand your investigation. All the logs in the results are decorated with the same trace_id. Or, you can navigate to a different workload that is of your interest.
- optional Share the investigation results with your team members: back on the logs screen, open the logs with Notebooks: select the ellipsis button, and choose Open with > Notebooks. Here, you can also choose to share the logs notebook with your team: select Share, choose the recipients, and share the notebook.
Conclusion
Thanks to the combination of detailed logs with trace information and a clear understanding of system topology, it’s now much quicker to troubleshoot your distributed applications. This means less time spent searching for the root cause of issues and more time focused on keeping your applications running smoothly. With these insights at hand, developers and site reliability engineers can resolve problems faster, leading to improved user experiences and smoother operations overall.