Segment requests to improve response time degradation
In your environment, there are many thousands of requests, each with their relationships and context. To identify the root cause of inefficiencies, it's therefore necessary to narrow down the analysis to just the relevant requests. You can segment your requests by filtering the service flow or via outlier analysis.
Scenario
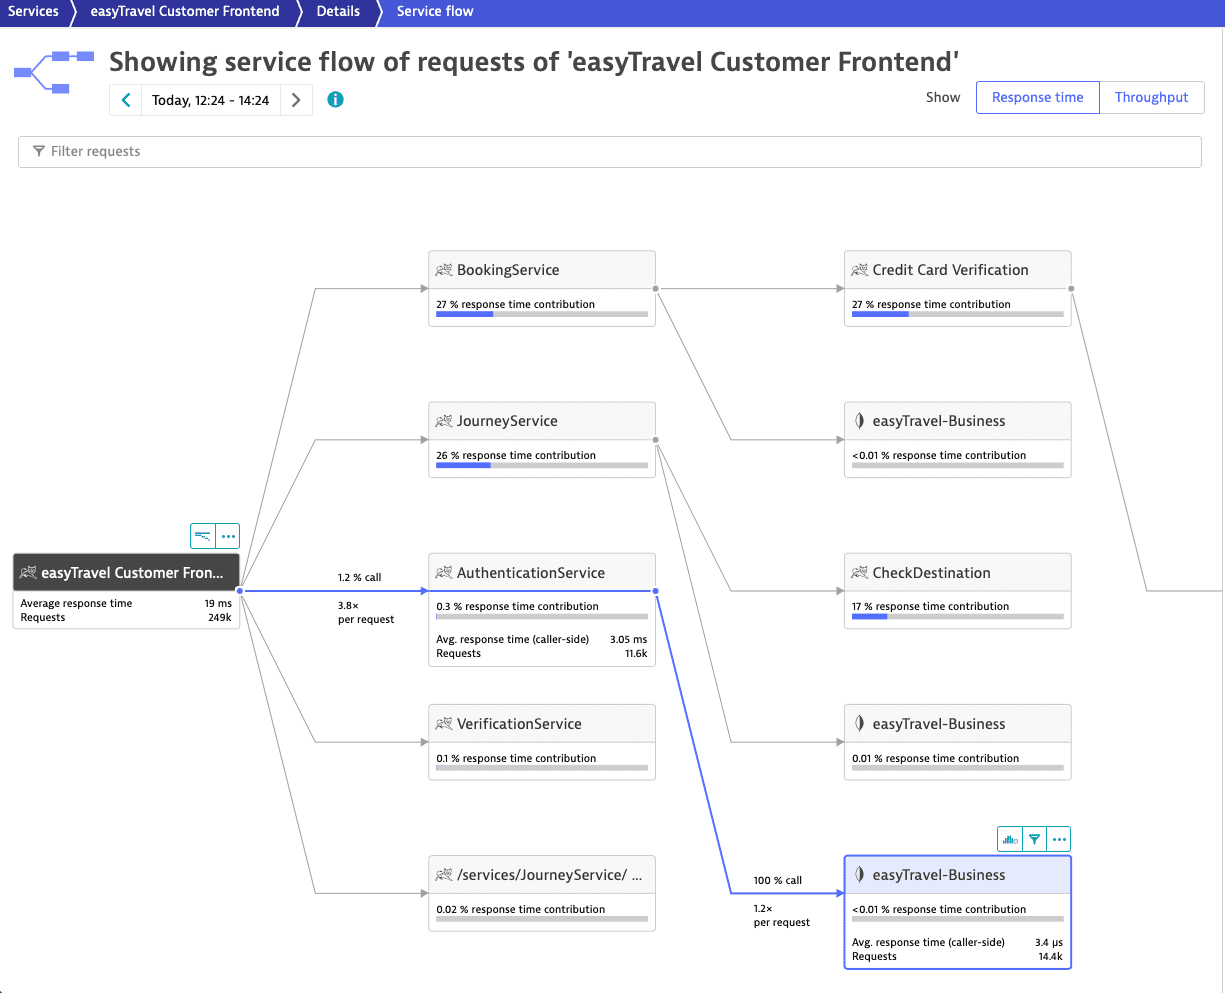
The service easyTravel Customer Frontend received 249,000 requests during the selected 2-hour timeframe. In this example, we want to identify requests with a slow response time for the service.
Steps
-
Start by segmenting the requests via Service flow.
-
To access the service flow
- Go to Services or Services Classic (latest Dynatrace).
- Select the service you want to analyze.
- On the service overview page, under Understand dependencies, select View service flow.
We are interested specifically in the requests from
easyTravel Customer Frontendthat call firstAuthenticationServiceand theneasyTravel-Business. 94% of theeasyTravel Customer Frontendrequests callingAuthenticationServicealso callVerificationService. -
To focus on a subset of requests
-
Select a called service > Apply filter
 .
.
-
To add a service as a second filter parameter, select the service you want to add.

-
-
-
To access the distributed traces list filtered by the set parameters, select the caller service (
easyTravel Customer Frontend) > Distributed traces .
.The Most recent traces list features the requests initiated by
easyTravel Customer Frontendthat match the filter criteria. You can filter the list or sort it by Start time, Name, Response time, Processing time, HTTP method, or Response code. -
To visualize only
easyTravel Customer Frontendrequests with response time slower than or equal to 80 ms- Select the easyTravel Customer Frontend node.
- From the Filter requests list, select Response time.
- Select greater than or equal to ≥, type
80in the input field, and select Apply. - Select Apply.
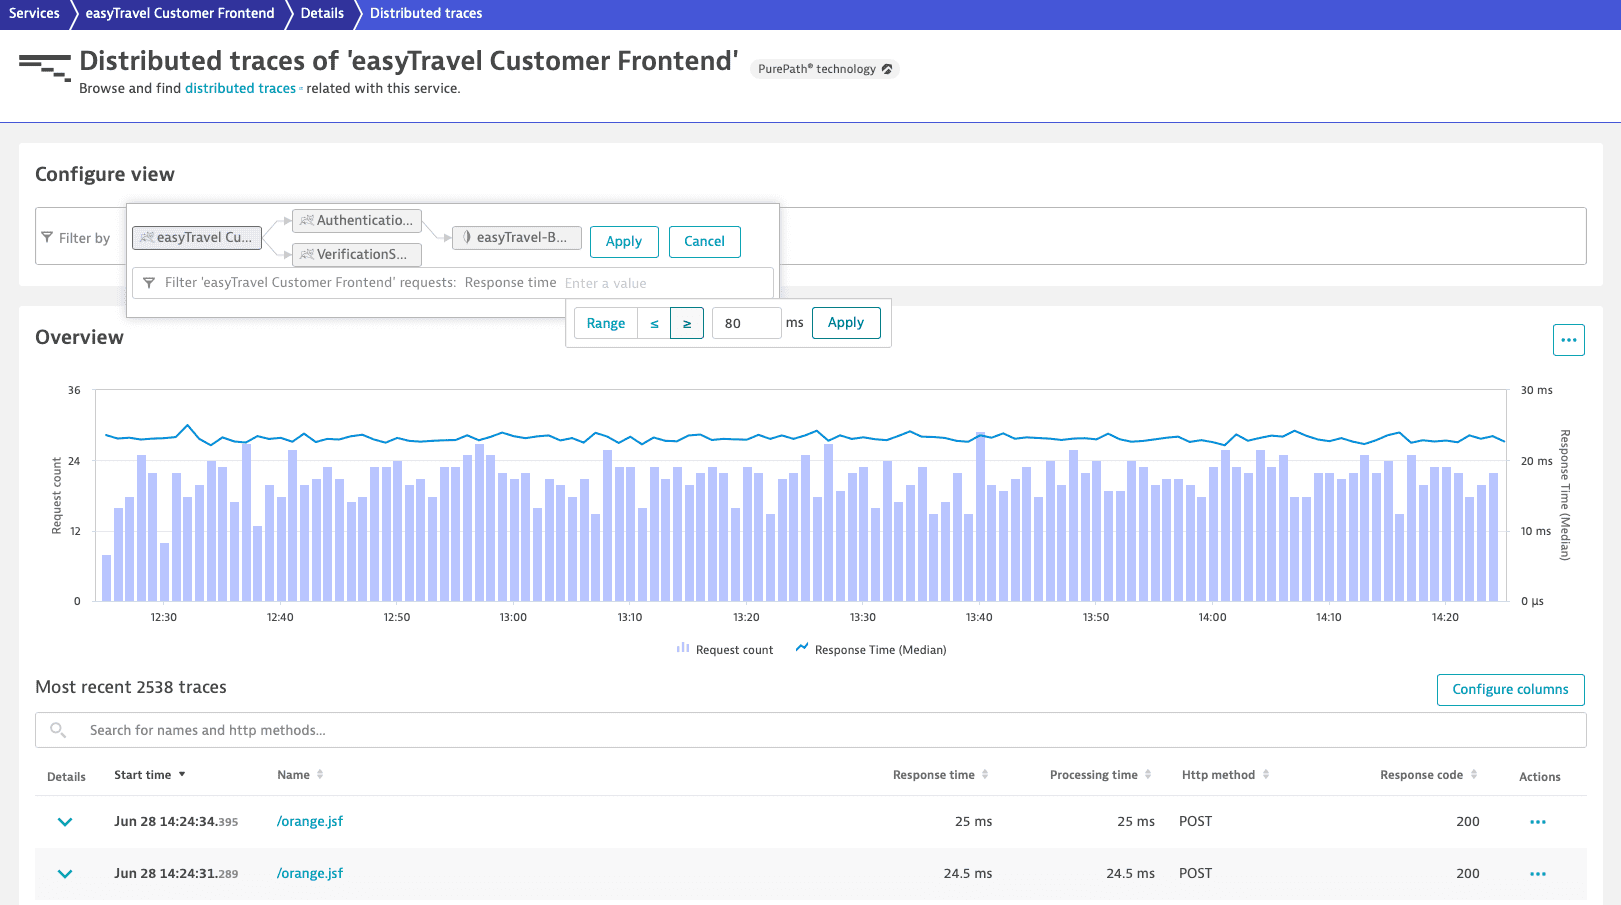
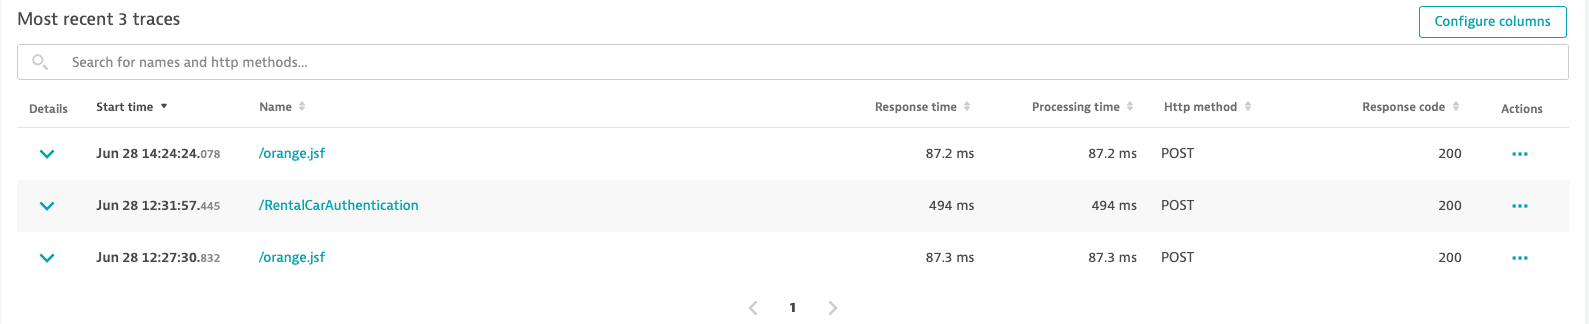
Only 3 requests out of the initial 249,000 justify in-depth distributed trace analysis.
-
Select a trace from the refined list to proceed with its code-level analysis.
Conclusion
By segmenting the requests in easyTravel Customer Frontend service flow and drilling down to only the ones that satisfy our criteria, we narrow down the necessary in-depth analysis from 249,000 to 3 requests for the selected 2-hour timeframe.
You can extend your analysis:
- To see where the request originated, select More (…) > Service backtrace.
- To see the entire trace from the first fully monitored process group, select Show full trace. Each distributed trace tracks a request from start to finish. This means that the traces always start at the first fully monitored process group. With this option, you can change your perspective and focus only on a service.