Manage your monitoring environments
- How-to guide
- 4-min read
You can create and manage your monitoring environments using the Cluster Management Console.
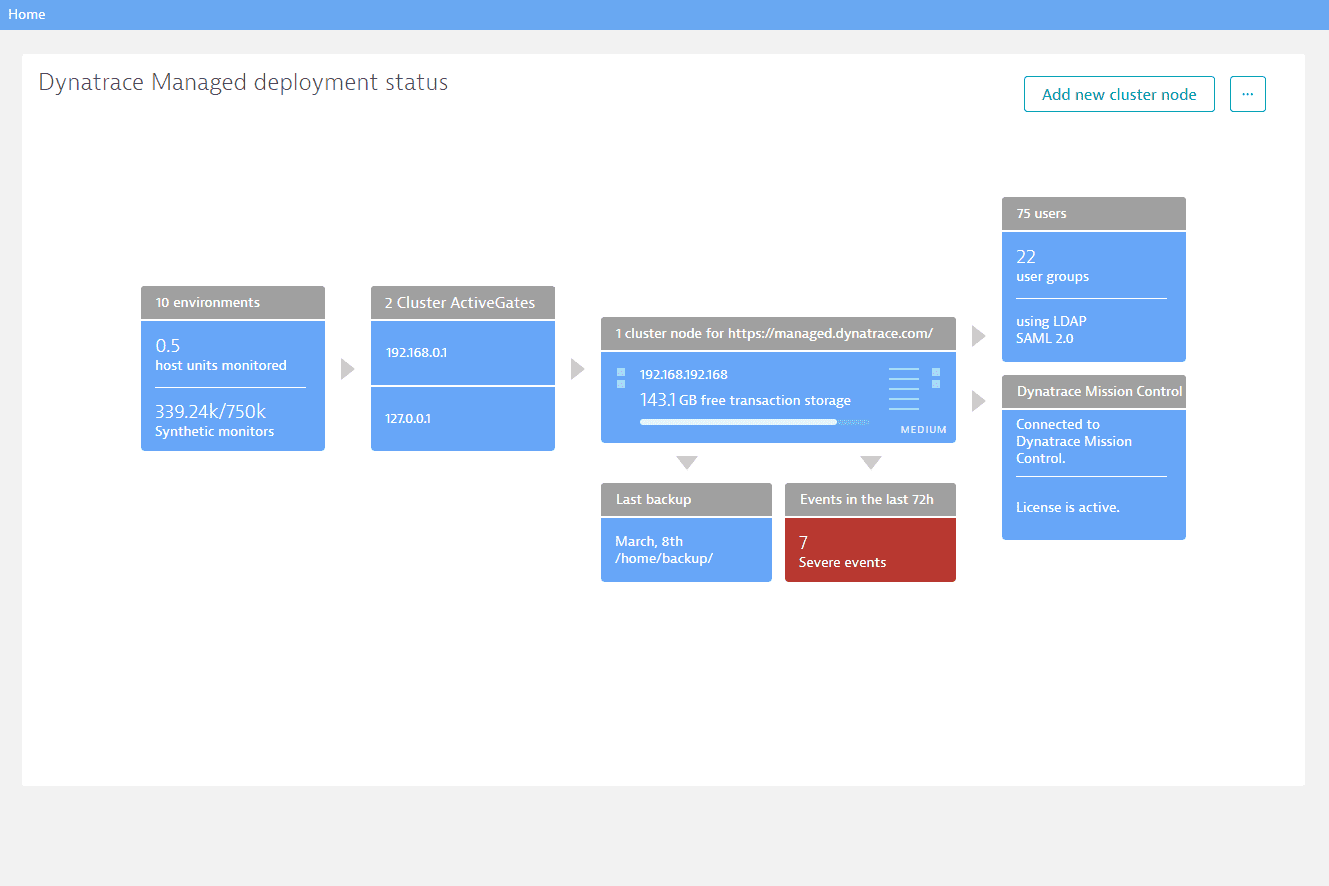
Create an environment
- Go to Environments.
- Select Add another environment.
- In the Environment name text field, enter a name for your environment.
- Optional To disable synthetic monitors, turn off Enable synthetic monitors.
- Select Save.
Configure an environment
After creating an environment and selecting Save, you are directed to the environment’s configuration page. You can, however, access an environment's configuration page at any time. Go to Environments and select the environment you want to configure.
On the configuration page, you can set the total as well as the monthly and annual quotas for your environment.
Total environment quotas
- Host units - The size of a host for licensing purposes (based on the amount of RAM provided by a host). For full-stack monitoring, a host with 16 GB of RAM (or any portion thereof) equates to one host unit. For cloud-infrastructure monitoring, a host with 16 GB of RAM (or any portion thereof) equates to 0.3 of a host unit.
For full details, see How to calculate monitoring consumption. - Custom metrics - Number of unique time series metrics in a 24-hour sliding window.
For full details, see DDUs for metrics.
Monthly and annual quotas
- User sessions - Number of user sessions (that is, real user monitoring sessions) to be monitored per month or year.
For details, see DEM units - Real User Monitoring. - Synthetic monitors - Number of synthetic monitors to be performed per month or year.
For details, see How to calculate monitoring consumption. - Avg. daily log volume - Volume of Log monitoring traffic per month or year.
For details, see How to calculate monitoring consumption.
Also, you can configure the storage settings, which include:
- Transaction storage - Volume of disk space to be reserved for transactions (for example, service calls, call stacks, and SQL statements).
- Symbol files from mobile apps - Amount of storage that can be consumed by the symbol files from mobile apps.
- Service request level retention - Amount of time the disk space for a service request is to be retained.
- Service code level retention - Amount of time the disk space for code-level visibility is to be retained.
- Real user monitoring retention - Amount of time the disk space for user sessions is to be retained.
- Synthetic monitoring retention - Amount of time the disk space for synthetic monitors is to be retained.
- Session Replay retention - Amount of time the disk space for Session Replay data is to be retained.
- Log Monitoring storage - Volume of disk space to be reserved for Log Monitoring.
- Log Monitoring storage retention - Amount of time the specified disk space for Log Monitoring is to be retained.
Once any one of these limits is consumed, the respective monitoring will no longer be available and you'll need to purchase more monitoring. To purchase Dynatrace, contact Dynatrace Sales. Your sales representative will provide you with further details.
Assign environment permissions to user groups
Use these controls to assign environment permissions to defined user groups.
For details, see Role-based permissions (Dynatrace Classic).
Rename an environment
- Go to Environments.
- Select the environment you want to rename.
- Select the small pencil icon next to the environment's name.
- Enter the new name and select the tick mark button.
Disable or delete an environment
- Go to Environments.
- Select the environment you want to disable or delete.
- Open the menu (three dots).
- Select Disable environment or Permanently delete environment.
Access an environment
To access an environment from your Dynatrace Managed administration page, follow these steps.
-
Go to Environments.
-
Select the environment you want to access.
-
Select Go to environment.
The monitoring data related to the selected environment is displayed on your dashboard.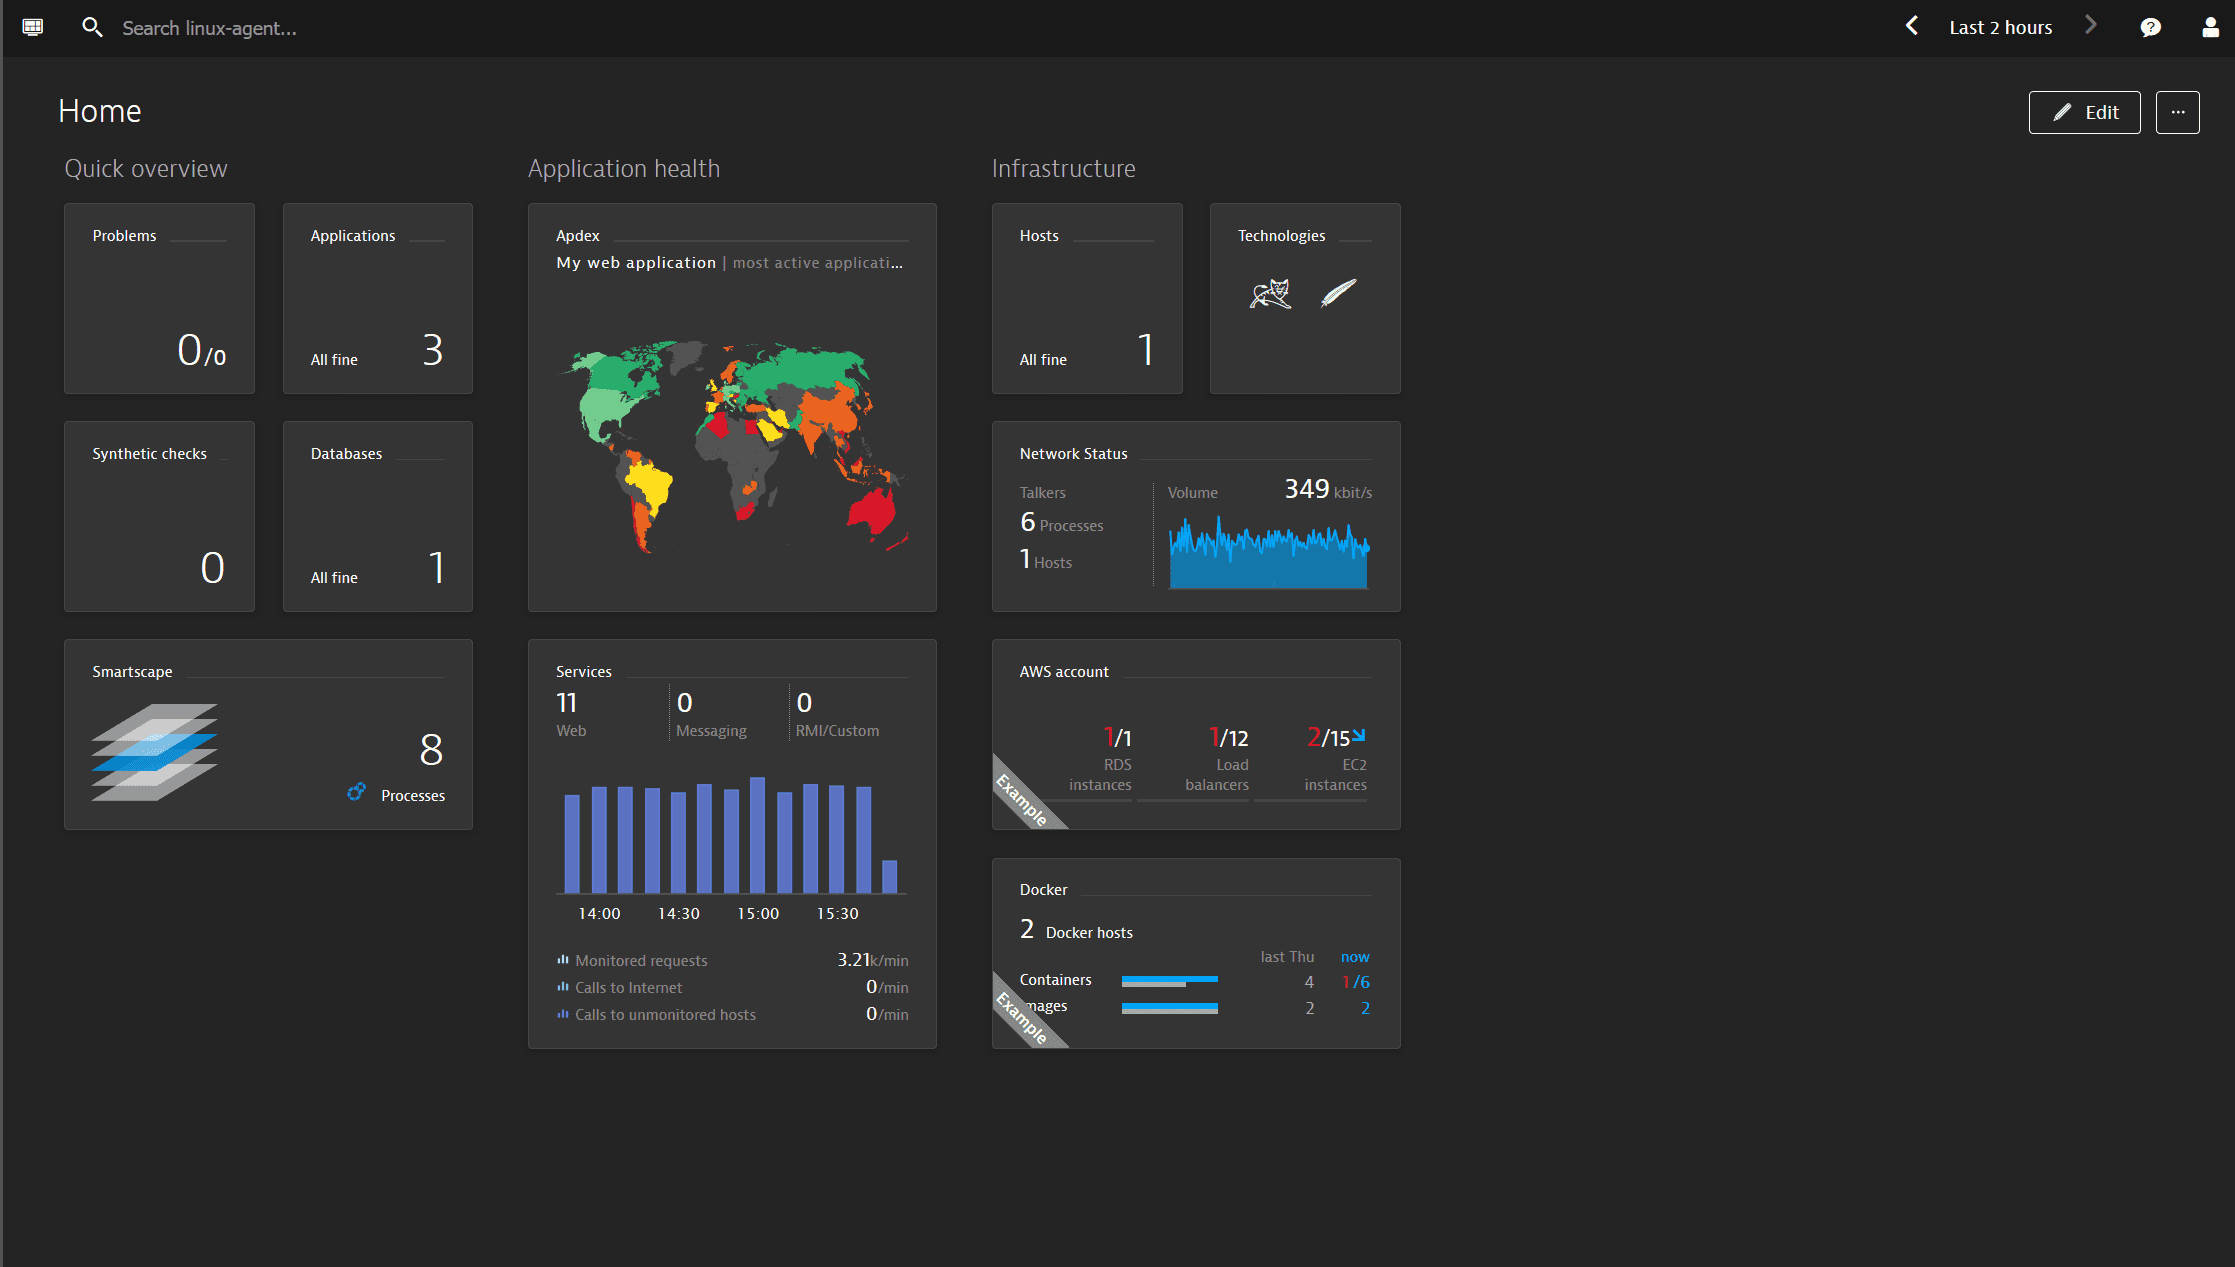 Home dashboard of a monitoring environment with Quick overview, Application health, and Infrastructure sections that show tiles for problems, applications, hosts, and services
To access an environment from your Dynatrace Managed administration page another way, follow these steps.
-
Open the User menu by selecting the User icon.
-
Open the Cluster Management dropdown list.
-
Select the environment you want to access.
To return to your Cluster Management Console at any time, follow these steps.
-
From the dashboard view, open the User menu by selecting the User icon.
-
Select the environment’s name to open the dropdown list.
-
Select Cluster Management.
Switch between environments
To switch between environments from the dashboard view of a specific environment, follow these steps.
- Open the User menu by selecting the User icon.
- Select the environment’s name to open the dropdown list.
- Select another environment you want to access.