Managed deployments
- Explanation
- 5-min read
Dynatrace Managed deployments can evolve from a basic internal setup to a fully integrated enterprise architecture with high availability and automatic recovery. Each stage builds on the previous one, adding components as your requirements grow. Each diagram shows the components involved and the required communication ports at that stage. Arrow direction indicates which component initiates the connection.
For a collective diagram showing all possible connections and ports, see Supported connectivity schemes for ActiveGates.
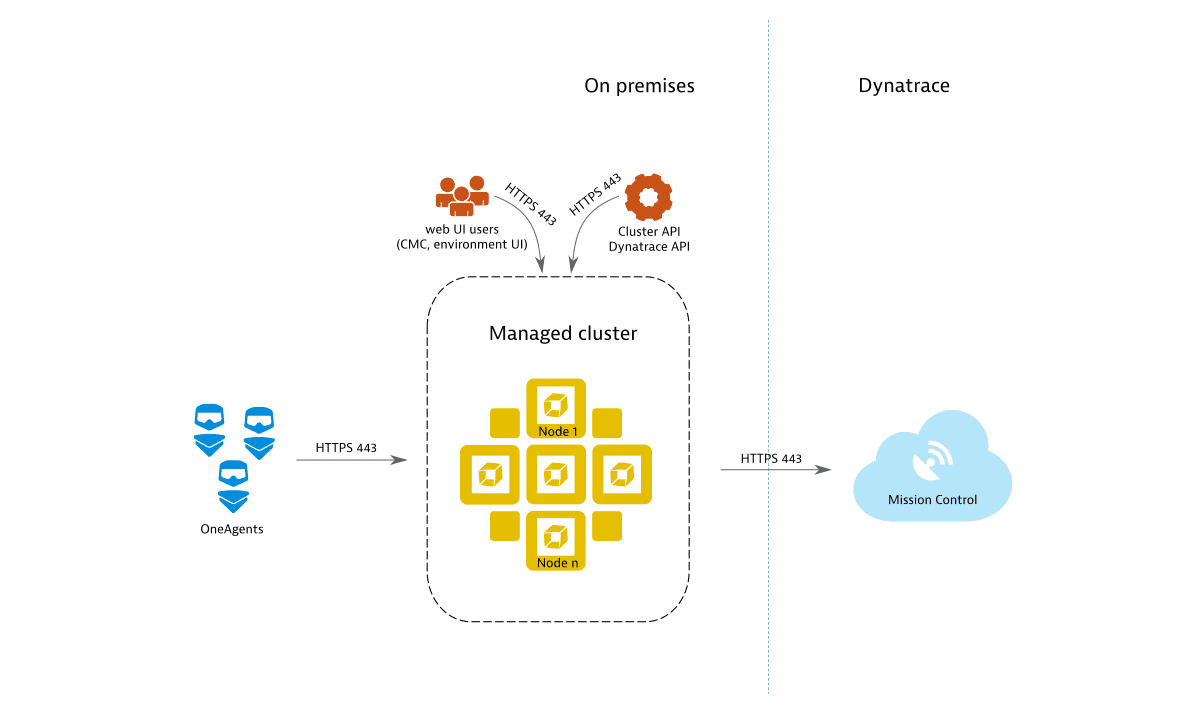
Stage 1: Basic internal setup
Installing Dynatrace Managed with multiple Managed Cluster nodes forms the foundation for all further deployment stages. Without further configuration, a Managed Cluster is only accessible internally and exposes port 443 for the REST API, OneAgent traffic, and web UI access (Cluster Management Console and monitoring environment). By default, remote access to Mission Control is enabled to provide you with proactive support. Each communication channel is secured with TLS.

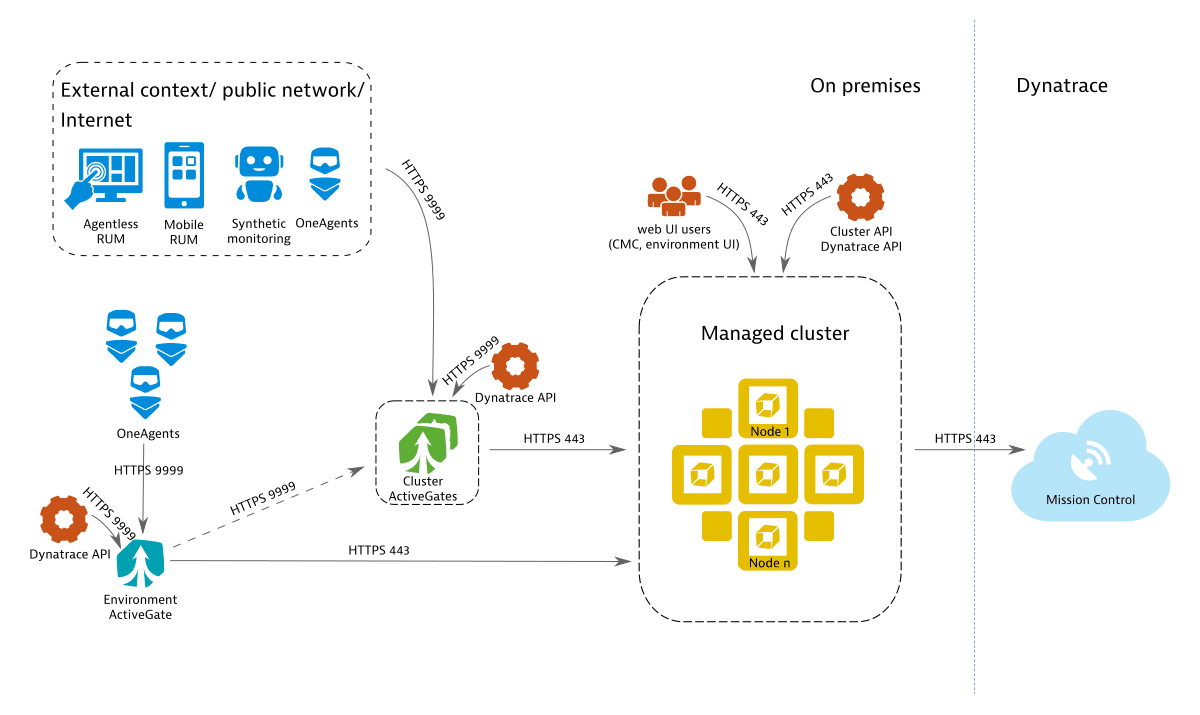
Stage 2: External traffic and Digital Experience Monitoring services
Extending the deployment beyond the internal network allows you to receive data from external sources, such as OneAgents, Environment ActiveGates, or Digital Experience Monitoring (DEM) services. This stage adds an Environment ActiveGate to better support multiple local OneAgents.
The DEM services may include:
To receive external traffic, expose the Managed Cluster to external networks and configure a public IP address. Exposing the Managed Cluster directly to external networks isn't recommended for security reasons. Instead, use one or more Cluster ActiveGates as mediating proxies for pre-processing of OneAgent and DEM traffic. Cluster ActiveGates are recognized by the Managed Cluster and can be configured through the Cluster Management Console, similar to Managed Cluster nodes.

The web UI is accessed using HTTPS, which requires a TLS certificate. You can use a self-signed certificate, but for secure web UI traffic and cluster administration, provide a domain name and a valid SSL certificate, or let Dynatrace generate them automatically. By default, each Managed Cluster gets a subdomain of *.dynatrace-managed.com with a valid certificate from Let's Encrypt.
Each Cluster ActiveGate requires:
-
A publicly available IP address
Required to accept traffic from external sources.
-
A domain name with a valid SSL certificate
External communication is only supported over HTTPS (port 443). The domain must differ from the Dynatrace web UI domain. You can provide your own domain and SSL certificate, or let Dynatrace generate them on your behalf. Cluster ActiveGates don't support proxying of web UI traffic.
For high-load installations with many external hosts, applications, sessions, and synthetic monitors, set up multiple load-balanced Cluster ActiveGates sharing the same domain name and certificate.
The Environment ActiveGate connects directly to the Managed Cluster by default (unless custom network zones are used). Configure it to connect through the Cluster ActiveGate if the Managed Cluster isn't directly reachable from the Environment ActiveGate's network.
When the Environment ActiveGate connects to the Managed Cluster through a Cluster ActiveGate, the Cluster ActiveGate must be operational, reachable, and configured with a suitable IP address (local or public) before installation begins.
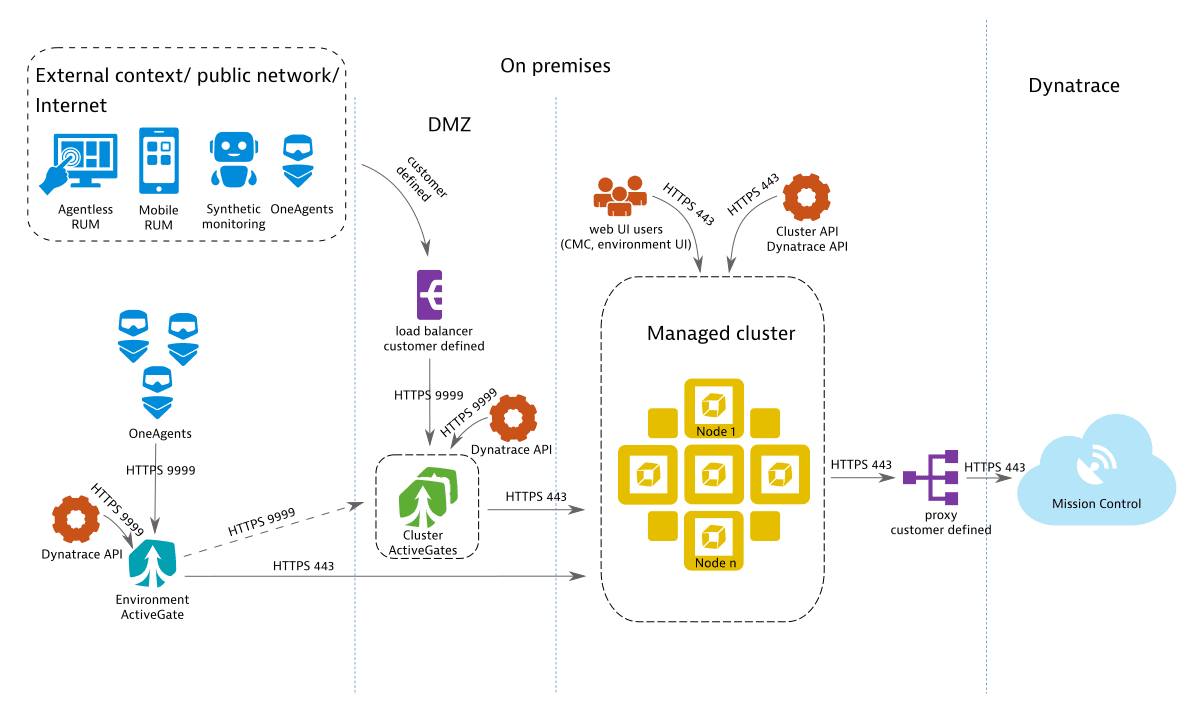
Stage 3: Integration with existing infrastructure
When embedding Dynatrace Managed into an existing IT infrastructure, you can incorporate appliances that are already in place. The diagram shows a customer-provided load balancer in front of the Cluster ActiveGate domain and a customer-provided proxy for outbound communication to Mission Control.

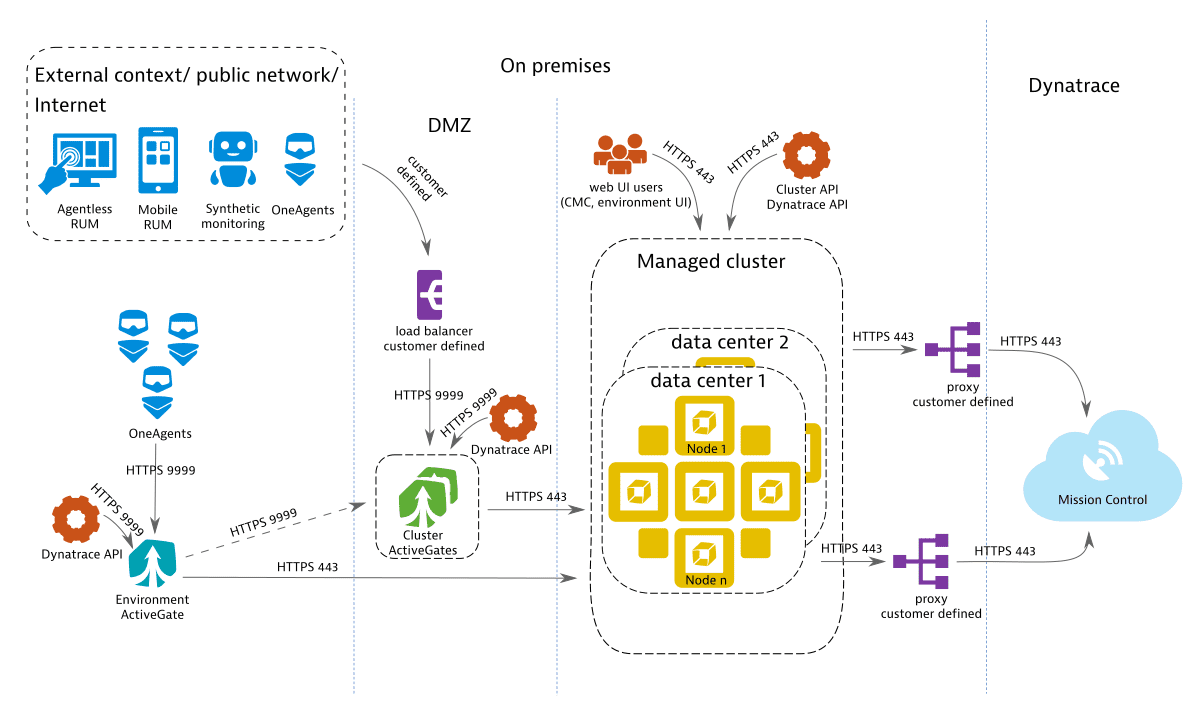
Stage 4: High availability with automatic recovery
A high-availability deployment spans distributed networks and provides near-zero downtime, continuous monitoring without data loss in failover scenarios, and cost savings by eliminating standby recovery hosts and backup transfer infrastructure. For capacity planning, treat the nodes in the additional data center as redundant rather than expanded capacity, and balance both data centers equally. For details, see Premium high availability.

Required configuration per traffic type
Each traffic type has different network access and certificate requirements. Although Real User Monitoring (RUM), agentless RUM, and mobile RUM typically relate to traffic from outside your network, the same requirements apply when that traffic originates inside your network.
| Traffic type | Public IP | Valid SSL certificate |
|---|---|---|
OneAgent (on-premises) | ||
OneAgent (external) | required | |
RUM (on-premises) | ||
RUM (external) | ||
Agentless RUM (on-premises) | required | |
Agentless RUM (external) | required | required |
Mobile RUM (on-premises) | required | |
Mobile RUM (external) | required | required |
Synthetic | required |
Agentless Real User Monitoring, mobile-app monitoring, and synthetic monitors use the same endpoint to transmit monitoring data to Dynatrace Managed.