Account Management audit logs
- Latest Dynatrace
- Explanation
- 5-min read
Dynatrace provides audit logs of all changes to your account-level identity and access (IAM) management settings.
- Group permissions
- Group memberships policies
- Boundaries
- Account state changes
- Budget settings
- Forecast settings
- Cost settings
Audit log data is stored for up to 10 years (3650 days).
Administrators can view these logs in Account Management > Settings > Audit log.
Required permissions
To view Account Management audit logs you need the following permissions:
-
To view the Audit logs page, you need the
account-company-inforole. -
To access audit logs via API, you need:
- An OAuth client with the
account-audit-logs-readscope. - The
account-company-inforole.
- An OAuth client with the
Audit log contents
Each audit log contains all information about a specific configuration change. These could be caused by a UI interaction, an API call via Dynatrace Platform Subscription API, a system event, or a scheduled non-interactive task.
The contents include, for example:
-
Timestamp: The time at which the request was processed. (All time references are based on the UTC+0 time zone.)
-
User: The user that made change. (The
DYNATRACEuser indicates a change made by a Dynatrace employee or an internal system event.) -
Event provider: The category of resource in which the change was made, such as
IAM(Identity and account management) orNotification(budget, forecast, and cost notifications). -
Event type: A specific identifier from the area that specifies the change that is recorded in the audit log.
-
Resource: The identifier of the resource that is being audited.
-
Resource name: The name of the resource.
If the configuration change relates to email notifications, the audit log may contain personally identifying information such as email addresses of the configured notification recipients.
Examples of complete audit log entries are provided at Account Management audit log examples.
If an identical payload is sent more than once, and subsequent payloads don't produce an event, no audit log entry will be visible for these subsequent payloads.
How to use the Audit log page
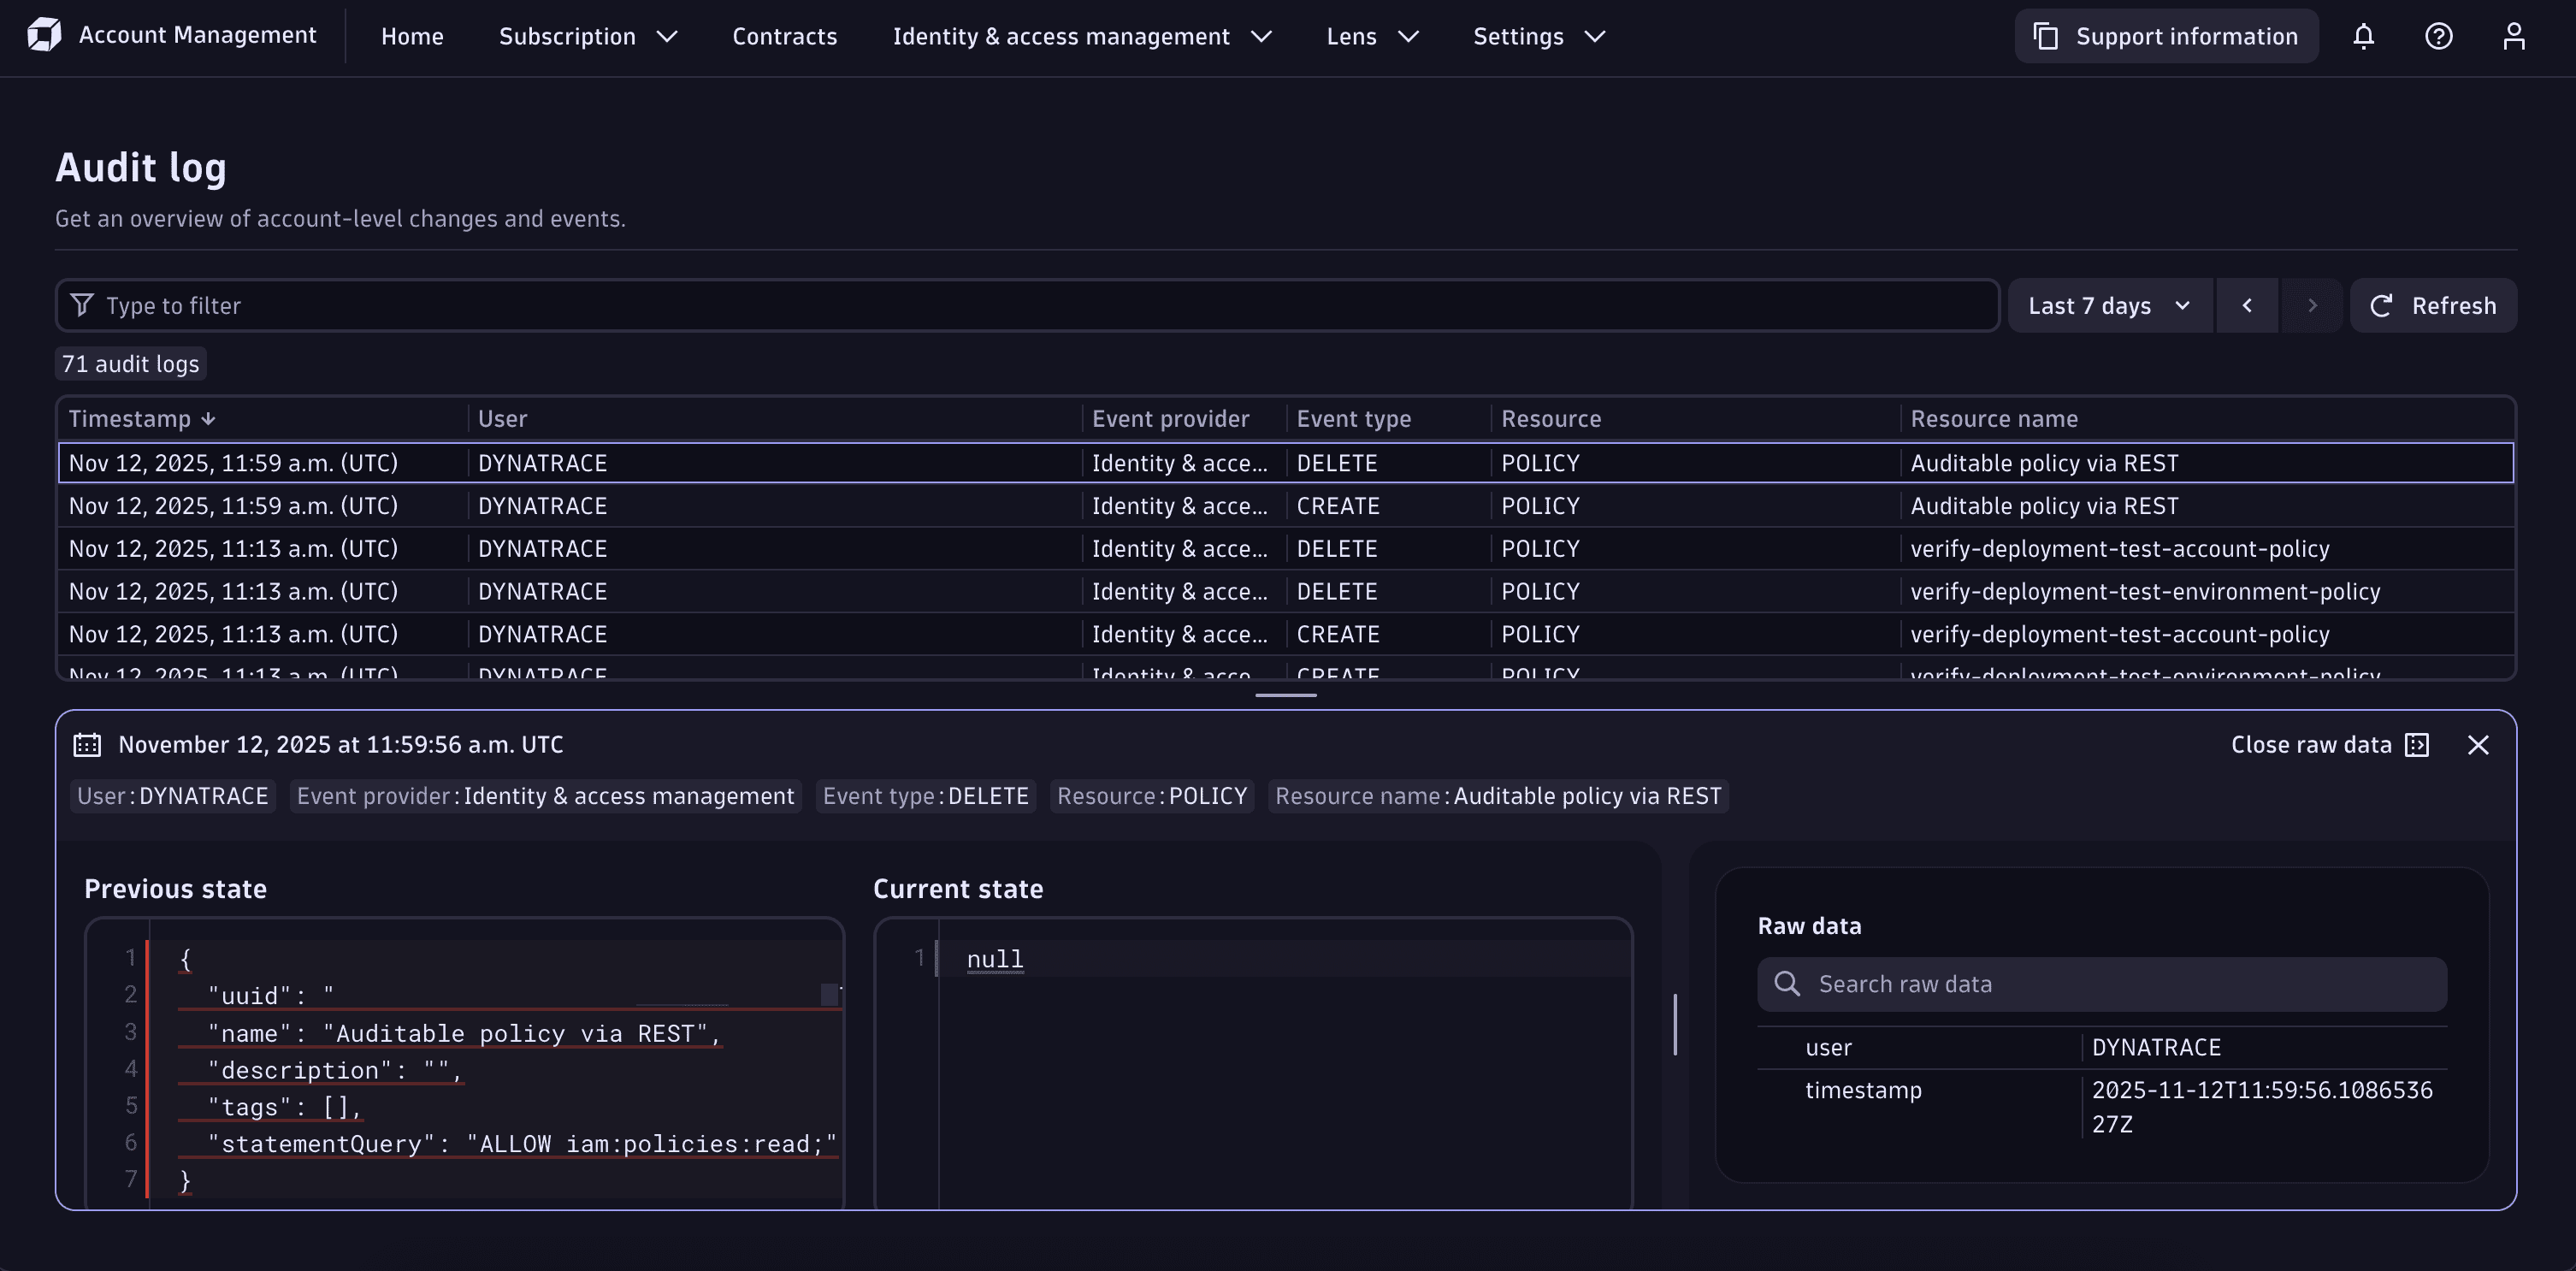
The Audit log page has four main sections:
- A text box in which you can search for and filter log entries.
- A table that contains the main information related to the configuration change.
- A diff-style view of the change.
- Complete information related to the configuration change.
To run a query, select either Update or Refresh (depending on whether or not you've already run a query).
Filter
The Filter text box is visible at the top of the Audit logs screen. Use the filter to run and filter queries by the contents of the configuration change. You can run queries with or without filters.
You can filter all queries by
- User
- Event provider
- Event type
- Resource
- Resource name
- Timeframe
A maximum of 1,000 audit logs can be returned in a single query.
- If you get a No data available message, expand the search timeframe to include a wider range of dates.
- If your timeframe is set too large, it's possible that some individual log messages will not be read during processing, and therefore will not be presented via the UI or API.
Main information
The table, visible in the middle of the page, presents the main information related to the request.
You can filter the results table according to the contents of a given cell. For any cell in the table, hover over the cell and select to:
- Filter: Show only cells that contain the same contents as the cell.
- Exclude: Hide all cells that contain the same contents as the cell.
To view all information about a given log entry, select that entry in the table. The diff-style view and Raw data pane open at the bottom of the screen.
Diff-style view
When you select a log entry, a pane opens at the bottom of the page to show the specific change that was made.
- Previous state: The value prior to the change.
- Current state: The value after the change.
Raw data
The Raw data pane, to the left of the diff-style view, contains the complete JSON contents of a given audit event.
Use the Search raw data field to search for specific text strings within the payload.
Audit logs via API
You can also query this information via the Account audits API. This lets you, for example, use audit log information in external tools.
For more information, see Account audits API.