Calculate your consumption of Events - Query (DPS)
- Latest Dynatrace
- Concept
- 5-min read
- Published Aug 12, 2025
Query data usage occurs when:
- Submitting custom DQL queries in the Logs & Events viewer in advanced mode.
- Business Observability Apps (Business Flow, Salesforce Insights, and Carbon Impact)
- Executing DQL queries in Notebooks, Dashboards, Workflows, Custom apps, and via API.
Here's what's included with the Query data-usage dimension:
Concept
Explanation
On-read parsing
- Use DQL to query historical events in storage and extract business, infrastructure, or other data across any timeframe, and use extracted data for follow-up analysis.
- No upfront indexes or schema required for on-read parsing
Aggregation
Perform aggregation, summarization, or statistical analysis of data in events across specific timeframes or time patterns (for example, data occurrences in 30-second or 10-minute intervals), mathematical, or logical functions.
Reporting
Create reports or summaries with customized fields (columns) by adding, modifying, or dropping existing event attributes.
Context
Use DQL to analyze event data in context with relevant data on the Dynatrace platform, for example, user sessions or distributed traces.
The usage of  Distributed Tracing and
  Services is included with Dynatrace.
No consumption is generated by these apps.
Services is included with Dynatrace.
No consumption is generated by these apps.
How consumption is calculated: GiB scanned
Queried data is the data read during the execution of a DQL query. It is calculated per gibibyte scanned (GiB scanned).
Calculate your consumption
Apply the following calculation to determine your consumption for the Query data-usage dimension:
(number of GiB of uncompressed data read during query execution) × (GiB scanned price as per your rate card) = consumption in your local currency
Grail applies various optimizations to improve response time and reduce cost. In some cases, these optimizations will identify portions of data that are not relevant to the query result—the price for scanning that data is discounted by 98%.
The impact of Grail's scan optimizations varies based on data and query attributes. It may evolve as Dynatrace improves Grail's query intelligence.
Let's assume that to resolve incidents and analyze performance issues your team executes DQL queries with a total of 60 GiB of data read per day. The yearly consumption for Query is calculated as follows:
- Query volume read per day:
60 GiB - Query volume read per year:
60 GiB * 365 days = 21,900 GiB - Cost per year:
21,900 GiB * (Query price as per your rate card) = Cost
Track your consumption
This section describes the different Dynatrace tools that you can use to track consumption and costs.
Track your consumption with DQL queries
The following DQL query provides an overview of total Query usage in gibibytes scanned:
fetch dt.system.events| filter event.kind == "BILLING_USAGE_EVENT"| filter event.type == "Events - Query" or event.type == "Events - Query - SaaS"| dedup event.id| summarize {data_read_bytes = sum(billed_bytes)}, by: {startHour = bin(timestamp, 1d)}
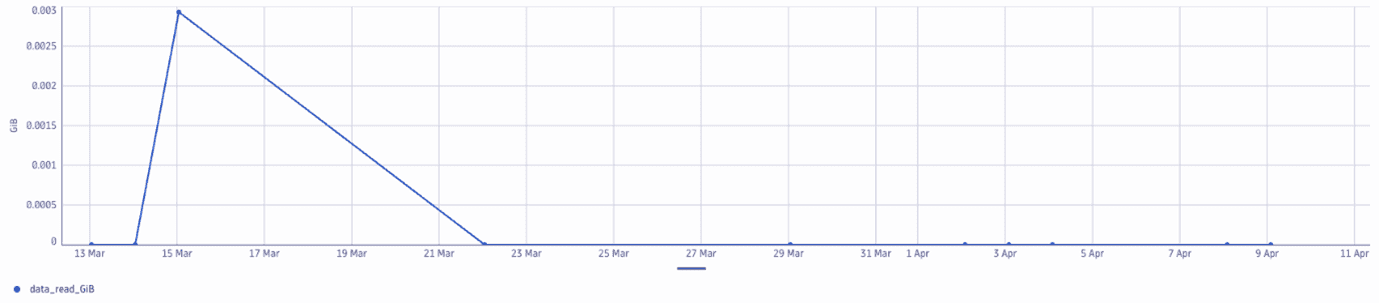
The example below shows the daily usage by bucket visualized in a line chart
The following DQL query provides an overview of the Query usage by application:
fetch dt.system.events| filter event.kind == "BILLING_USAGE_EVENT"| filter event.type == "Events - Query" or event.type == "Events - Query - SaaS"| fieldsAdd query_id = if(event.version == "1.0", event.id, else: query_id)| dedup event.id| summarize {data_read_bytes = sum(billed_bytes),Query_count = countDistinctExact(query_id)}, by: {App_context = client.application_context, application_detail = client.source, User = user.email}| fieldsAdd split_by_user = record(data_read_bytes, App_context, application_detail, User, Query_count)| summarize {split_by_user = arraySort(collectArray(split_by_user), direction: "descending"),data_read_bytes = sum(data_read_bytes),Query_count = sum(Query_count)}, by:{App_context, application_detail}| fieldsAdd split_by_user = record(App_context = split_by_user[][App_context], application_detail = split_by_user[][application_detail], User = split_by_user[][User], data_read_bytes = split_by_user[][data_read_bytes], data_read_pct = (split_by_user[][data_read_bytes] / data_read_bytes * 100), Query_count = split_by_user[][Query_count])| fieldsAdd split_by_user = if(arraySize(split_by_user) == 1, arrayFirst(split_by_user)[User], else: split_by_user)| fieldsAdd application_details = record(data_read_bytes, App_context, application_detail, split_by_user, Query_count)| summarize {application_details = arraySort(collectArray(application_details), direction: "descending"),data_read_bytes = sum(data_read_bytes),Query_count = toLong(sum(Query_count))}, by:{App_context}| fieldsAdd application_details = record(App_context = application_details[][App_context], application_detail = application_details[][application_detail], split_by_user = application_details[][split_by_user], data_read_bytes = application_details[][data_read_bytes], data_read_pct = application_details[][data_read_bytes] / data_read_bytes * 100, Query_count = application_details[][Query_count])| fieldsAdd key = 1| fieldsAdd total = lookup([fetch dt.system.events| filter event.kind == "BILLING_USAGE_EVENT" and (event.type == "Events - Query" or event.type == "Events - Query - SaaS")| dedup event.id| summarize total = sum(billed_bytes),| fieldsAdd key = 1], sourceField: key, lookupField:key)[total]| fields App_context, application_details, data_read_bytes, data_read_pct = data_read_bytes / total * 100, Query_count| sort data_read_bytes desc
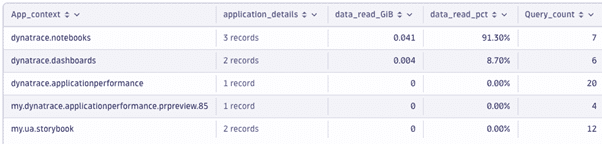
The example below shows the usage by application visualized in a nested table view
Track your consumption and costs in Account Management
Your Dynatrace Platform Subscription provides daily updates about accrued usage and related costs. You can access these details anytime via Account Management (Subscription > Overview > Cost and usage details > Events – Query > Actions > View details) or the Dynatrace Platform Subscription API.
On the Capability cost and usage analysis page, select a specific environment to analyze that environment’s cost and usage for a specific capability.
Track your consumption and costs via API
You can query metrics via the Environment API - Metrics API v2.