Calculate your consumption of Kubernetes Platform Monitoring (DPS)
- Latest Dynatrace
- Concept
- 3-min read
- Published Aug 12, 2025
For Kubernetes platform owners, Kubernetes Platform Monitoring offers insights into your Kubernetes clusters. It provides comprehensive insights into resource metrics, events, topology, and alerts to help manage and automate the health and performance of your Kubernetes clusters, workloads, and pods. Plus, it enables optimization of resource utilization across multiple workloads and pods.
A Kubernetes workload is an application that belongs to a Kubernetes namespace. Each workload runs a set of pods (or instances) that consist of a set of running containers. The smallest operational unit that you can deploy and run in Kubernetes is a pod.
How consumption is calculated: pod-hour
The unit of measure for calculating consumption of Kubernetes Platform Monitoring is a pod-hour. The longer a pod is monitored, the more pod-hours the environment consumes. Note that a pod-hour is independent of the size of the pod.
When Kubernetes Platform Monitoring is run in combination with Full-Stack Monitoring, all pods running on a Full-Stack monitored host are included in Full-Stack Monitoring.
Pods on non-Full-Stack hosts, as well as pods stuck in Pending, still contribute to your consumption of pod-hours, as described on this page.
Billing granularity for pod-hour consumption
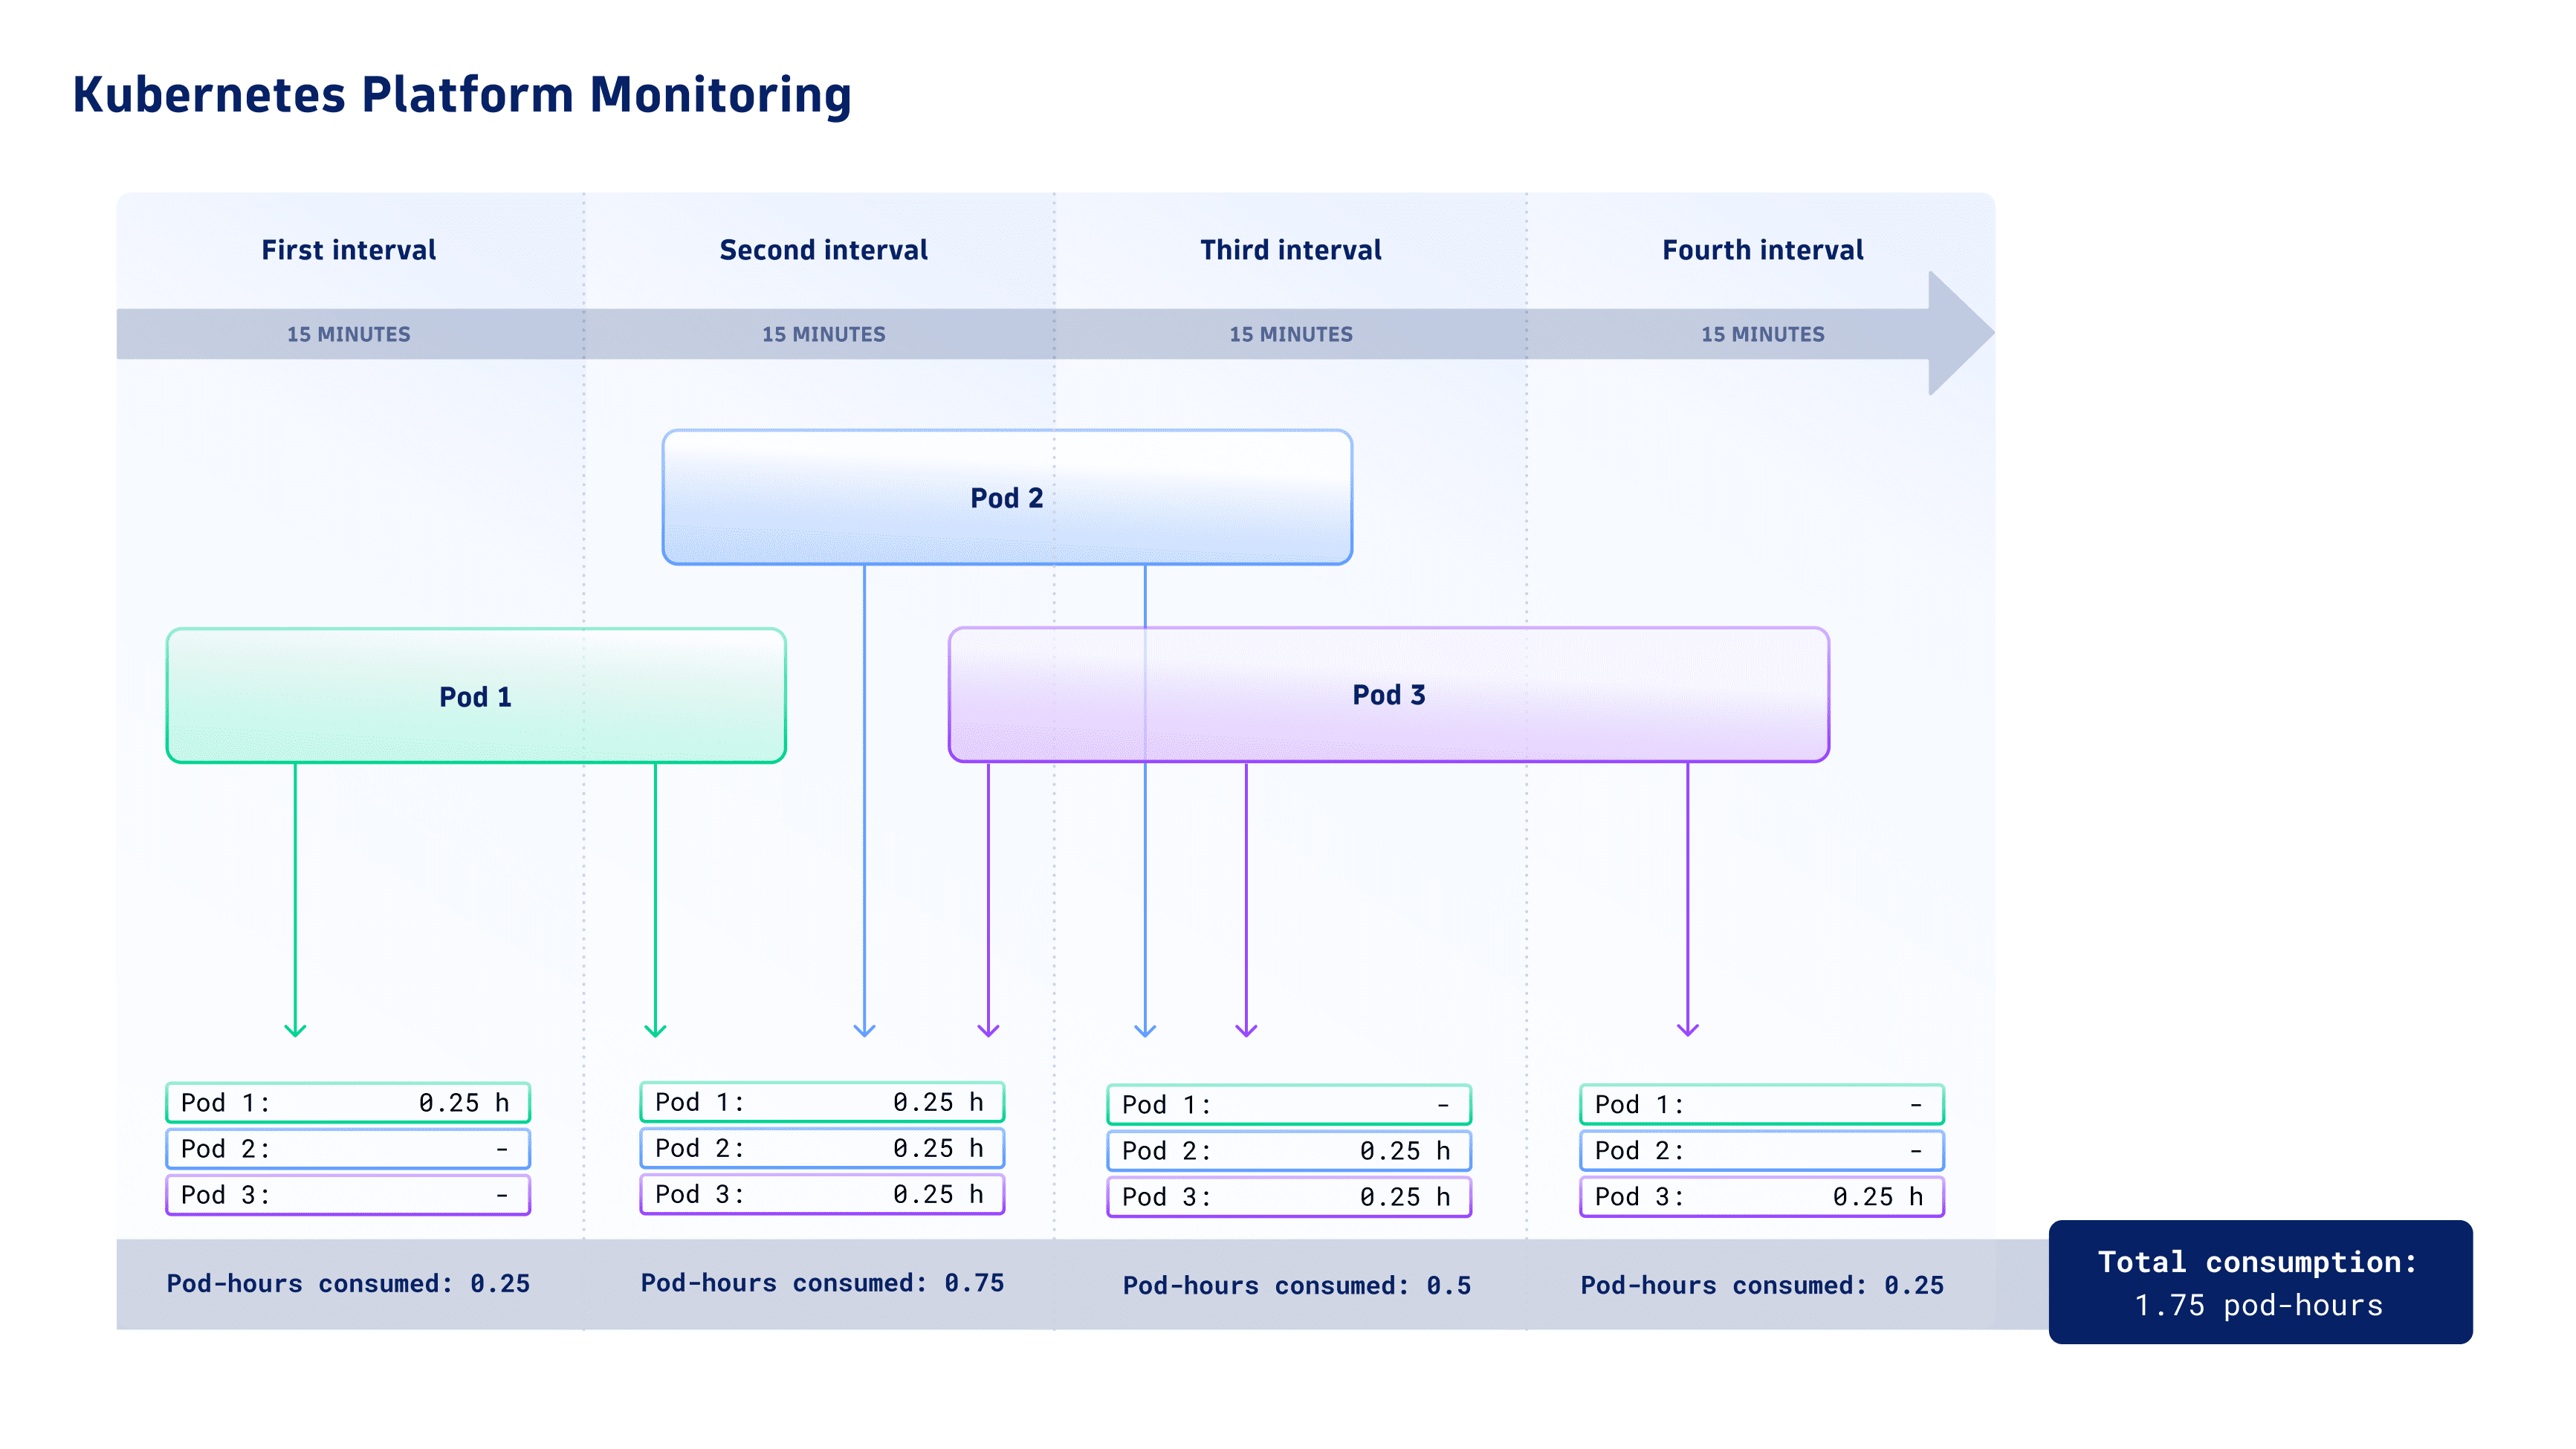
Dynatrace is built for elastic cloud-native environments where services are often short-lived—which is the case for pods running in Kubernetes environments. Therefore, billing granularity for pod-hour consumption is based on 15-minute intervals. When a pod is monitored for fewer than 15 minutes in an interval, pod-hour consumption is rounded up to the full 15 minutes before consumption is calculated.
The image below illustrates how pod-hour consumption per pod is calculated.
What observability value is included in a pod-hour?
Kubernetes Platform Monitoring offers in-depth observability insights for Kubernetes clusters, including the following signals:
-
A comprehensive set of resource and health metrics for clusters, namespaces, pods, containers, and nodes.
-
Kubernetes warning events are included on a fair-use basis. The fair-use quota is designed to cover all Kubernetes warning events in regular scenarios.
A pod-hour includes 60 Kubernetes warning events per pod. The Kubernetes warning events are pooled across all pods. The consumption of the fair-use quota is calculated in 15-minute intervals.Dynatrace currently doesn’t charge for Kubernetes warning events in excess of the amount allowed under your fair-use quota.
Additional events are licensed via Custom Events Classic pricing. By March 2024, additional events will be billed via Events powered by Grail.
-
Kubernetes anomaly detection for alerting.
Kubernetes info events, Prometheus metrics, and Istio metrics are not included in a pod-hour.
Track your consumption
This section describes the different Dynatrace tools that you can use to track consumption and costs.
Track your consumption with Metrics
Dynatrace provides built-in usage metrics that help you understand and analyze your organization's consumption of Kubernetes Platform Monitoring.
To use these metrics, in Data Explorer, enter DPS in the Search field.
Here is the metric you can use to monitor the consumption details for Kubernetes Platform Monitoring.
- (DPS) Kubernetes Monitoring billing usage
Key:
builtin:billing.kubernetes_monitoring.usageDimension: Kubernetes cluster; Kubernetes namespace
Resolution: 15 min
Description: Total number of pod-hours consumed.
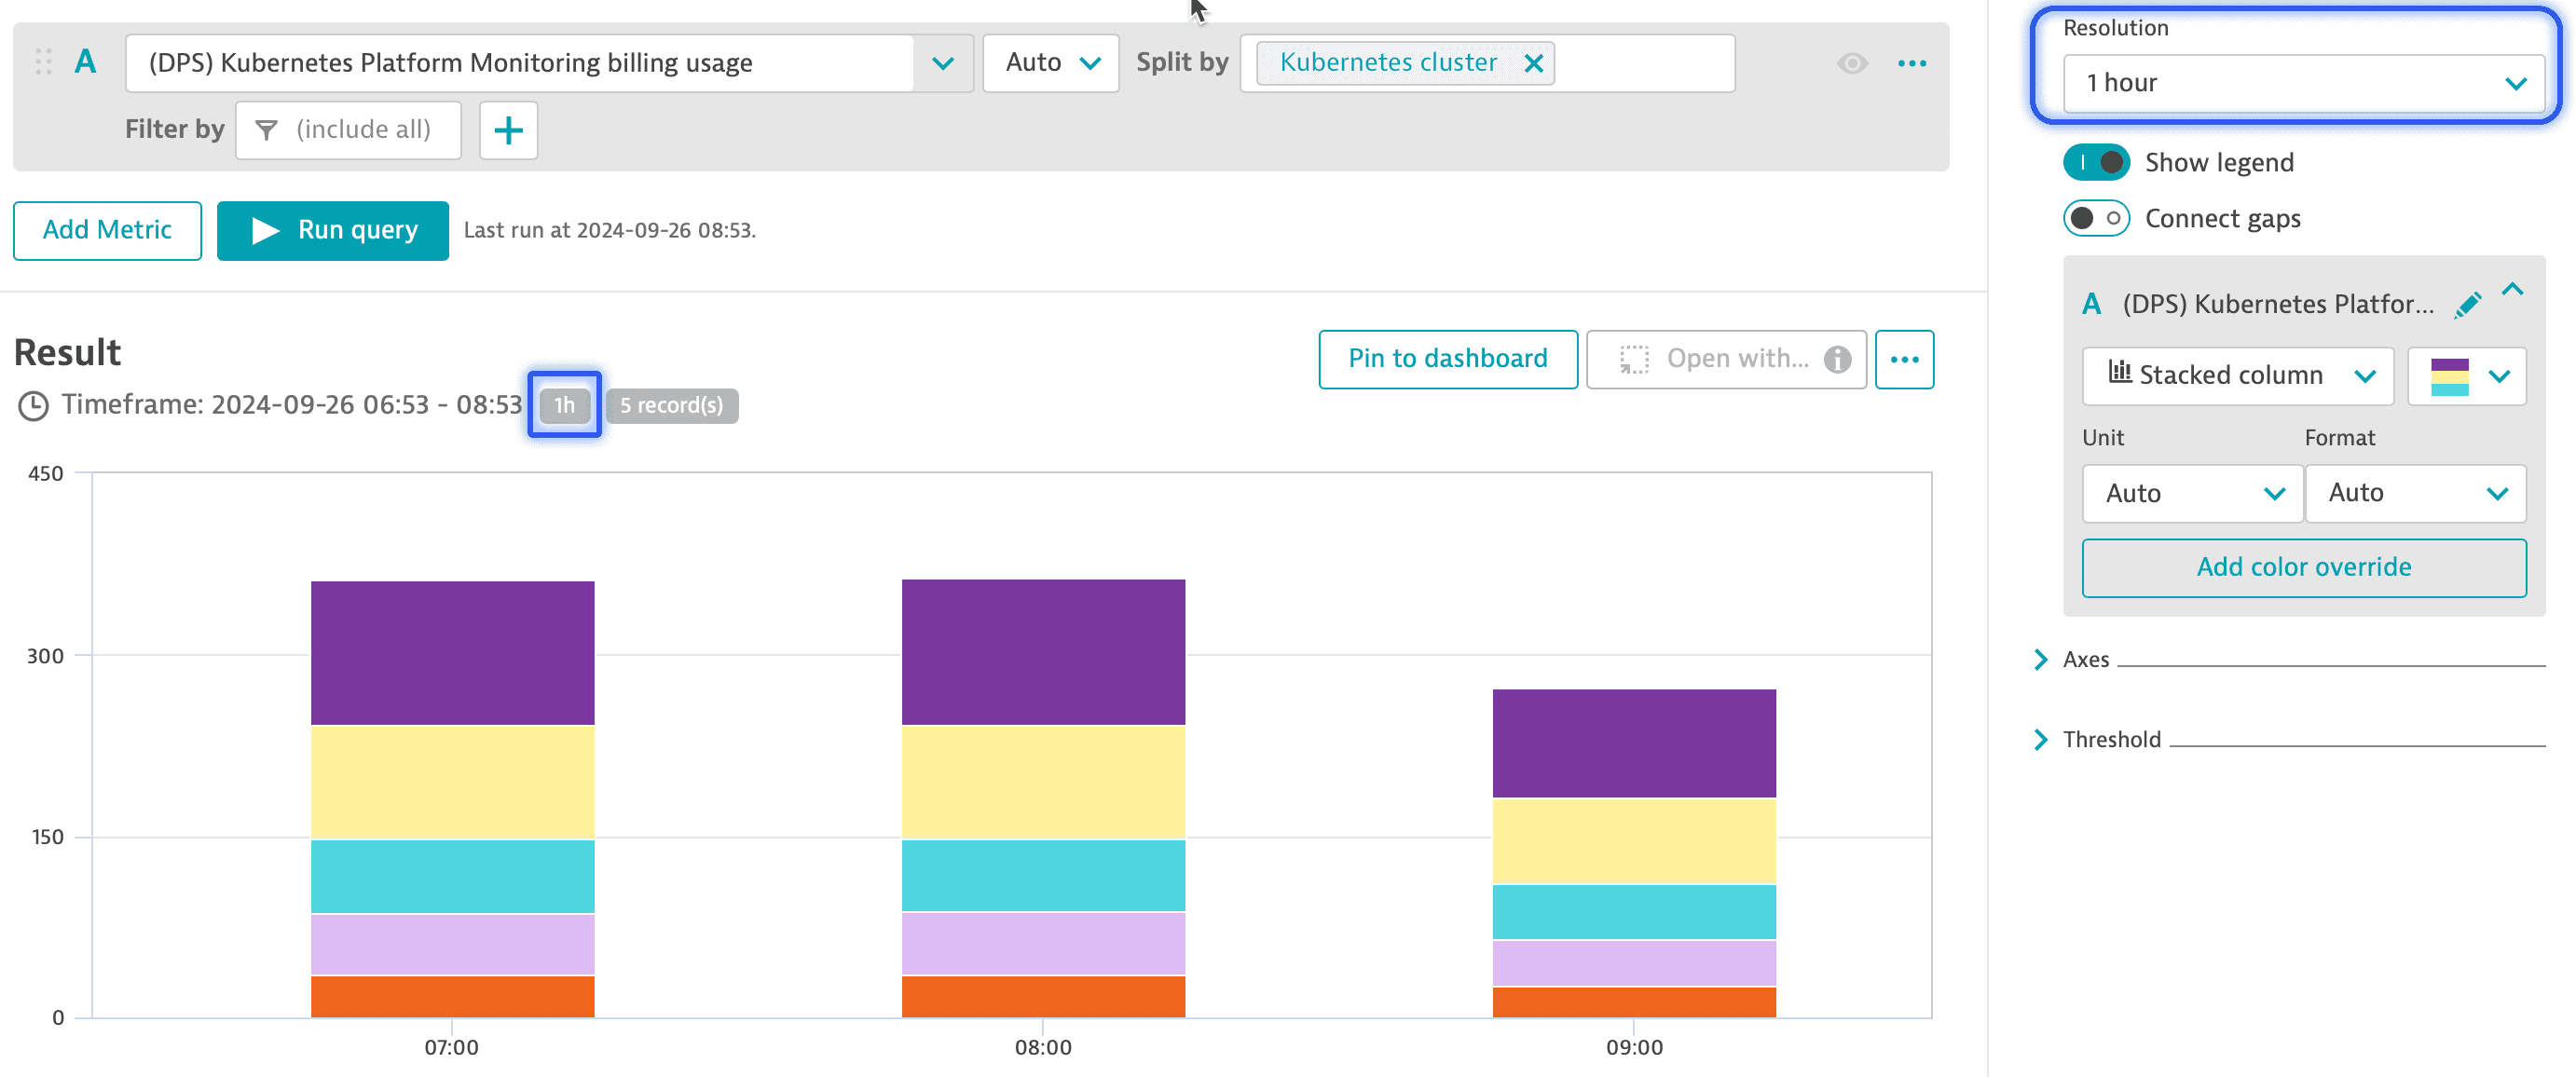
You can monitor the total pod-hour consumption for different intervals (hour, day, or week) for any selected timeframe using the (DPS) Kubernetes Monitoring billing usage metric. The example below shows consumption aggregated in 1-hour intervals and split by Kubernetes cluster. You can monitor the total pod-hour consumption for different intervals (hour, day, or week) for any selected timeframe using the (DPS) Kubernetes Monitoring billing usage metric. Aggregated consumption metrics will also be provided in Account Management. The example below shows consumption aggregated in 1-hour intervals and split by Kubernetes cluster.
Track your consumption and costs in Account Management
You can track your usage in Account Management. Go to Cost and usage details > Usage summary > Kubernetes monitoring > Actions > View details.
Track your consumption and costs via API
You can query metrics via the Environment API - Metrics API v2.