Log Monitoring Classic (DPS)
- Dynatrace Classic
- 16-min read
As of January 12, 2026, Log Monitoring Classic will no longer be part of the rate card for any new DPS subscription signed on or after that date. Existing DPS customers will continue to have access to the SaaS platform extensions capabilities.
This page describes how the Log Monitoring Classic DPS capability is consumed and billed. For an overview of the capability, including its main features, see Log Monitoring Classic.
How consumption is calculated: log records
The unit of measure for Log Monitoring Classic is one log record.
- Each timestamp is counted as a new log record.
- Each JSON object is counted as a log record. A JSON file can contain multiple objects that count as a log record.
Timestamps
For example, in the following log data (consumed via log file or generic ingestion), Dynatrace counts nine log records based on timestamp occurrence:
-
Oct 18 05:56:11 INFO ip-10-176-34-132 DHCPREQUEST on eth0 to 10.176.34.1 -
Oct 18 05:56:12 INFO ip-10-176-34-132 DHCPACK from 10.176.34.1 -
Oct 18 05:56:13 INFO ip-10-176-34-132 bound to 10.176.34.132 -- renewal in 1551s4: -
Oct 18 05:56:13 INFO ip-10-176-34-132 [get\_meta] Getting token for IMDSv -
Oct 18 05:56:16 INFO ip-10-176-34-132 [get\_meta] Trying to get http://169.23.2.3 -
Oct 18 05:56:18 INFO ip-10-176-34-132 [rewrite\_aliases] Rewriting aliases -
Oct 18 06:22:06 INFO ip-10-176-34-132 DHCPREQUEST on eth0 to 10.176.34.1 port 67 -
Oct 18 06:22:07 INFO ip-10-176-34-132 DHCPACK from 10.176.34.1 (xid=0x3a182c8c) -
Oct 18 06:22:10 INFO ip-10-176-34-132 bound to 10.176.34.132 -- renewal in 1364s
JSON Objects
For example, in the following log data, Dynatrace counts three log records based on JSON object occurrence:
{"timestamp": "2021-07-29T10:54:40.962165022Z","level": "error","log.source": "/var/log/syslog","application.id": "PaymentService-Prod","content": "DHCPREQUEST on eth0 to 10.176.34.1"},{"log.source": "/var/log/syslog","content": "[get\_meta] Getting token for IMDSv"},{"content": "DHCPACK from 10.176.34.1 (xid=0x3a182c8c)"}
Track your consumption
This section describes the different Dynatrace tools that you can use to track consumption and costs.
Track your consumption with metrics
Dynatrace provides built-in usage metrics that help you understand and analyze your organization's consumption of Log Monitoring Classic.
To use them in Data Explorer, enter DPS into the Search field. These metrics are also available via the Environment API and linked in Account Management (Usage summary > Log Monitoring Classic > Actions > View details). The table below shows the list of metrics you can use to monitor the consumption details for Log Monitoring Classic.
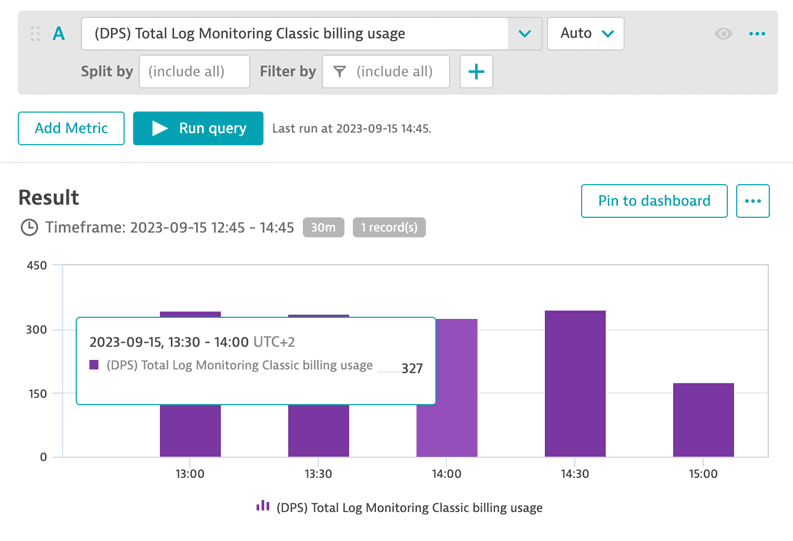
- (DPS) Total Log Monitoring Classic billing usage
Key:
builtin:billing.log_monitoring_classic.usageDimension: count
Resolution: 1 min
Description: Number of log records ingested aggregated over all monitored entities.
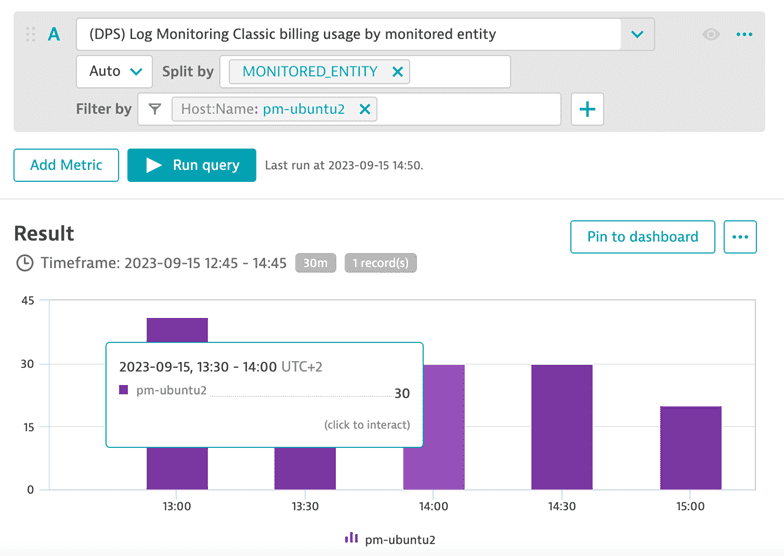
- (DPS) Log Monitoring Classic billing usage by monitored entity
Key:
builtin:billing.log_monitoring_classic.usage_by_entityDimension:
dt.entity.monitored_entity\[ME:MONITORED_ENTITY]Resolution: 1 min
Description: Number of log records ingested split by monitored entity.
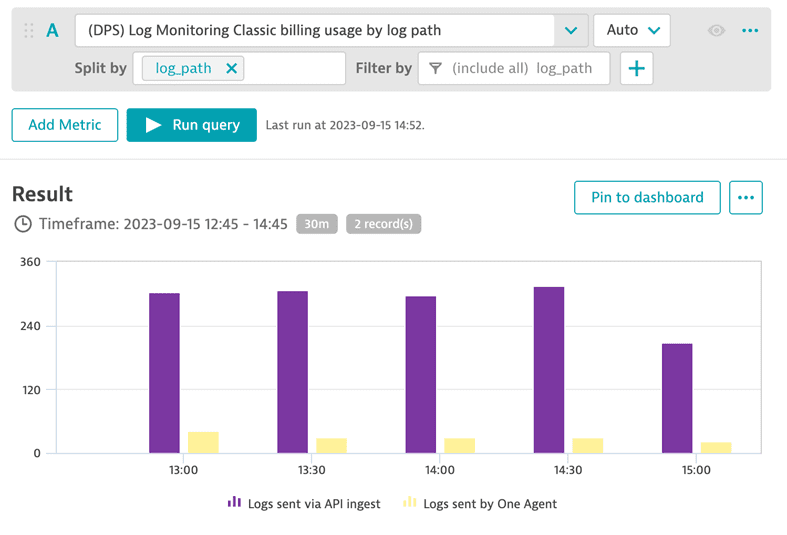
- (DPS) Log Monitoring Classic billing usage by log path
Key:
builtin:billing.log_monitoring_classic.usage_by_log_pathDimension:
log_path\[STRING]Resolution: 1 min
Description: Number of log records ingested split by log path.
You can monitor the total number of billable log records for different intervals (15 min, hour, day, or week) for any selected timeframe using the metric "(DPS) Total Log Monitoring Classic billing usage." The example below shows consumption aggregated in 1-hour intervals.
You can monitor the consumption of log records by any filtered entity by using the metric "(DPS) Log Monitoring Classic billing usage by monitored entity." The example below shows the number of billable log records that came from a specified host.
You can monitor the consumption of log records by any filtered log path using the metric "(DPS) Log Monitoring Classic billing usage by log path." The example below shows the number of billable log records that came from OneAgent and API.
Track your consumption and costs in Account Management
You can also track your usage in Account Management. Go to Account Management > Subscription > Overview > Cost and usage details > Usage summary > Platform Extensions > Environment name > View Details.