Calculate your consumption of Log Management & Analytics - Query (DPS)
- Latest Dynatrace
- Explanation
- 6-min read
- Published Aug 12, 2025
This page describes how the Log Management & Analytics - Query DPS capability is consumed and billed. For an overview of the capability, including its main features, see Log Management & Analytics - Query.
The usage of  Distributed Tracing and
  Services is included with Dynatrace.
No consumption is generated by these apps.
Services is included with Dynatrace.
No consumption is generated by these apps.
How consumption is calculated: GiB scanned
Queried data is the volume of data read during the execution of a DQL query. It is calculated per gibibyte scanned (GiB scanned).
Apply the following calculation to determine your consumption for the Query data-usage dimension:
consumption = (number of GiB of uncompressed data read during query execution) × (GiB scanned price as per your rate card)
Query consumption is based on the GiB of data scanned to return a result. The highest potential cost for a query is equal to the volume of logs within the query’s search range times the price on your rate card.
Grail applies various optimizations to improve response time and reduce cost. In some cases, these optimizations will identify portions of data that are not relevant to the query result—the price for scanning that data is discounted by 98%.
The impact of Grail scan optimizations varies based on data and query attributes. It may evolve as Dynatrace continues to improve Grail query intelligence.
Track your consumption
This section describes the different Dynatrace tools that you can use to track consumption and costs.
Track your consumption with Metrics
Dynatrace provides a built-in usage metric that helps you understand and analyze your organization's consumption of Log Management & Analytics - Query.
To use this metric, in Data Explorer, enter DPS in the Search field.
- Log Management & Analytics - Query
Key:
builtin:billing.log.query.usageDimension: Byte
Resolution: 1 hour
Description: Number of bytes read during the execution of a DQL query, including sampled data.
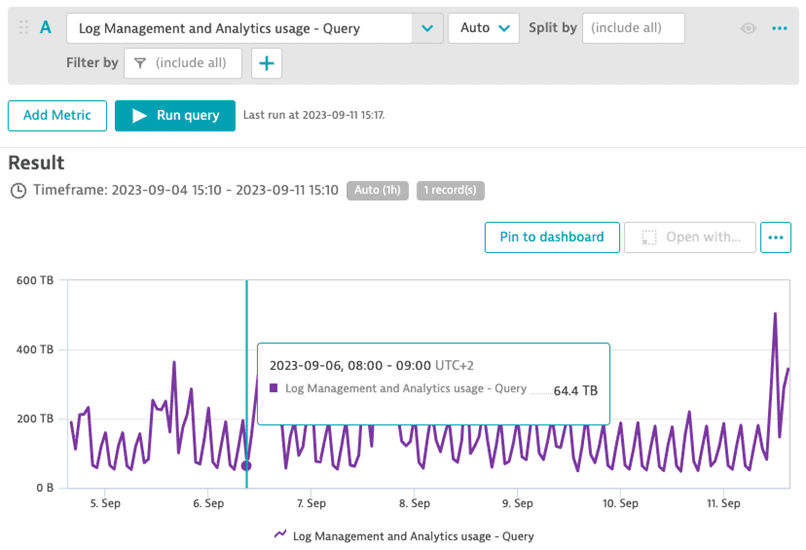
You can monitor the total scanned bytes for Query in hourly intervals for any selected timeframe using the metric builtin:billing.log.query.usage.
The example below shows usage aggregated in 1-hour intervals between 2023-09-04 and 2023-09-11 (last 7 days).
Track your consumption with DQL queries
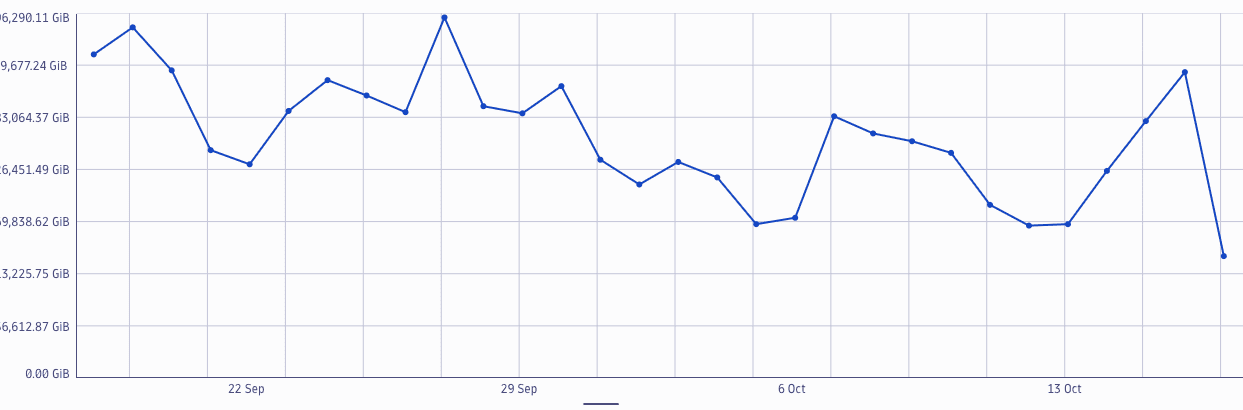
The following DQL query provides an overview of total Query usage in gibibytes scanned:
fetch dt.system.events| filter event.kind == "BILLING_USAGE_EVENT"| filter event.type == "Log Management & Analytics - Query"| dedup event.id| summarize {data_read_bytes = sum(billed_bytes)}, by: {startHour = bin(timestamp, 1d)}
The example below shows the daily query usage visualized in a line chart for the last 30 days:
Track your consumption and costs in Account Management
You can also view usage metrics in Account Management. Go to Account Management > Subscription > Overview > Cost and usage details > Usage summary and select the Log Management and Analytics - Query capability.
Track your consumption and costs via API
You can query metrics via the Environment API - Metrics API v2.