Calculate your consumption of Events - Ingest & Process (DPS)
- Latest Dynatrace
- Explanation
- 5-min read
This page describes how the Events - Ingest & Process DPS capability is consumed and billed. For an overview of the capability, including its main features, see Events - Ingest & Process.
The usage of  Distributed Tracing and
  Services is included with Dynatrace.
No consumption is generated by these apps.
Services is included with Dynatrace.
No consumption is generated by these apps.
How consumption is calculated: GiB
Ingested data is the amount of raw data in bytes sent to Dynatrace before enrichment and transformation. It is calculated per gibibyte (GiB).
For data uploaded to the Grail Resource Store, such as lookup tables, a minimum file size of 1 MiB is used for Events - Ingest & Process calculations.
Calculate your consumption
Apply the following calculation to determine your consumption for the Ingest & Process data-usage dimension:
(number of gibibytes ingested) × (gibibyte price as per your rate card) = consumption in your local currency
Be aware that data enrichment and processing can increase your data volume typically by 0.5–1.0 kB per event. Depending on the source of the data, and the attributes and metadata added during processing, the total data volume after processing can increase by a factor of 1.5 or more. Processing can also be used to drop unwanted event attributes to reduce retained data volume.
Let's assume that you ingest 5 GiB of event data per day into Dynatrace. The yearly consumption for Ingest & Process is calculated as follows:
- Ingest volume per day:
5 GiB - Ingest volume per year:
5 GiB * 365 = 1,825 GiB - Cost per year:
1,825 GiB * (Ingest & Process price as per your rate card) = Cost
Track your consumption
This section describes the different Dynatrace tools that you can use to track consumption and costs.
Track your consumption with DQL queries
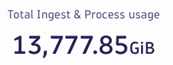
The following DQL query provides an overview of total Events – Ingest & Process usage in gibibytes:
fetch dt.system.events| filter event.kind == "BILLING_USAGE_EVENT" and event.type == "Events - Ingest & Process"| dedup event.id| summarize {`Total GiB` = sum(billed_bytes)}
The example below shows the total usage visualized as a single-value chart.
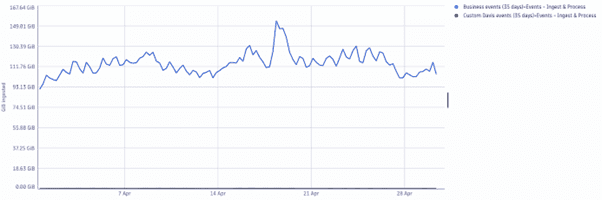
The following DQL query provides an overview of Ingest & Process usage by bucket.
fetch dt.system.events| filter event.kind == "BILLING_USAGE_EVENT" and (event.type == "Events - Ingest & Process" )| join [fetch dt.system.buckets], kind:leftOuter, on: { left[usage.event_bucket] == right[name] }| dedup event.id| summarize {billed_bytes = sum(billed_bytes)}, by:{timestamp, event.id, right.display_name, event.type}| makeTimeseries `Total GiB`=sum(billed_bytes), by:{right.display_name, event.type}, time: timestamp
The example below shows the daily usage visualized as a line chart.
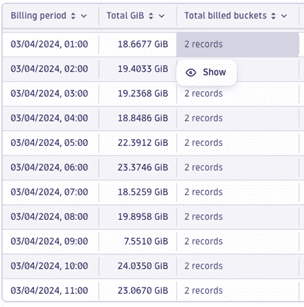
The following DQL query provides the hourly Ingest & Process usage
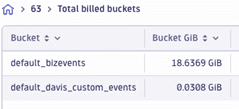
fetch dt.system.events| filter event.kind == "BILLING_USAGE_EVENT" and event.type == "Events - Ingest & Process"| dedup event.id| summarize {`bucket billed_bytes`=sum(billed_bytes)}, by:{billing_period = bin(timestamp, 1h), usage.event_bucket}| summarize {`Total GiB`=sum(`bucket billed_bytes`), `Total billed buckets`=collectDistinct(record(`Bucket` = usage.event_bucket, `Bucket GiB` = `bucket billed_bytes`))}, by:{`Billing period`=billing_period}
The example below shows the hourly usage by bucket visualized in a nested table view.
Track your consumption and costs in Account Management
Your Dynatrace Platform Subscription provides daily updates about accrued usage and related costs. You can access these details anytime via Account Management (Subscription > Overview > Cost and usage details > Events – Ingest & Process > Actions > View details) or the Dynatrace Platform Subscription API.
On the Capability cost and usage analysis page, select a specific environment to analyze that environment’s cost and usage for a specific capability.
Track your consumption and costs via API
You can query metrics via the Environment API - Metrics API v2.