Calculate your consumption of Runtime Application Protection (RAP) (DPS)
- Latest Dynatrace
- Concept
- 5-min read
- Published Aug 12, 2025
Dynatrace Runtime Application Protection leverages code-level insights and transaction analysis to detect and block attacks on your applications automatically and in real time.
How consumption is calculated: GiB-hour
The unit of measure for Runtime Application Protection is a GiB hour (also referred to as "memory-gibibyte-hour" in your rate card).
Dynatrace is built for dynamic cloud-native environments where hosts and services are rapidly spun up and destroyed. Therefore, billing granularity for GiB-hour consumption is calculated in four 15-minute intervals per hour. When a host or container is monitored for fewer than 15 minutes in an interval, GiB-hour consumption is rounded up to 15 minutes before consumption is calculated.
How consumption is calculated for hosts
Each instance on which Runtime Application Protection is enabled consumes GiB-hours based on the monitored host's physical or virtual RAM, calculated in 15-minute intervals.
The RAM of each VM or host is rounded to the next multiple of 0.25 GiB (which equates to 256 MiB) before monitoring consumption is calculated. A 4 GiB minimum is applied to GiB-hour consumption for physical and virtual hosts.
For example, a host with 8.3 GiB memory is counted as an 8.5 GiB host, being the next multiple of 0.25 GiB, while a host with 2 GiB memory is counted as a 4 GiB host (no rounding needed, but application of the 4 GiB minimum).
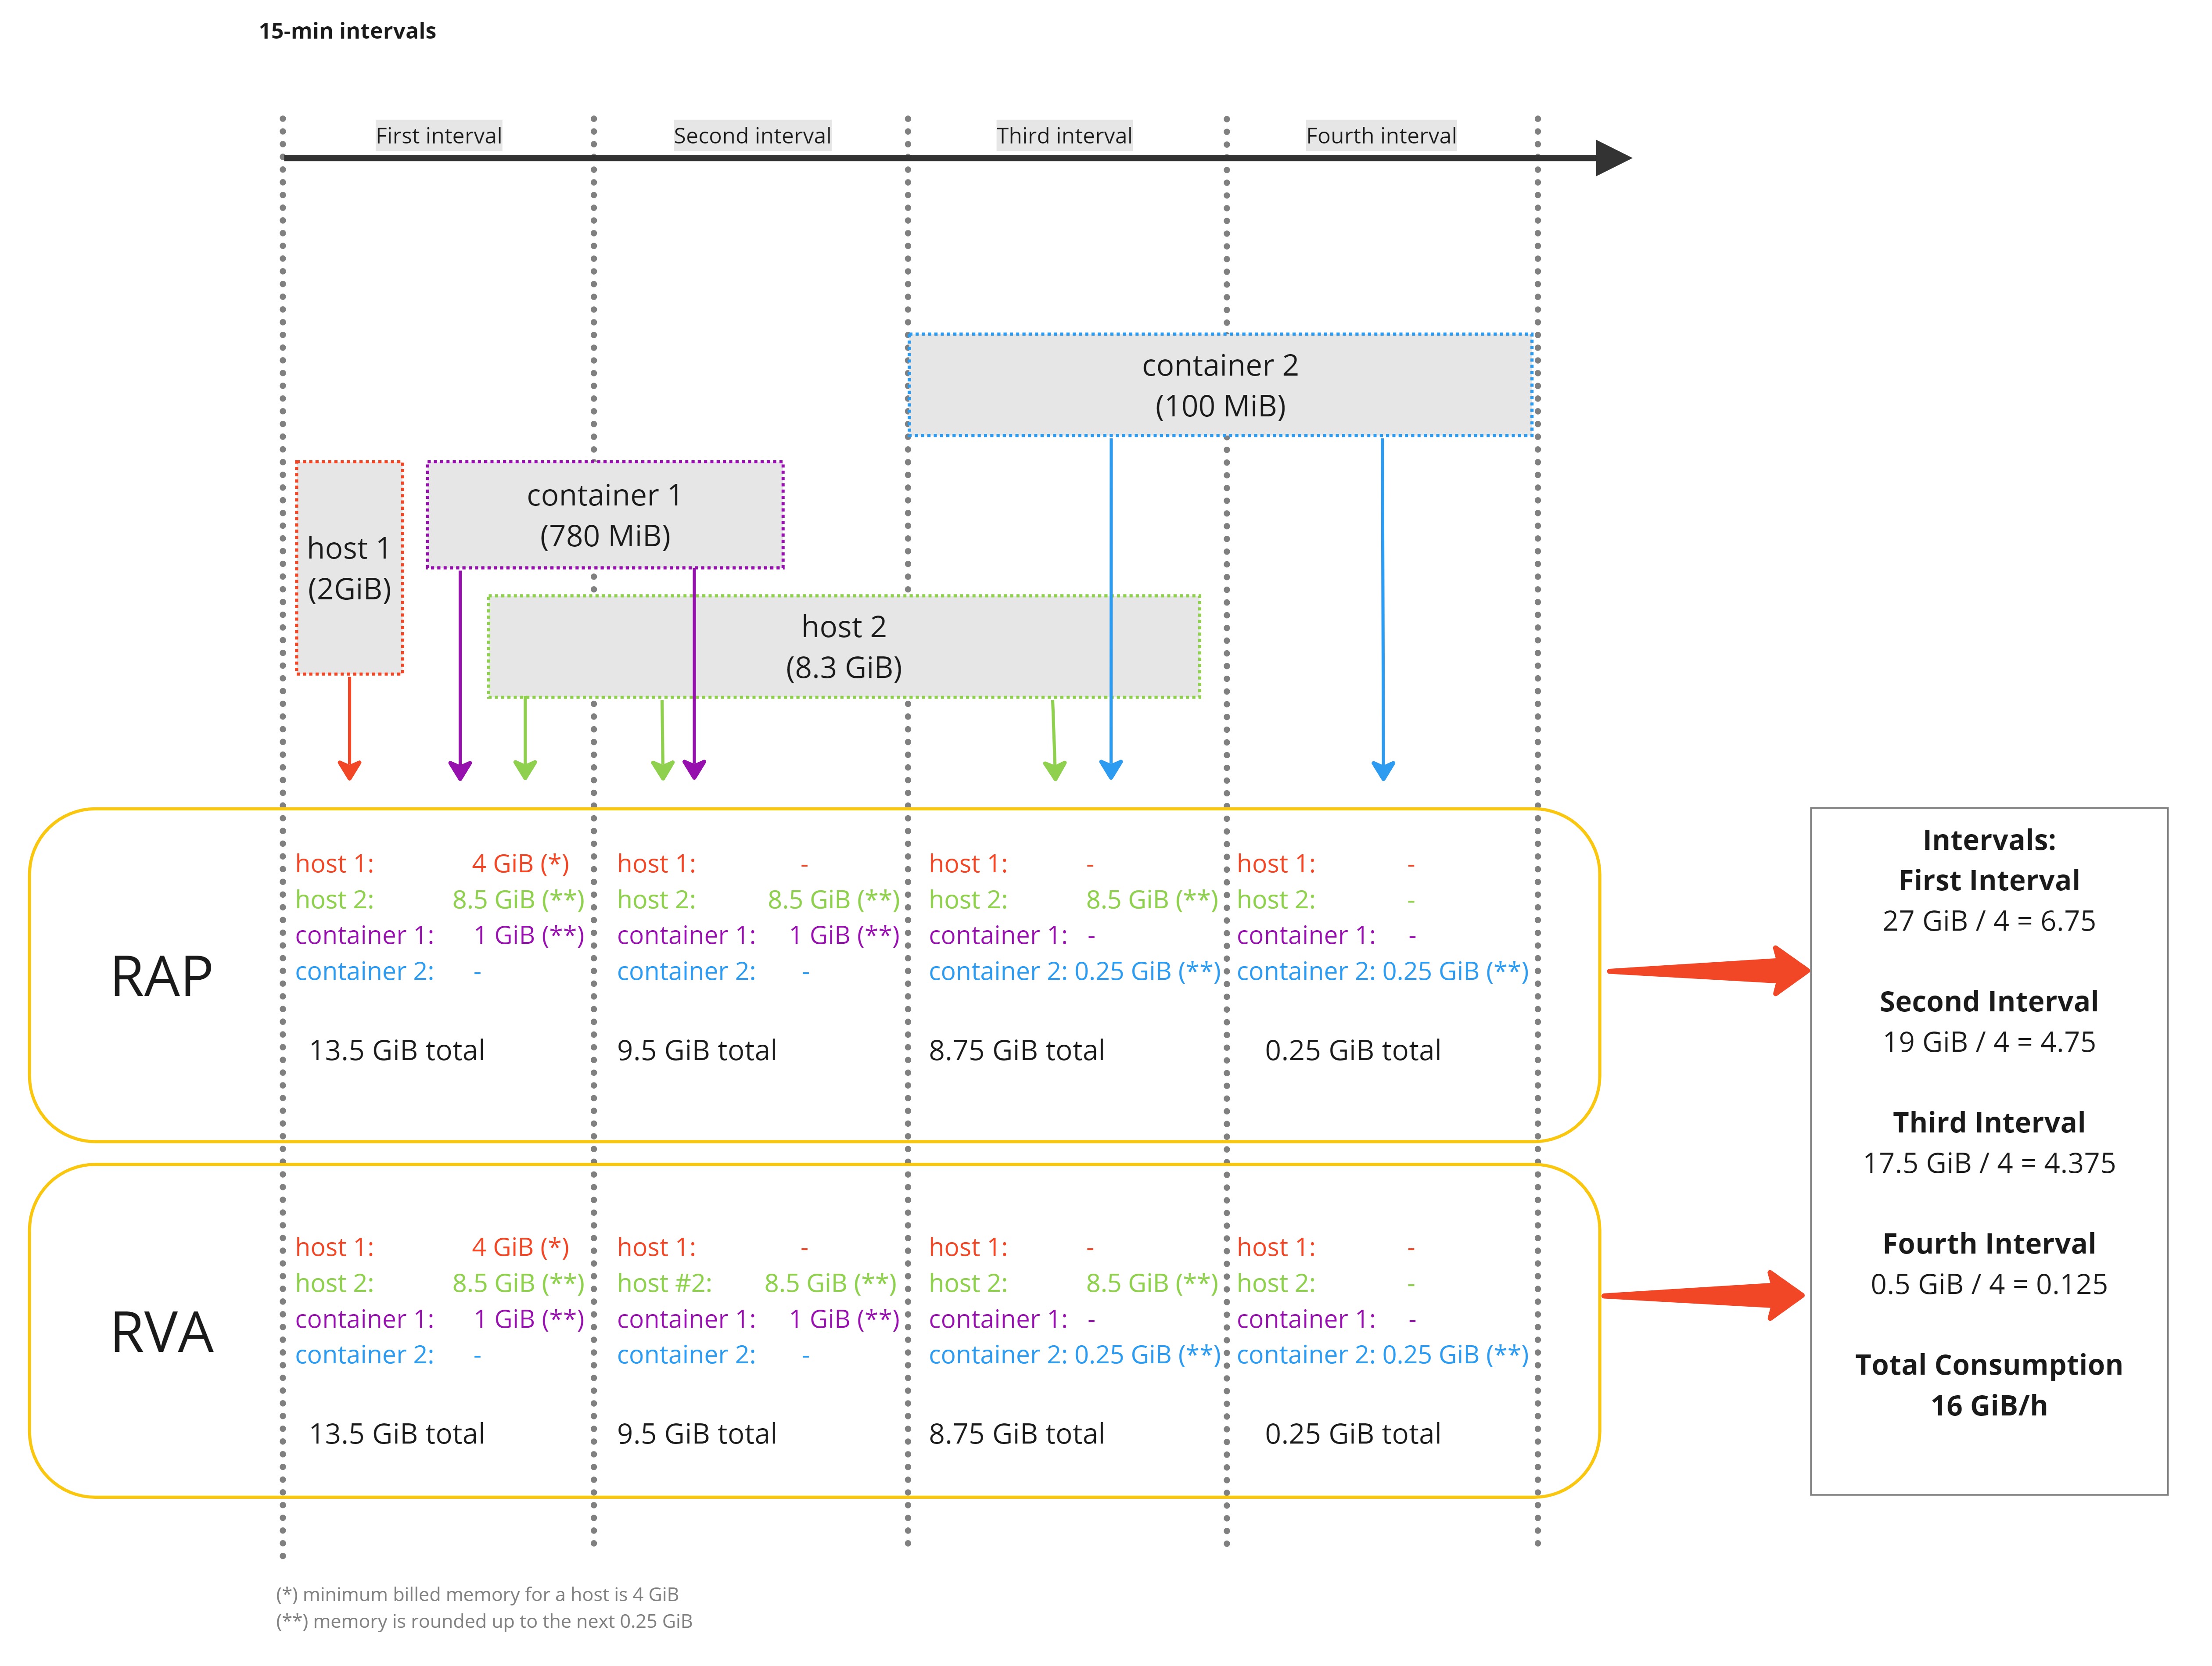
In the example above, each interval is divided by 4 in order to reach the memory-gibibyte-hour consumption unit of measure.
- Host 1: Runs in the first interval; 2 GiB memory (Minimum of 4 GiB applies) = 1.0 GiB/h RVA; 1.0 GiB/h RAP
- Host 2: Runs in the first, second, and third interval; 8.3 GiB memory (round to 8.5 GiB) = 6.375 GiB/h RVA; 6.375 GiB/h RAP
- Container 1: Runs in the first and second interval; 780 MiB memory (round to 1 GiB) = 0.5 GiB/h RVA; 0.5 GiB/h RAP
- Container 2: Runs in the third and fourth interval; 100 MiB memory (round to 0.25 GiB) = 0.125 GiB/h RVA & 0.125 GiB/h RAP
Total Runtime Vulnerability Analysis: 0.5 GiB/h + 0.5 GiB/h + 6.375 GiB/h + 0.125 GiB/h = 8.0 GiB/h
Total Runtime Application Protection: 0.5 GiB/h + 0.5 GiB/h + 6.375 GiB/h + 0.125 GiB/h = 8.0 GiB/h
How consumption is calculated for containers (application-only monitoring)
Memory-size calculations for containers monitored in an application-only approach are based on each container's used memory.
Memory-size calculations based on a container's used memory require OneAgent version 1.275+ (for Kubernetes containers) or OneAgent version 1.283+ (for other serverless containers).
Older OneAgent versions use the customer-defined memory limit. If no memory limit is set, the memory of the underlying virtual machine is used instead.
Exceptions
- For Azure App Services running on the App Service (Dedicated) plan for Windows, instances are counted as hosts and the defined memory of all instances is aggregated to determine total memory—regardless of how many applications run on those instances.
- For Azure App Service on Linux and Azure App Service for Linux Containers with OneAgent version 1.283+, memory consumption is calculated using the memory of each plan instance. In these cases, there is no ability to set container resource limits.
- Solaris Zones are counted as hosts.
- Monitored containers that are not detected as containers are counted as hosts.
In cloud-native environments, services and hosts are often short-lived. Therefore calculating monitoring consumption in 15-minute time intervals, rather than full hours, better reflects your actual usage. Containers, which are an essential mechanism in cloud-native environments, are typically smaller in memory size than hosts. Therefore, the minimum memory threshold for containers is 256 MiB, rather than 4 GiB, the minimum memory threshold for hosts. The same rounding as for hosts, to the next multiple of 0.25 GiB, also applies for containers. For example, a container with 780 MiB memory is counted as a 1 GiB container (780 MiB, which equals 0.76 GiB, being rounded up to the next multiple of 0.25 GiB).
Because Runtime Application Protection is based on code-level insights, Runtime Vulnerability Analytics must run concurrently in the background. Even if you configure a host to only run Runtime Application Protection, your environment will consume GiB-Hours for both Runtime Application Protection and Runtime Vulnerability Analytics.
Track your consumption
Track your consumption with Metrics
Dynatrace provides the following built-in usage metrics that help you understand and analyze your organization's consumption of Runtime Application Protection.
- (DPS) Runtime Application Protection billing usage
Key:
builtin:billing.runtime_application_protection.usageDimension:
Resolution: 15 min
Description: The total number of host hours monitored by Runtime Application Protection.
- (DPS) Runtime Application Protection billing usage per host
Key:
builtin:billing.runtime_application_protection.usage_per_hostDimension:
Host (dt.entity.host)Resolution: 15 min
Description: Total number of host hours monitored by Runtime Application Protection, split by host.
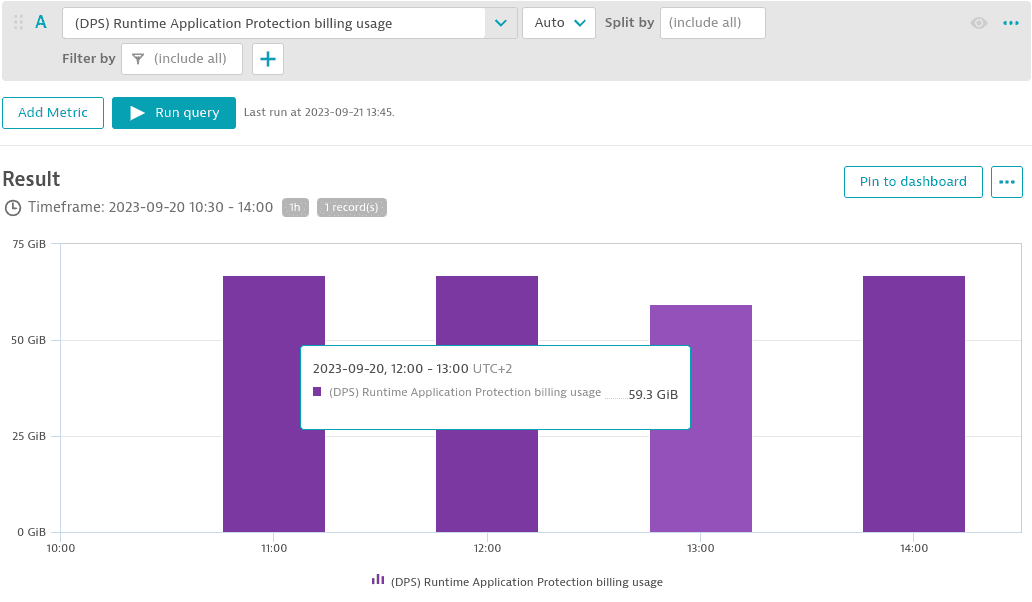
You can monitor the total memory-GiB-hour consumption aggregated across all Runtime Application Protection monitored hosts for different intervals (15 min, hour, day, or week) for any selected timeframe using the builtin:billing.runtime_application_protection.usage metric.
The example below shows memory GiB-hour consumption in 1-hour intervals.
Between 11:00 and 14:00, between 59.3 memory-GiB-hour and 67 memory-GiB-hour were consumed.
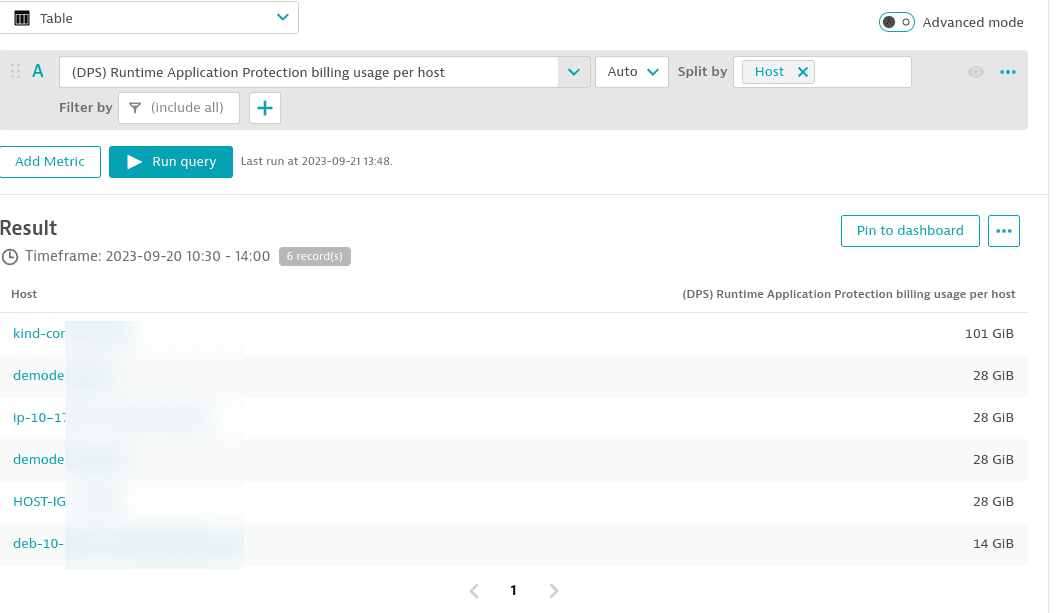
You can split the total host hour consumption by using the builtin:billing.runtime_application_protection.usage_per_host metric.
The example below shows the list of all hosts that reported consumption.
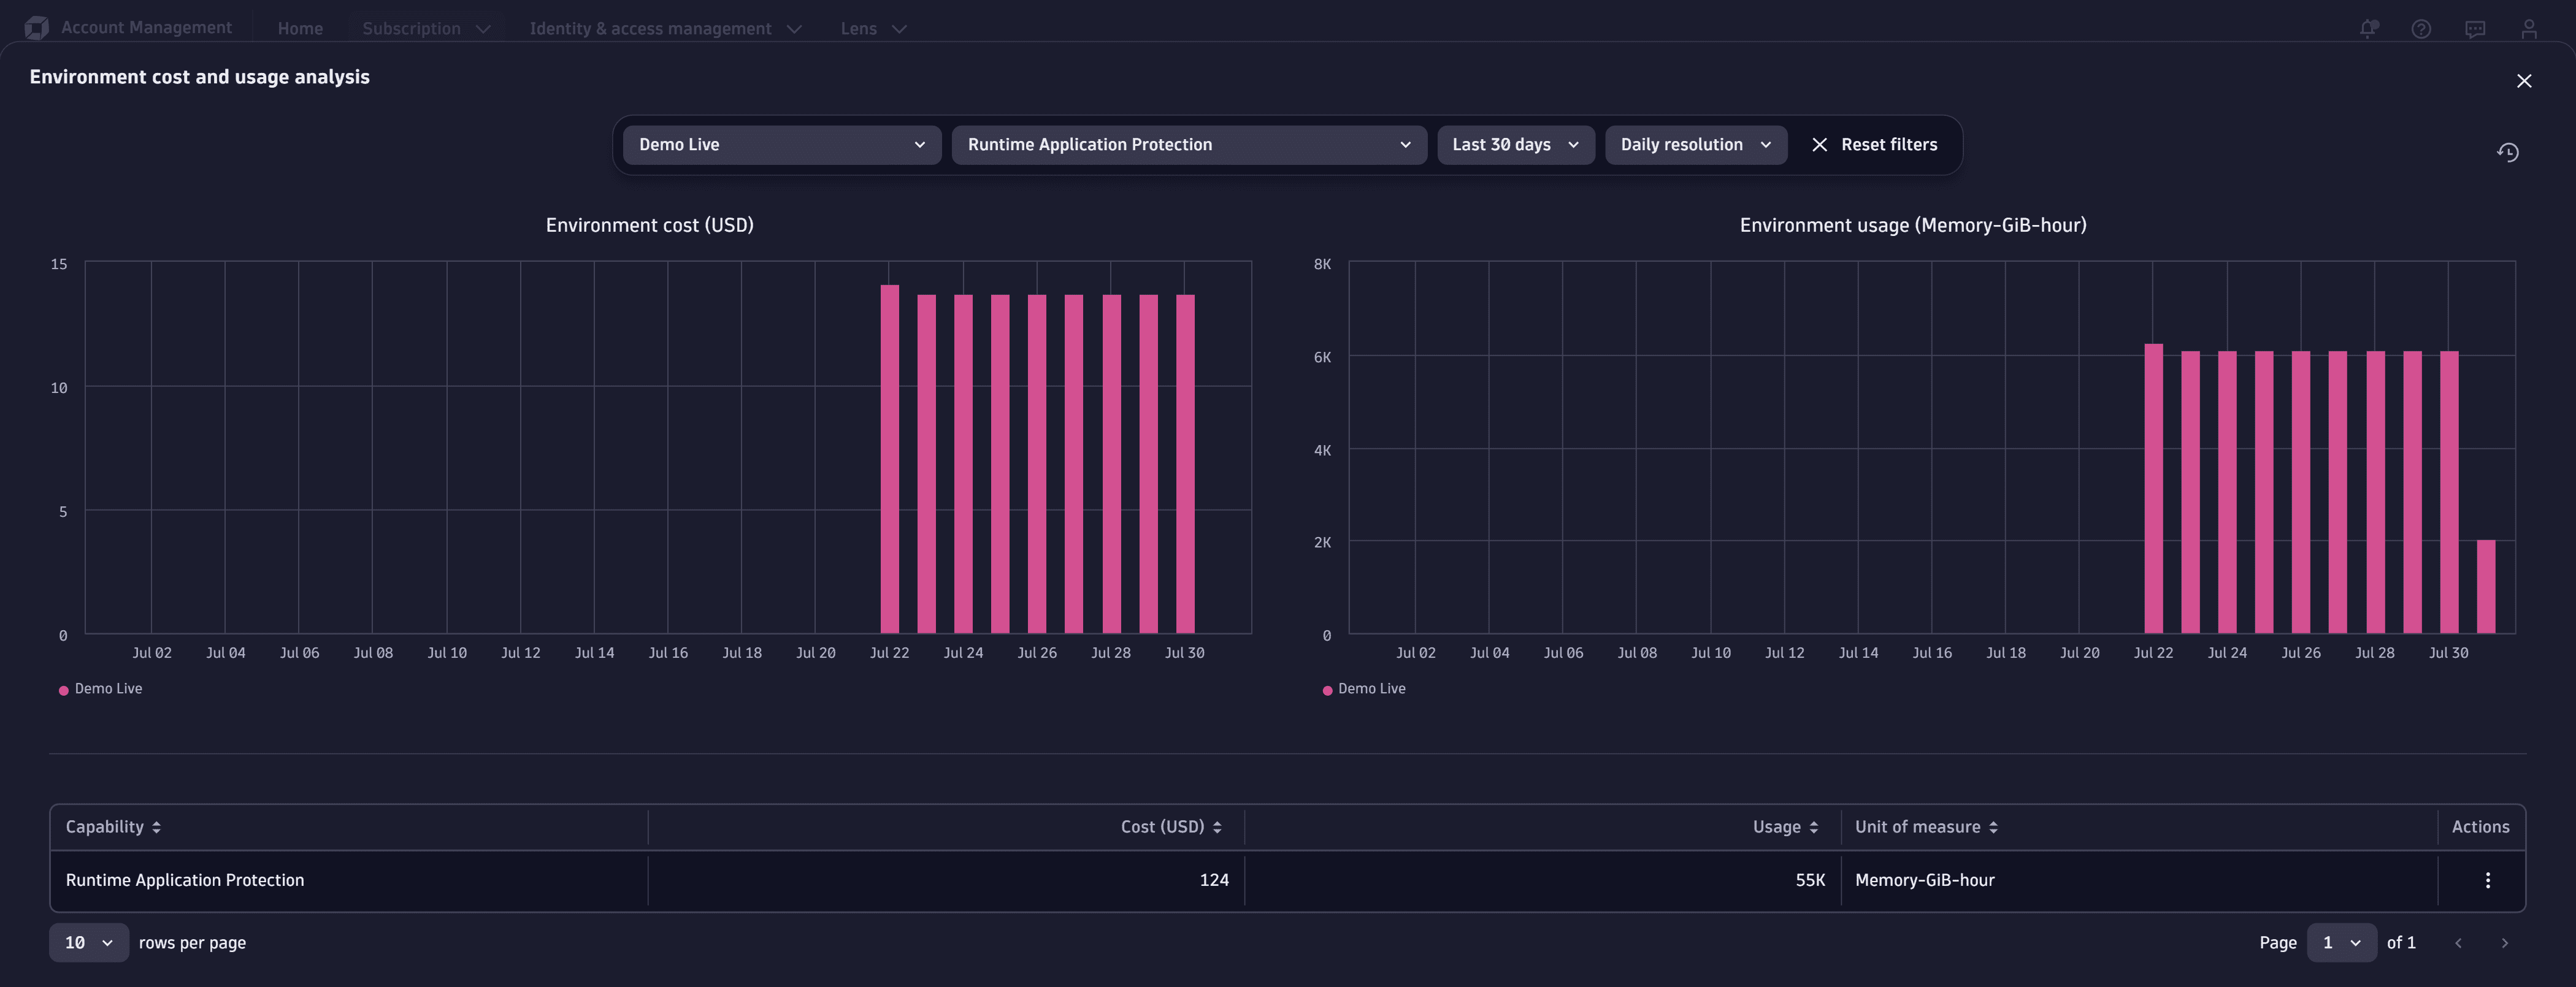
Track your consumption and costs in Account Management
You can also track your usage in Account Management.
- Go to Account Management > Subscription > Overview.
- In Cost and usage details, select Usage summary.
- Search for
Runtime Application Protectionand select View details.
Track your consumption and costs via API
You can query metrics via the Environment API - Metrics API v2.