Code-level visibility for PHP
- Latest Dynatrace
- 2-min read
- Published Jun 12, 2019
Code-level visibility gives you insights into where your PHP code spends the most time and uses the most CPU.
To access the PHP code-level view
- Go to
Services Classic.
- Optional Filter the table by
Technology: PHP. - Select a PHP service.
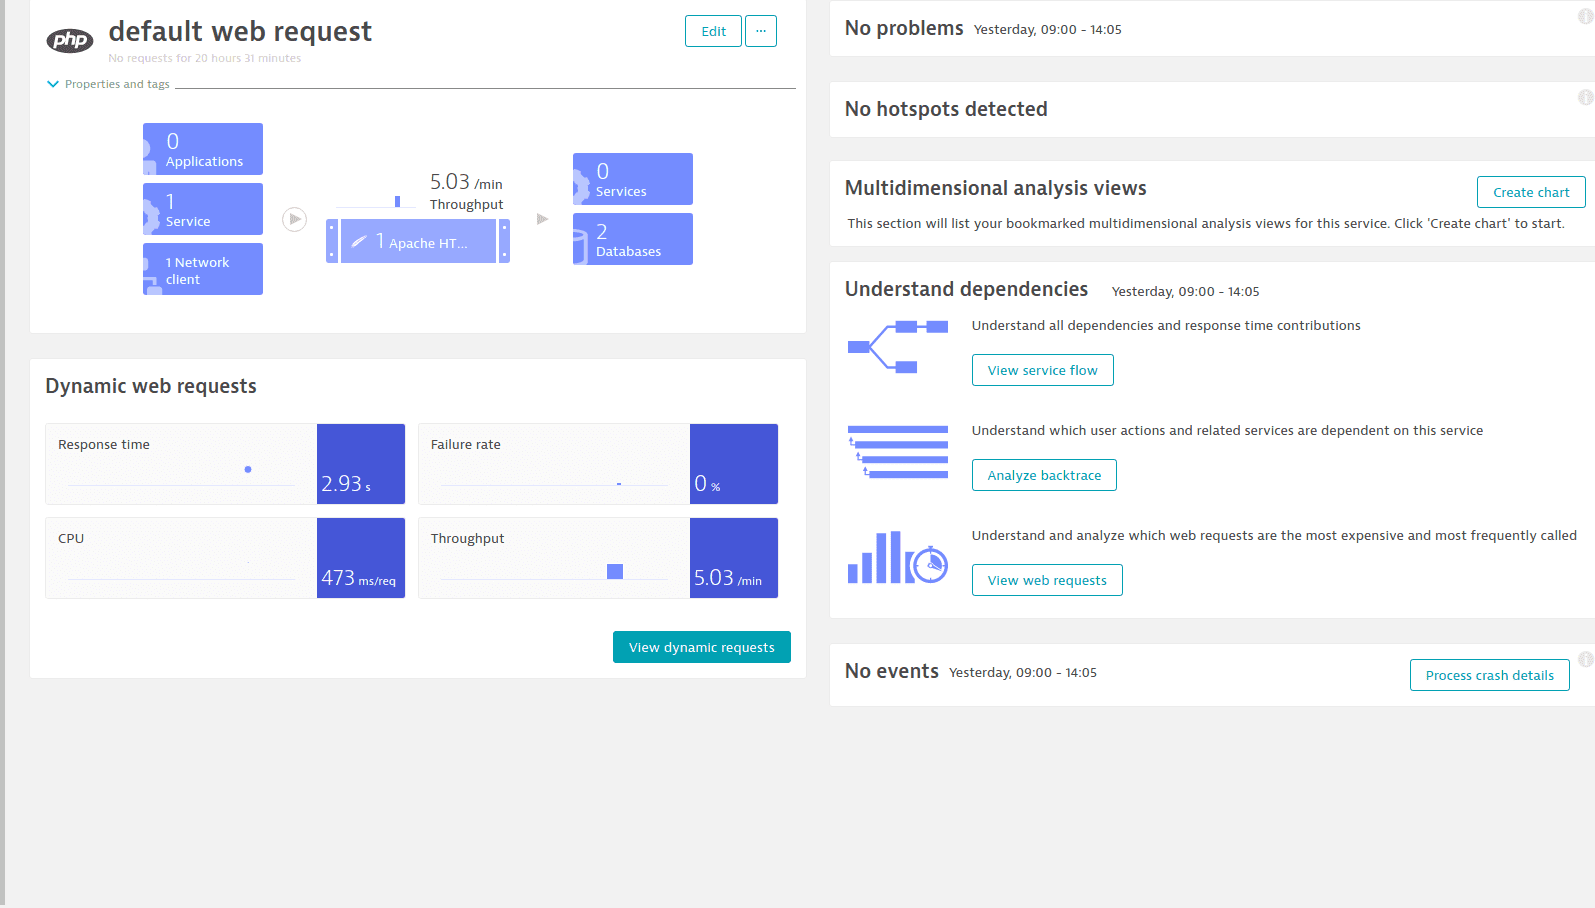
Example: PHP request
 Dynamic requests
 - Select View dynamic requests and then select a PHP request.
- Select View response time hotspots.
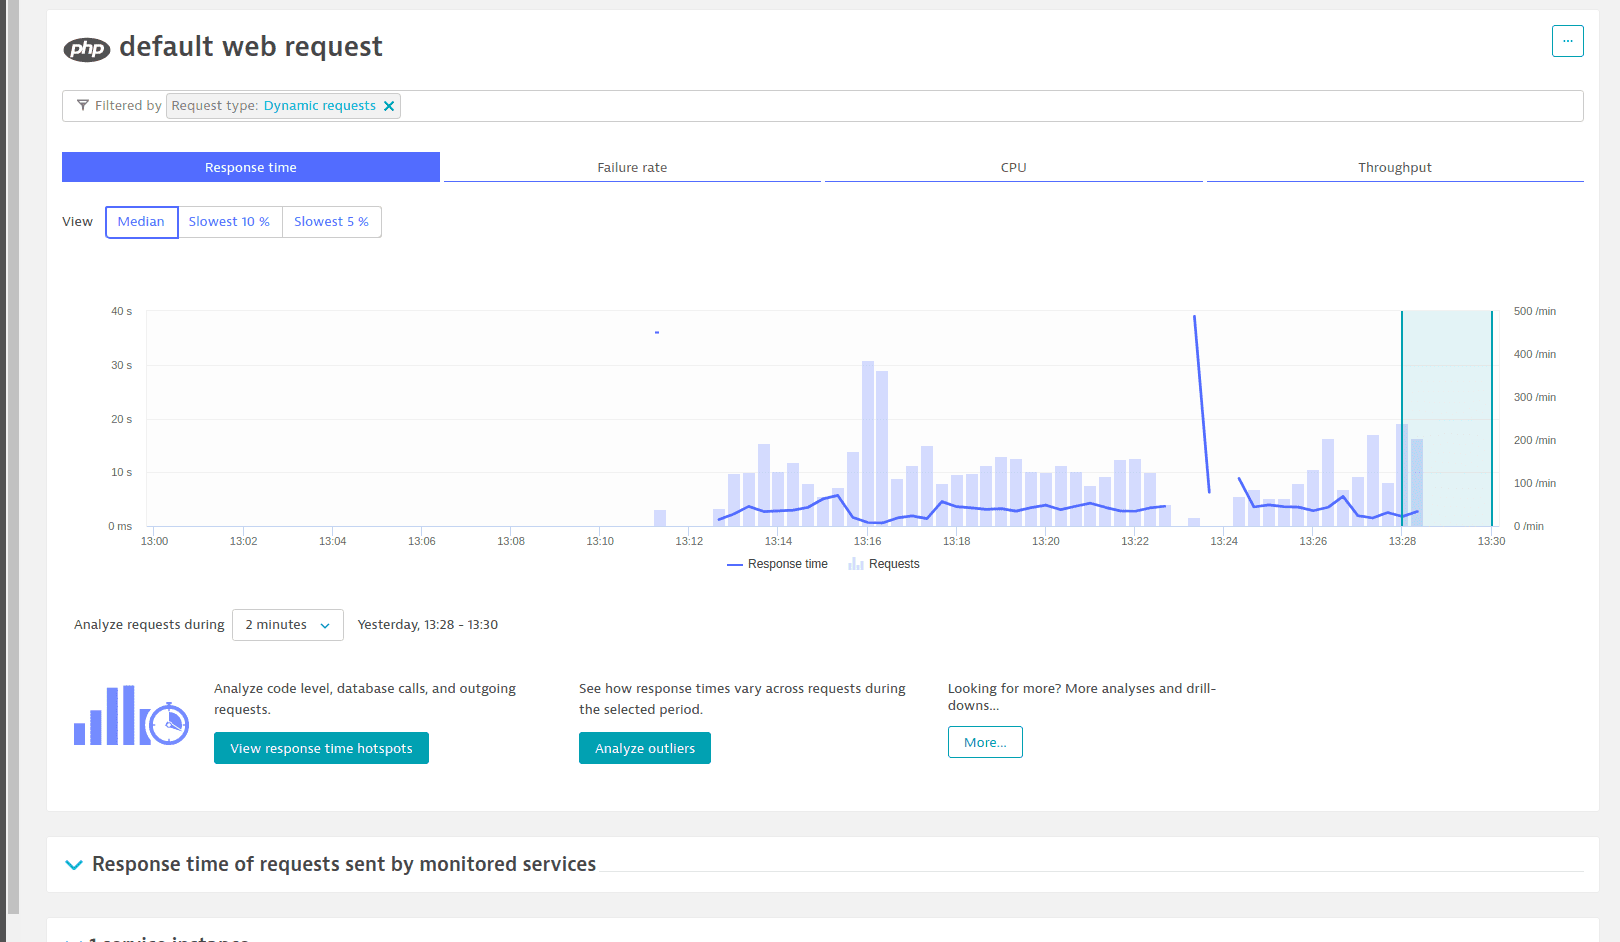
If you use FPM, select the FPM service and then select View response time hotspots to view the entire service or any individual request.Example: response time
 Response time
 - To view a breakdown of your request's code-level timings, select Analyze outliers or refer to the Response time tab.
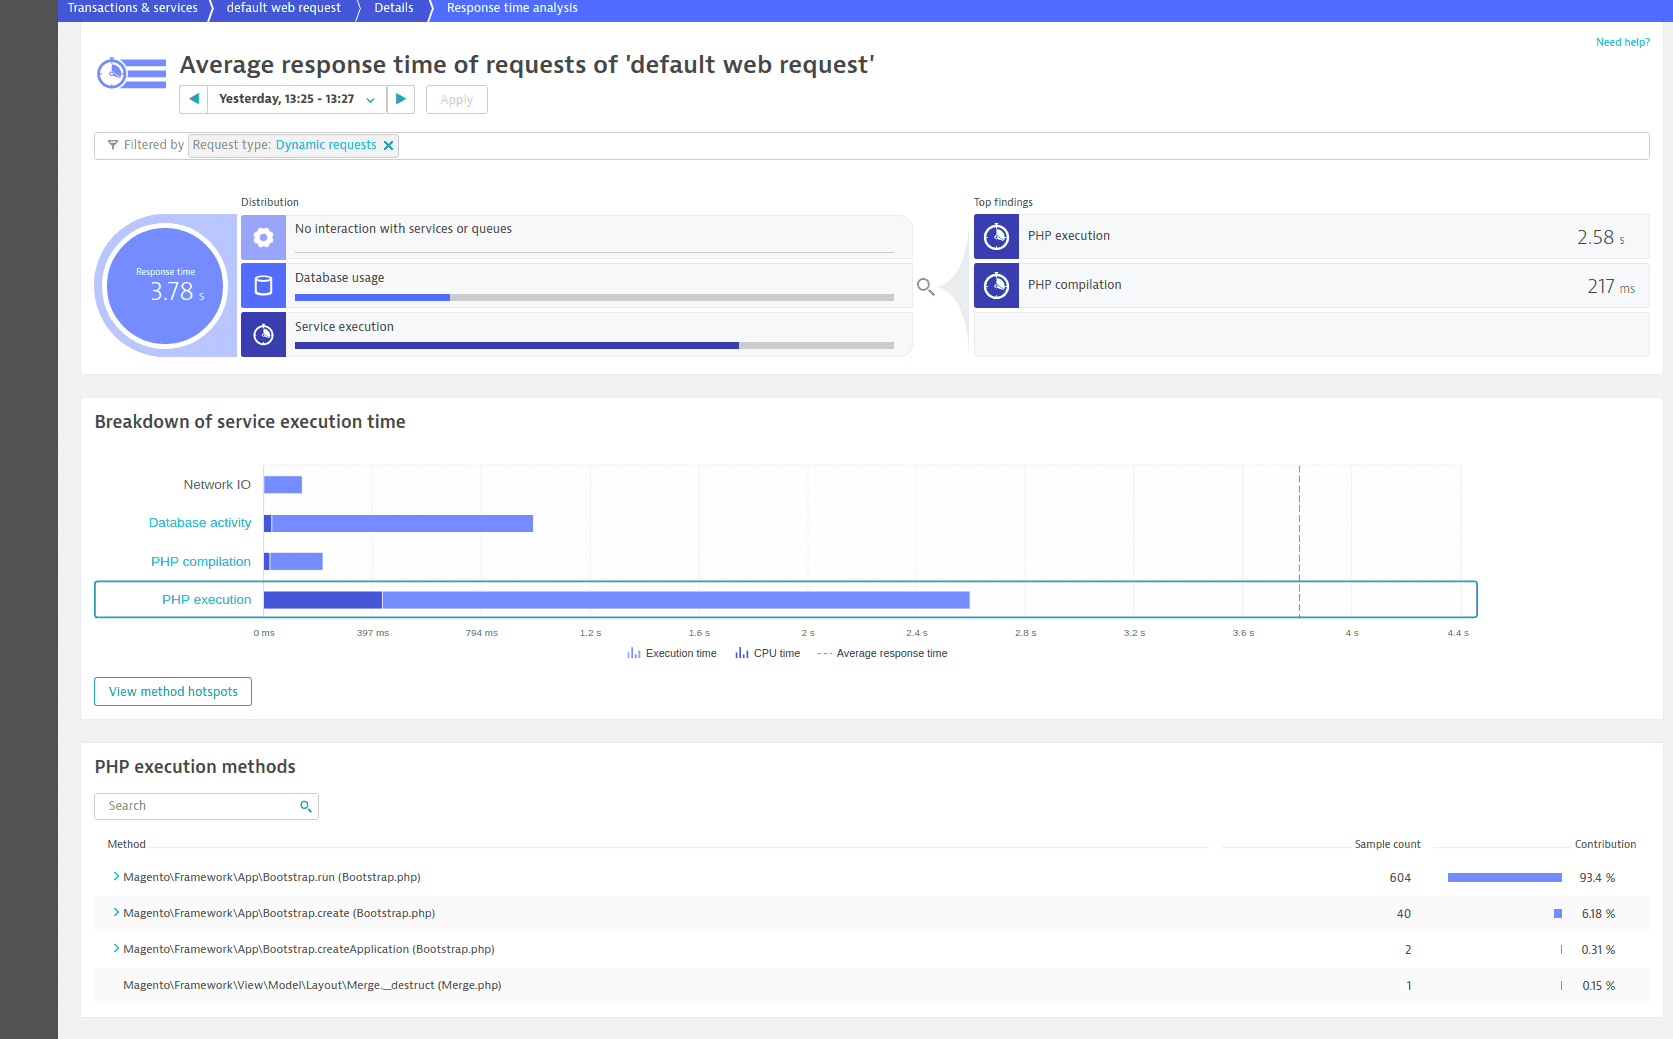
- To view method-level hotspots in your PHP code, on the Response time analysis page, select PHP execution.
Example: PHP execution
 PHP execution
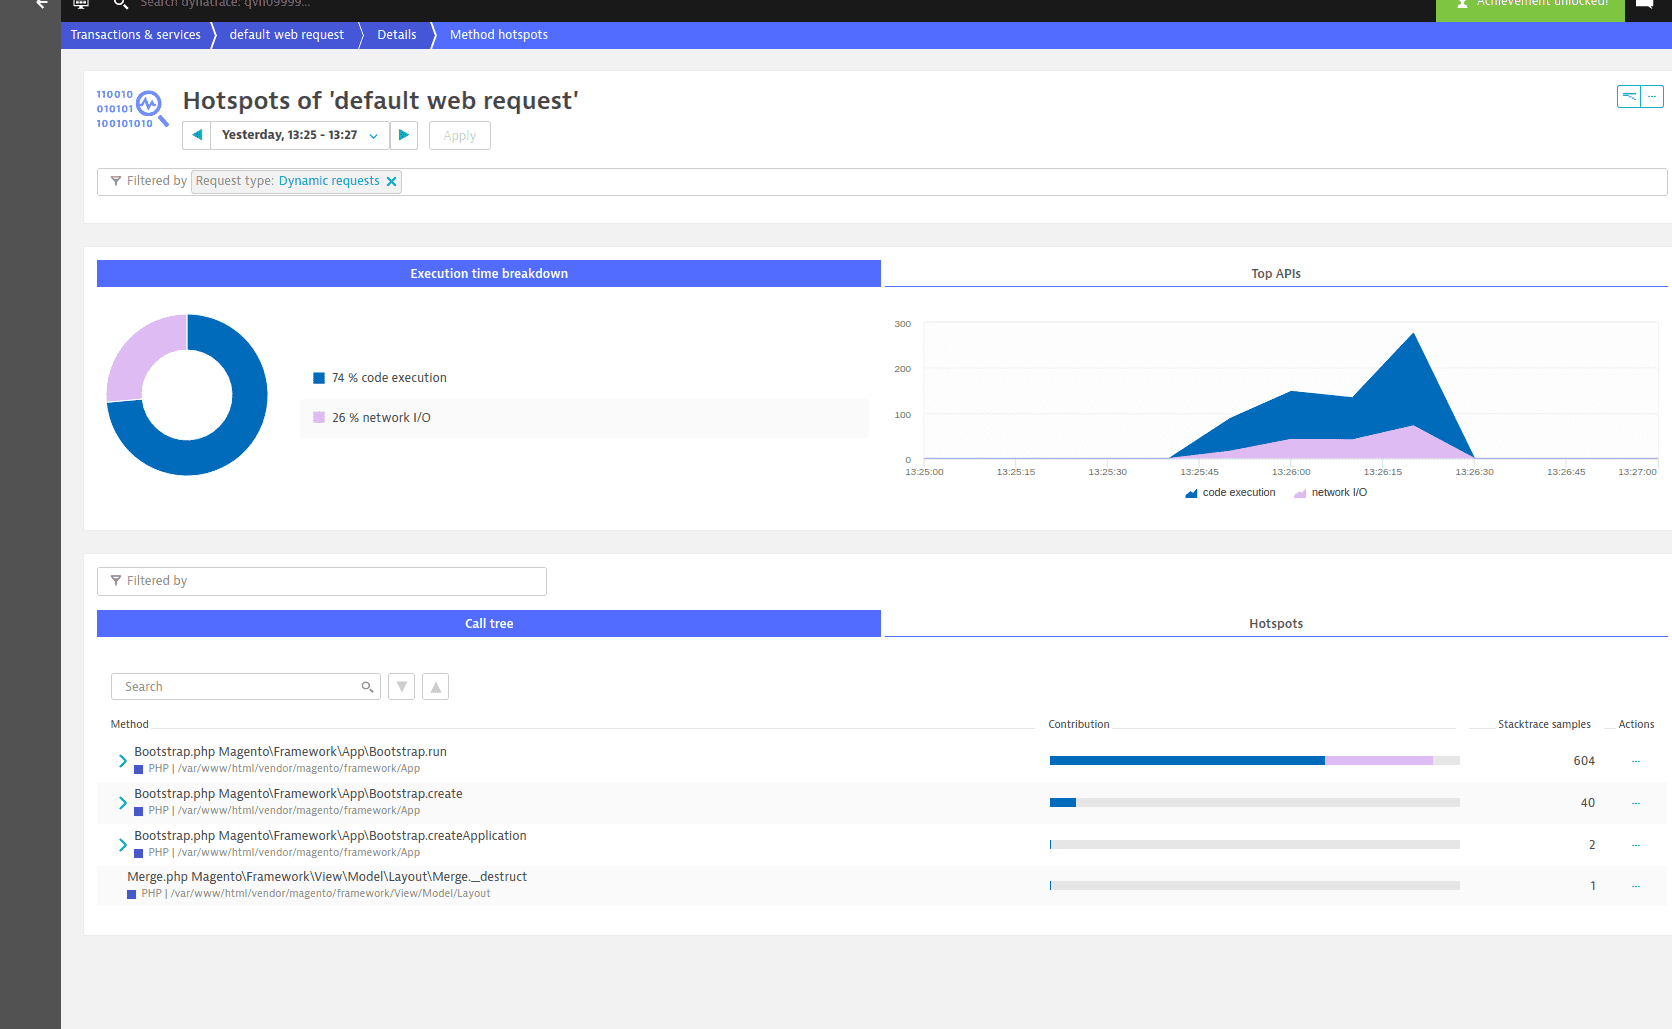
 - To examine CPU consumption of code at the method level, select the CPU tab and then select View method hotspots, where you can display charts for Execution time and Top APIs. You can also check Call hierarchy and Hotspots for the overall contribution of every file/method called.
Example: view method hotspots
 View method hotspots