Full code-level visibility
- Latest Dynatrace
- 1-min read
- Published Apr 15, 2019
Go applications compile directly to CPU machine code. Go lacks the abstracting layer of a virtual machine with defined monitoring hooks, like Java JVM or .NET CLR. Therefore, Dynatrace OneAgent operates on the CPU instruction level to intercept Go function calls. Go parallel processing capabilities are unique, and OneAgent is optimized to avoid implicit synchronization points between Goroutines when capturing monitoring data.
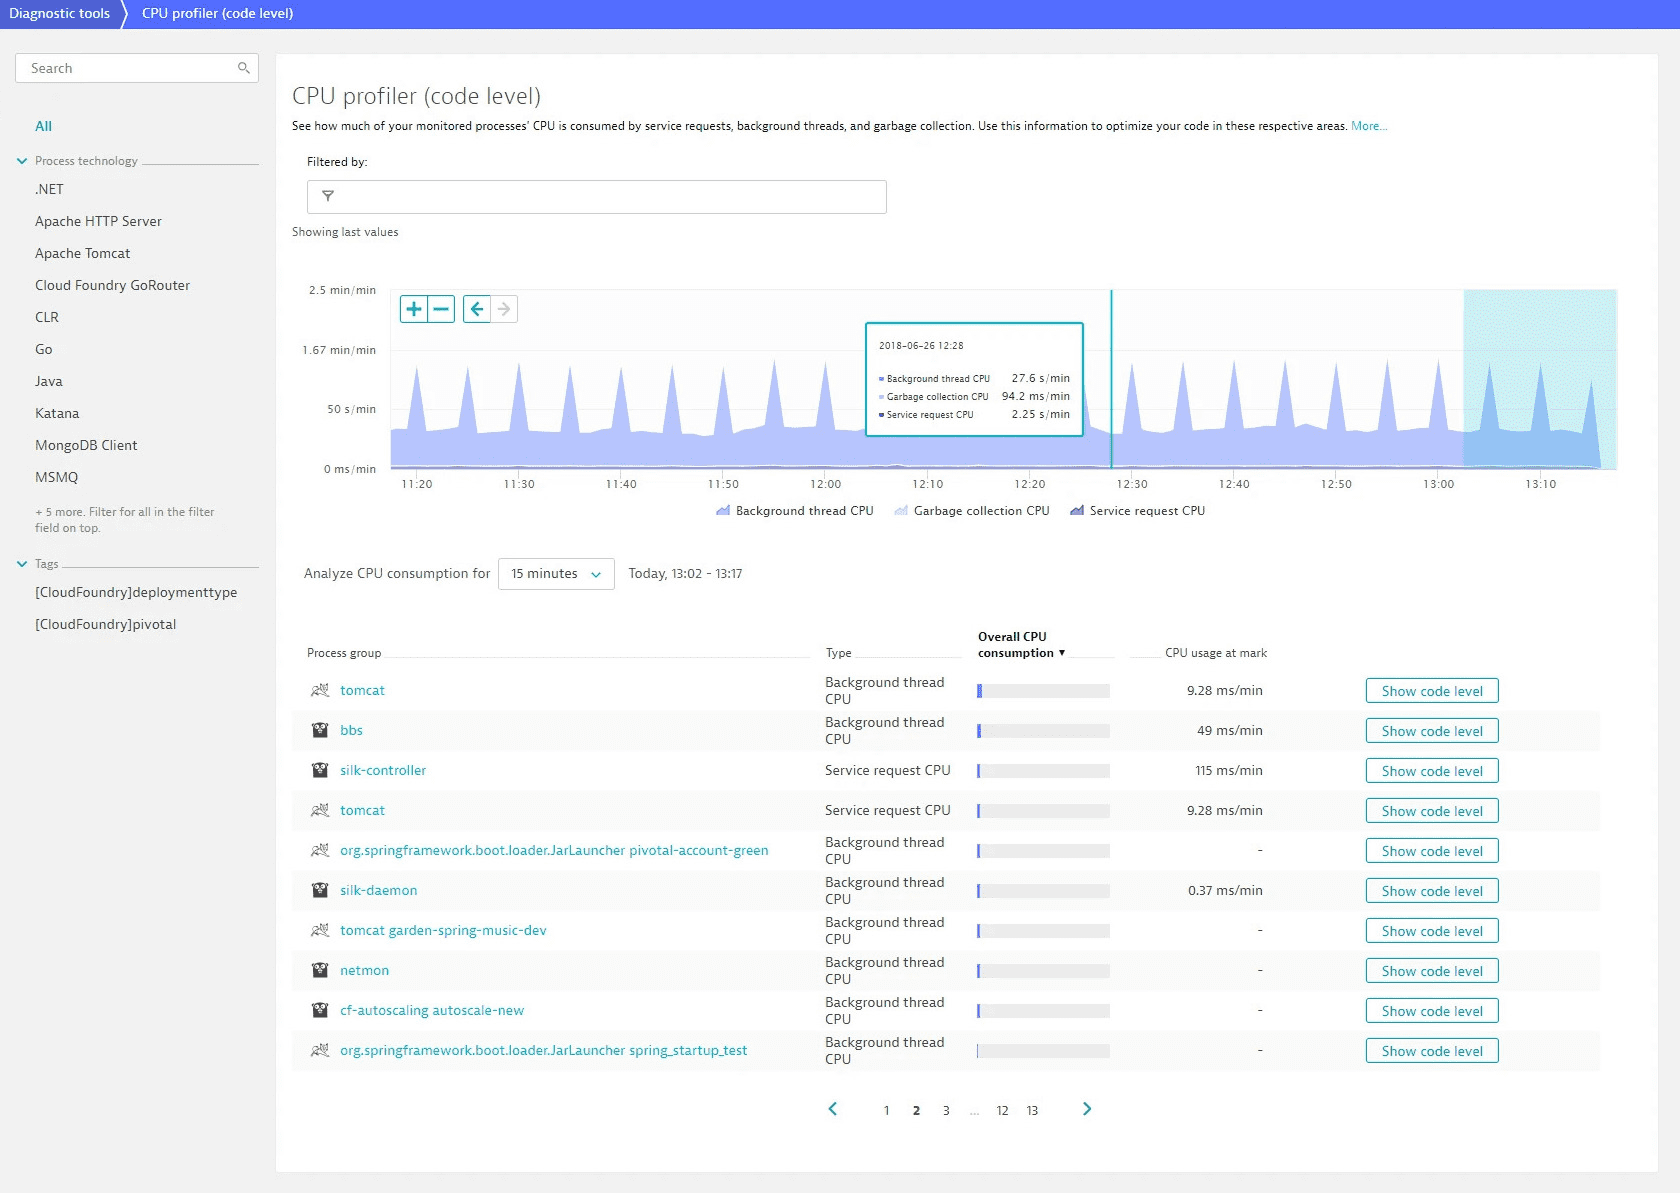
The process and service overview pages as well as hotspot views and distributed traces provide valuable insights into the processing details of your Golang applications and may help uncover critical issues in time. The CPU profiler enables you to investigate code that's executed outside the context of a web request, for example, background activities and schedulers.

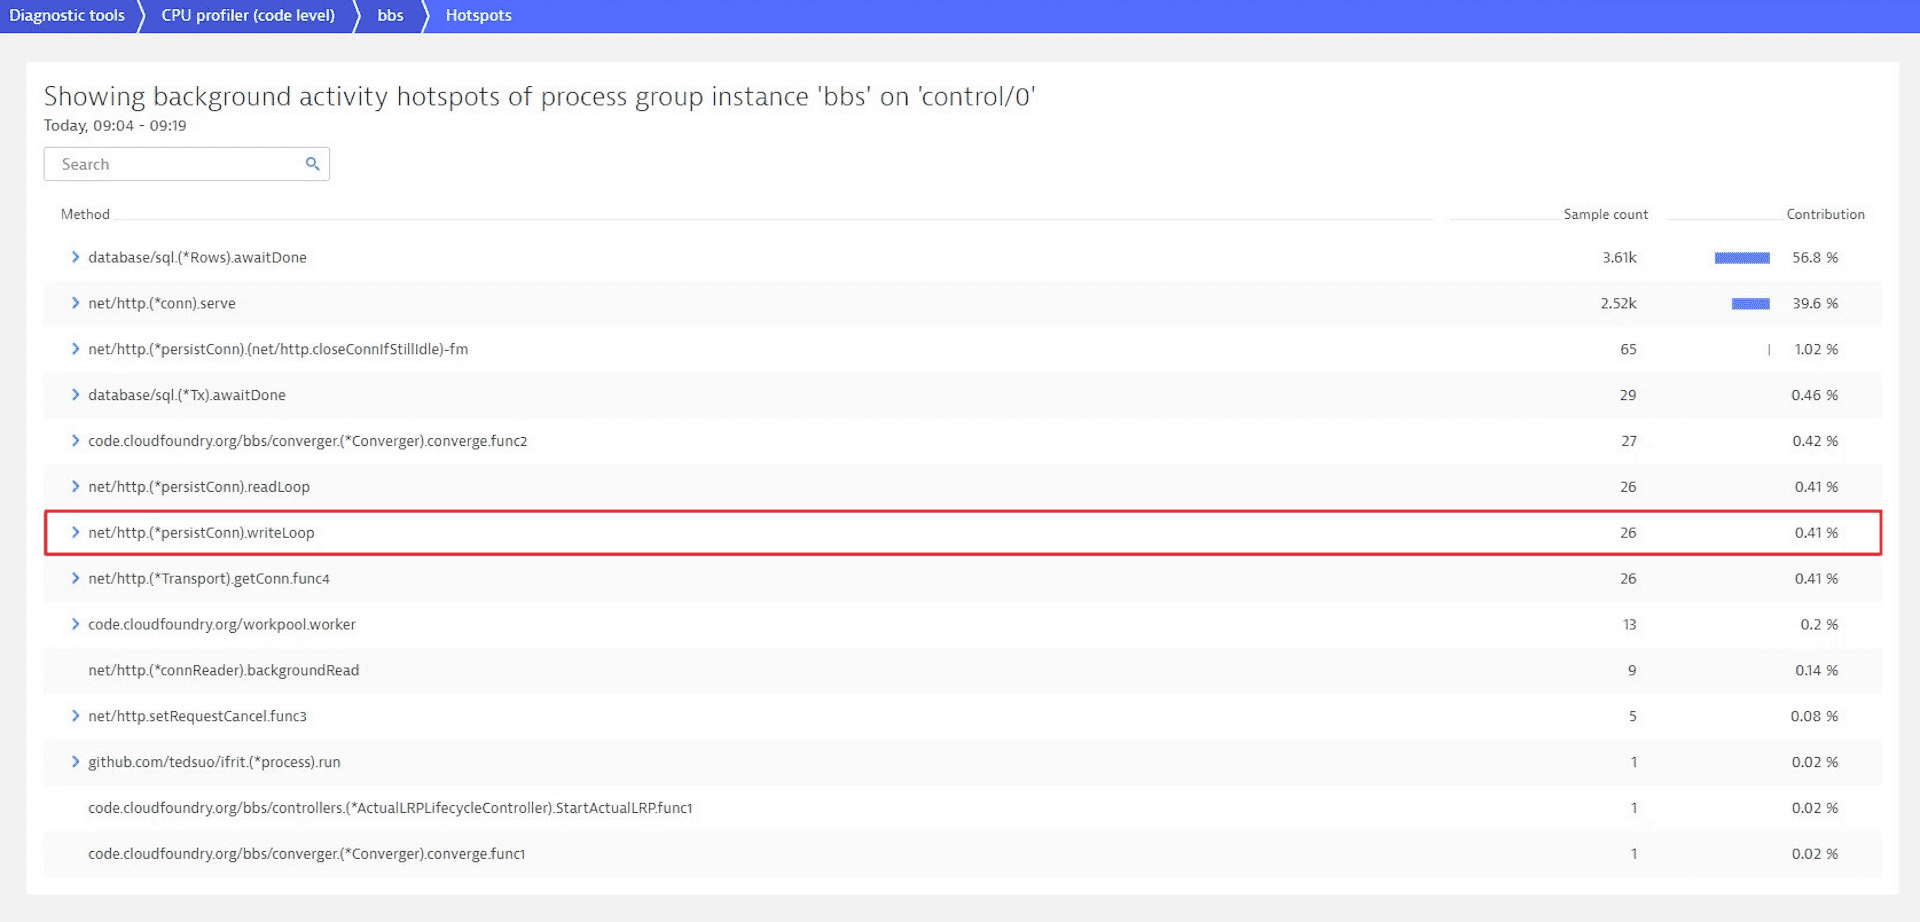
Dynatrace OneAgent can tell the application code executed in context of a distributed trace (for example, an incoming web request) from the code executed in the background. Background thread CPU and Service request CPU are tracked separately. For instance, check the screenshot below—the Go net/http package spawns a new Goroutine for each incoming web request or connection. That is why the Goroutine executing the web request handler function is tagged as service-related. Other Goroutines, which started before the processing of the web request, are also considered to be part of the service execution and are therefore also tagged. On the other hand, processing done by Goroutines that don't have the service-related tag is accounted for as a background activity.
