Monitor Azure Spring Apps
- Latest Dynatrace
- How-to guide
- 3-min read
- Published Aug 19, 2020
Dynatrace ingests metrics for multiple preselected namespaces, including Azure Spring Apps. You can view metrics for each service instance, split metrics into multiple dimensions, and create custom charts that you can pin to your dashboards.
Prerequisites
- Dynatrace version 1.200+
- Environment ActiveGate version 1.195+
Enable monitoring
To learn how to enable service monitoring, see Enable service monitoring.
Activate OneAgent Recommended
For an end-to-end view into your Spring Apps workloads, you can set up OneAgent integration with Azure Spring Apps.
View service metrics
You can view the service metrics in your Dynatrace environment either on the custom device overview page or on your Dashboards page.
View metrics on the custom device overview page
To access the custom device overview page
- Go to
 Technologies & Processes Classic.
 - Filter by service name and select the relevant custom device group.
- Once you select the custom device group, you're on the custom device group overview page.
- The custom device group overview page lists all instances (custom devices) belonging to the group. Select an instance to view the custom device overview page.
View metrics on your dashboard
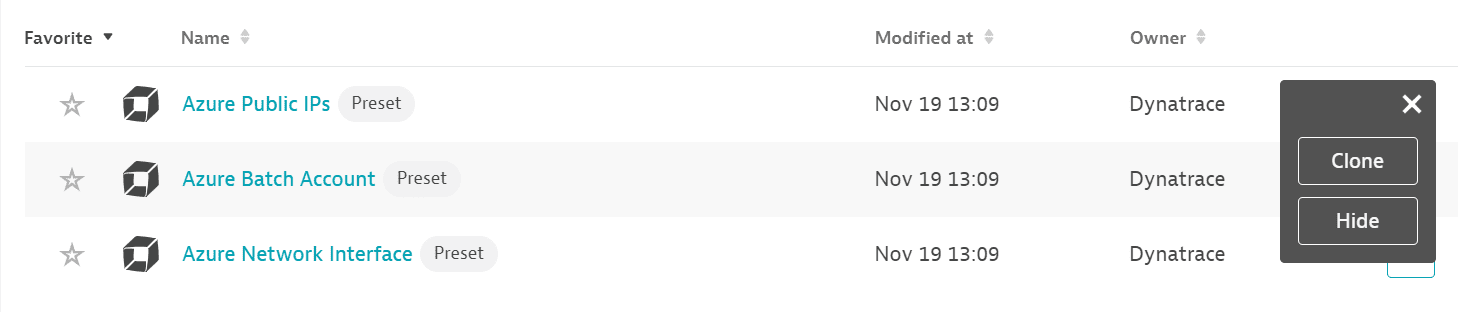
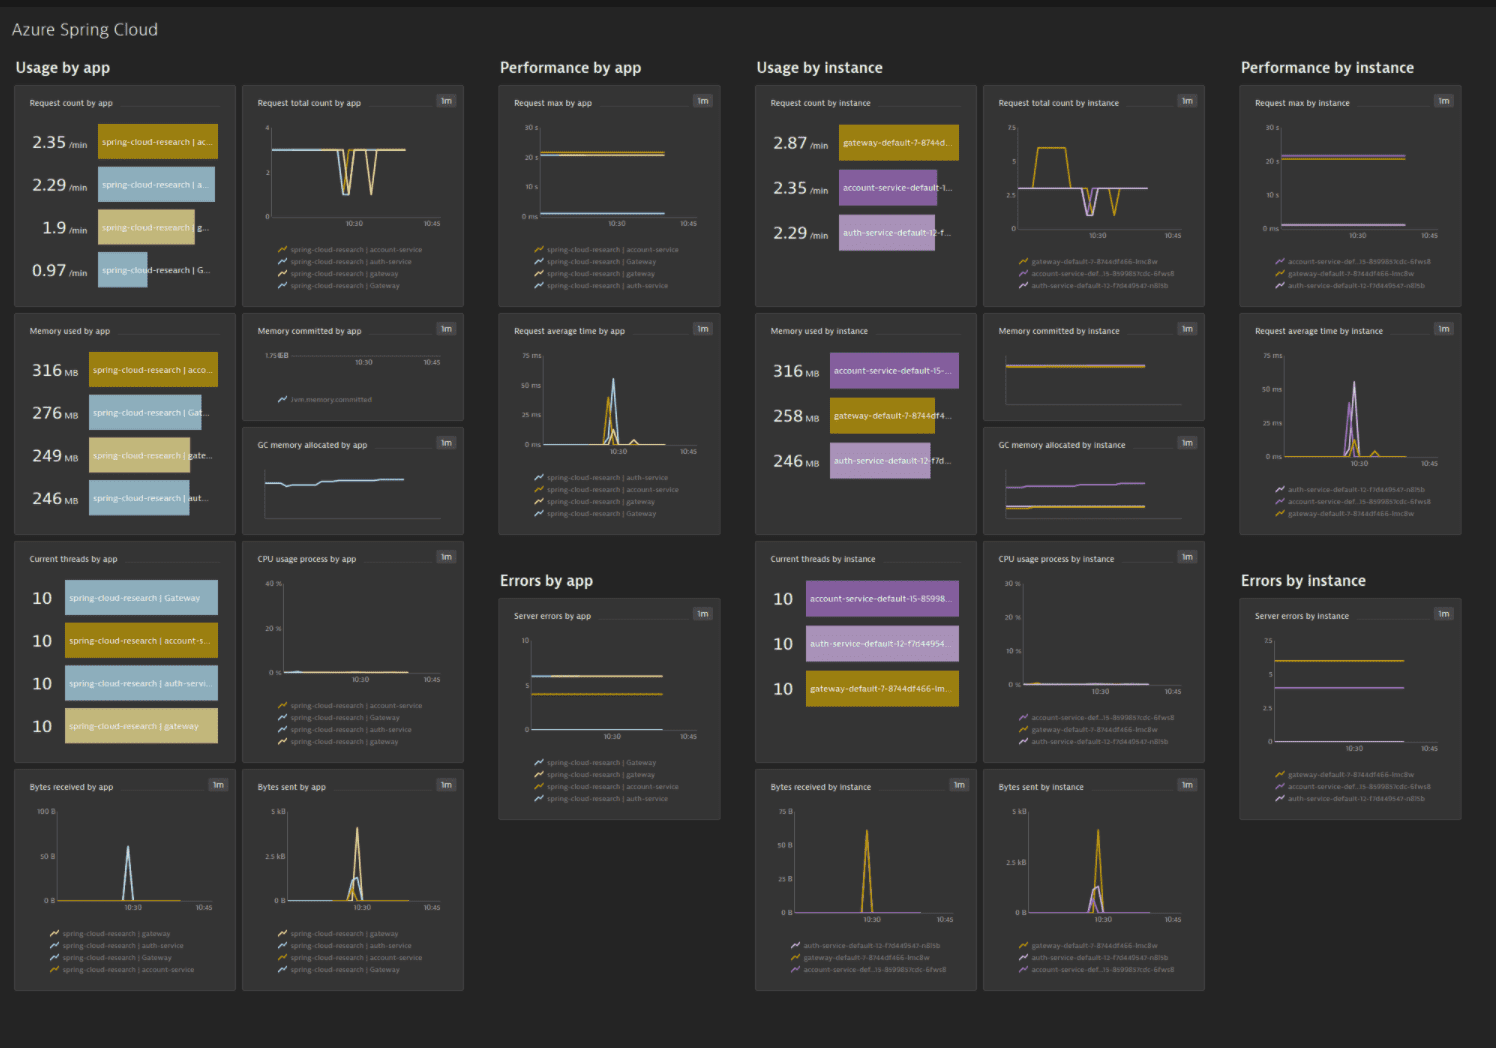
If the service has a preset dashboard, you'll get a preset dashboard for the respective service containing all recommended metrics on your Dashboards page. You can look for specific dashboards by filtering by Preset and then by Name.
For existing monitored services, you might need to resave your credentials for the preset dashboard to appear on the Dashboards page. To resave your credentials, go to Settings > Cloud and virtualization > Azure, select the desired Azure instance, then select Save.
You can't make changes on a preset dashboard directly, but you can clone and edit it. To clone a dashboard, open the browse menu (…) and select Clone.
To remove a dashboard from the dashboards list, you can hide it. To hide a dashboard, open the browse menu (…) and select Hide.
Hiding a dashboard doesn't affect other users.
Available metrics
| Name | Description | Dimensions | Unit | Recommended |
|---|---|---|---|---|
jvm.gc.live.data.size | Size of old generation memory pool after a full GC | AppName, Pod | Byte |
|
jvm.gc.max.data.size | Max size of old generation memory pool | AppName, Pod | Byte |
|
jvm.gc.memory.allocated | Incremented for an increase in the size of the young generation memory pool after one GC to before the next | AppName, Pod | Byte |
|
jvm.gc.memory.promoted | Count of positive increases in the size of the old generation memory pool before GC to after GC | AppName, Pod | Byte |
|
jvm.gc.pause.total.count | GC pause count | AppName, Pod | Count |
|
jvm.gc.pause.total.time | GC pause total time | AppName, Pod | MilliSecond |
|
jvm.memory.committed | Memory assigned to JVM in bytes | AppName, Pod | Byte |
|
jvm.memory.max | The maximum amount of memory in bytes that can be used for memory management | AppName, Pod | Byte |
|
jvm.memory.used | App memory used in bytes | AppName, Pod | Byte |
|
process.cpu.usage | App JVM CPU usage percentage | AppName, Pod | Percent |
|
system.cpu.usage | The recent CPU usage for the whole system | AppName, Pod | Percent |
|
tomcat.global.error | Tomcat global error | AppName, Pod | Count |
|
tomcat.global.received | Tomcat total received bytes | AppName, Pod | Byte |
|
tomcat.global.request.avg.time | Tomcat request average time | AppName, Pod | MilliSecond |
|
tomcat.global.request.max | Tomcat request maximum time | AppName, Pod | MilliSecond |
|
tomcat.global.request.total.count | Tomcat request total count | AppName, Pod | Count |
|
tomcat.global.request.total.time | Tomcat request total time | AppName, Pod | MilliSecond |
|
tomcat.global.sent | Tomcat total sent bytes | AppName, Pod | Byte |
|
tomcat.sessions.active.current | Tomcat session active count | AppName, Pod | Count |
|
tomcat.sessions.active.max | Tomcat session maximum active count | AppName, Pod | Count |
|
tomcat.sessions.alive.max | Tomcat session maximum alive time | AppName, Pod | MilliSecond |
|
tomcat.sessions.created | Tomcat session created count | AppName, Pod | Count |
|
tomcat.sessions.expired | Tomcat session expired count | AppName, Pod | Count |
|
tomcat.sessions.rejected | Tomcat session rejected count | AppName, Pod | Count |
|
tomcat.threads.config.max | Tomcat configuration maximum thread count | AppName, Pod | Count |
|
tomcat.threads.current | Tomcat current thread count | AppName, Pod | Count |
|