Azure Storage Sync monitoring
- Latest Dynatrace
- How-to guide
- 2-min read
- Published Sep 23, 2020
Dynatrace ingests metrics from Azure Metrics API for Azure Storage Sync. You can view metrics for each service instance, split metrics into multiple dimensions, and create custom charts that you can pin to your dashboards.
Prerequisites
- Dynatrace version 1.203+
- Environment ActiveGate version 1.195+
Enable monitoring
To learn how to enable service monitoring, see Enable service monitoring.
View service metrics
You can view the service metrics in your Dynatrace environment either on the custom device overview page or on your Dashboards page.
View metrics on the custom device overview page
To access the custom device overview page
- Go to
 Technologies & Processes Classic.
 - Filter by service name and select the relevant custom device group.
- Once you select the custom device group, you're on the custom device group overview page.
- The custom device group overview page lists all instances (custom devices) belonging to the group. Select an instance to view the custom device overview page.
View metrics on your dashboard
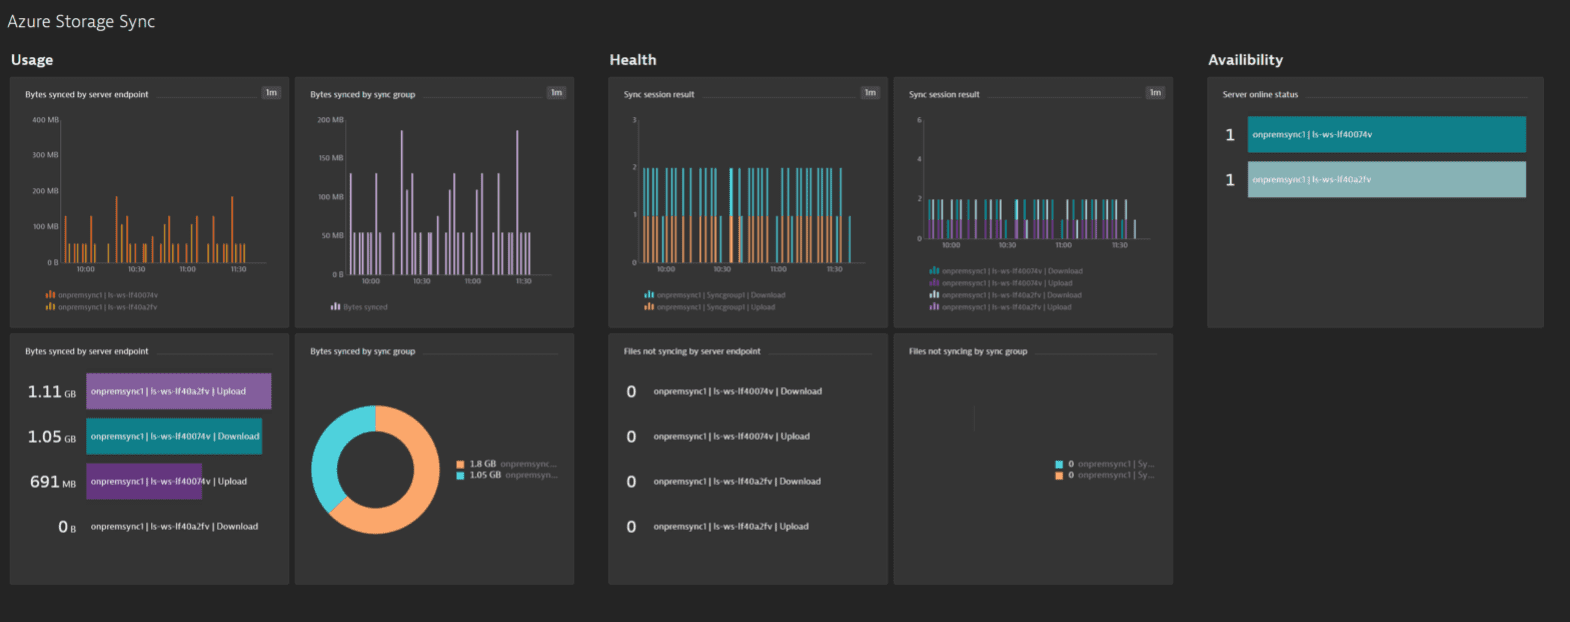
If the service has a preset dashboard, you'll get a preset dashboard for the respective service containing all recommended metrics on your Dashboards page. You can look for specific dashboards by filtering by Preset and then by Name.
For existing monitored services, you might need to resave your credentials for the preset dashboard to appear on the Dashboards page. To resave your credentials, go to Settings > Cloud and virtualization > Azure, select the desired Azure instance, then select Save.
You can't make changes on a preset dashboard directly, but you can clone and edit it. To clone a dashboard, open the browse menu (…) and select Clone.
To remove a dashboard from the dashboards list, you can hide it. To hide a dashboard, open the browse menu (…) and select Hide.
Hiding a dashboard doesn't affect other users.

Available metrics
| Name | Description | Dimensions | Unit | Recommended |
|---|---|---|---|---|
| ServerSyncSessionResult | Logs a value of 1 each time the server endpoint successfully completes a sync session with the cloud endpoint | Sync group name, Server endpoint name, Sync direction | Count | |
| StorageSyncSyncSessionAppliedFilesCount | The number of files synced | Sync group name, Server endpoint name, Sync direction | Count | |
| StorageSyncSyncSessionPerItemErrorsCount | The number of files that failed to sync | Sync group name, Server endpoint name, Sync direction | Count | |
| StorageSyncBatchTransferredFileBytes | The total file size transferred for sync sessions | Sync group name, Server endpoint name, Sync direction | Byte | |
| StorageSyncServerHeartbeat | Logs a value of 1 each time the registered server successfully records a heartbeat with the cloud endpoint | Server name | Count | |
| StorageSyncRecallIOTotalSizeBytes | The total size of data recalled by the server | Server name | Byte | |
| StorageSyncRecalledTotalNetworkBytes | The size of data recalled | Sync group name, Server name | Byte | |
| StorageSyncRecallThroughputBytesPerSecond | The size of data recall throughput | Sync group name, Server name | BytePerSecond | |
| StorageSyncRecalledNetworkBytesByApplication | The size of data recalled by application | Sync group name, Server name, Application name | Byte |