Azure Gateway Load Balancer monitoring
- Dynatrace Classic
- How-to guide
- 1-min read
For information about differences between classic services and other services, see Migrate from Azure classic (formerly 'built-in') services to cloud services.
Dynatrace ingests metrics from Azure Metrics API for Azure Gateway Load Balancer. You can view metrics for each service instance, split metrics into multiple dimensions, and create custom charts that you can pin to your dashboards.
Prerequisites
- Dynatrace version 1.199+
- Environment ActiveGate version 1.195+
Enable monitoring
To learn how to enable service monitoring, see Enable service monitoring.
View service metrics
You can view the service metrics in your Dynatrace environment either on the custom device overview page or on your Dashboards page.
View metrics on the custom device overview page
To access the custom device overview page
- Go to
 Technologies & Processes Classic.
 - Filter by service name and select the relevant custom device group.
- Once you select the custom device group, you're on the custom device group overview page.
- The custom device group overview page lists all instances (custom devices) belonging to the group. Select an instance to view the custom device overview page.
View metrics on your dashboard
If the service has a preset dashboard, you'll get a preset dashboard for the respective service containing all recommended metrics on your Dashboards page. You can look for specific dashboards by filtering by Preset and then by Name.
For existing monitored services, you might need to resave your credentials for the preset dashboard to appear on the Dashboards page. To resave your credentials, go to Settings > Cloud and virtualization > Azure, select the desired Azure instance, then select Save.
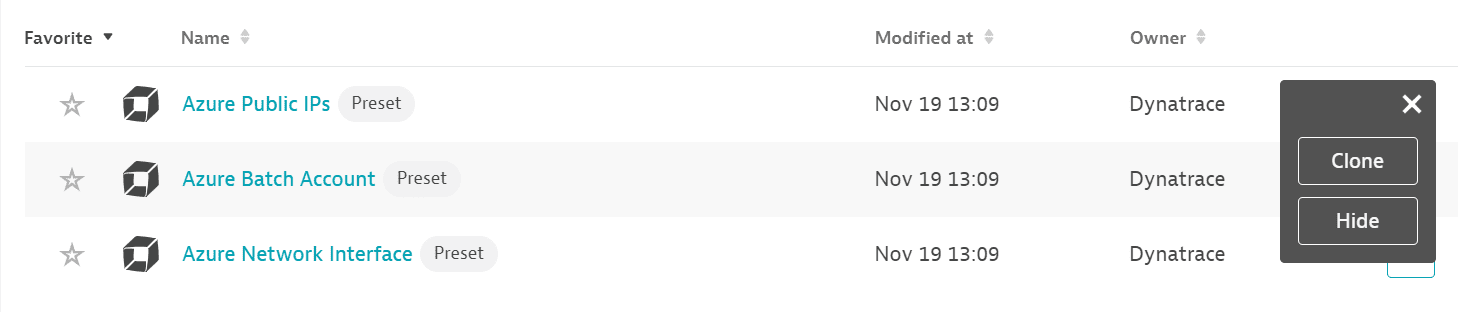
You can't make changes on a preset dashboard directly, but you can clone and edit it. To clone a dashboard, open the browse menu (…) and select Clone.
To remove a dashboard from the dashboards list, you can hide it. To hide a dashboard, open the browse menu (…) and select Hide.
Hiding a dashboard doesn't affect other users.
Available metrics
This service monitors a part of Azure Load Balancer (Microsoft.Network/loadBalancers). While you have this service configured, you can't have Azure Load Balancers (built-in) service turned on.
| Name | Description | Dimensions | Unit | Recommended |
|---|---|---|---|---|
Data path availability | Average Load Balancer data path availability per time duration | Frontend IP address, Frontend port | Count |
|
Health probe status | Average Load Balancer health probe status per time duration | Protocol type, Backend port, Frontend IP address, Frontend port, Backend IP address | Count |
|
Byte count | Total number of Bytes transmitted within time period | Frontend IP address, Frontend port, Direction | Byte | |
Packet count | Total number of Packets transmitted within time period | Frontend IP address, Frontend port, Direction | Count |
|
SYN count | Total number of SYN Packets transmitted within time period | Frontend IP address, Frontend port, Direction | Count |