Azure Database for MariaDB monitoring
- Latest Dynatrace
- How-to guide
- 2-min read
- Published Jun 25, 2020
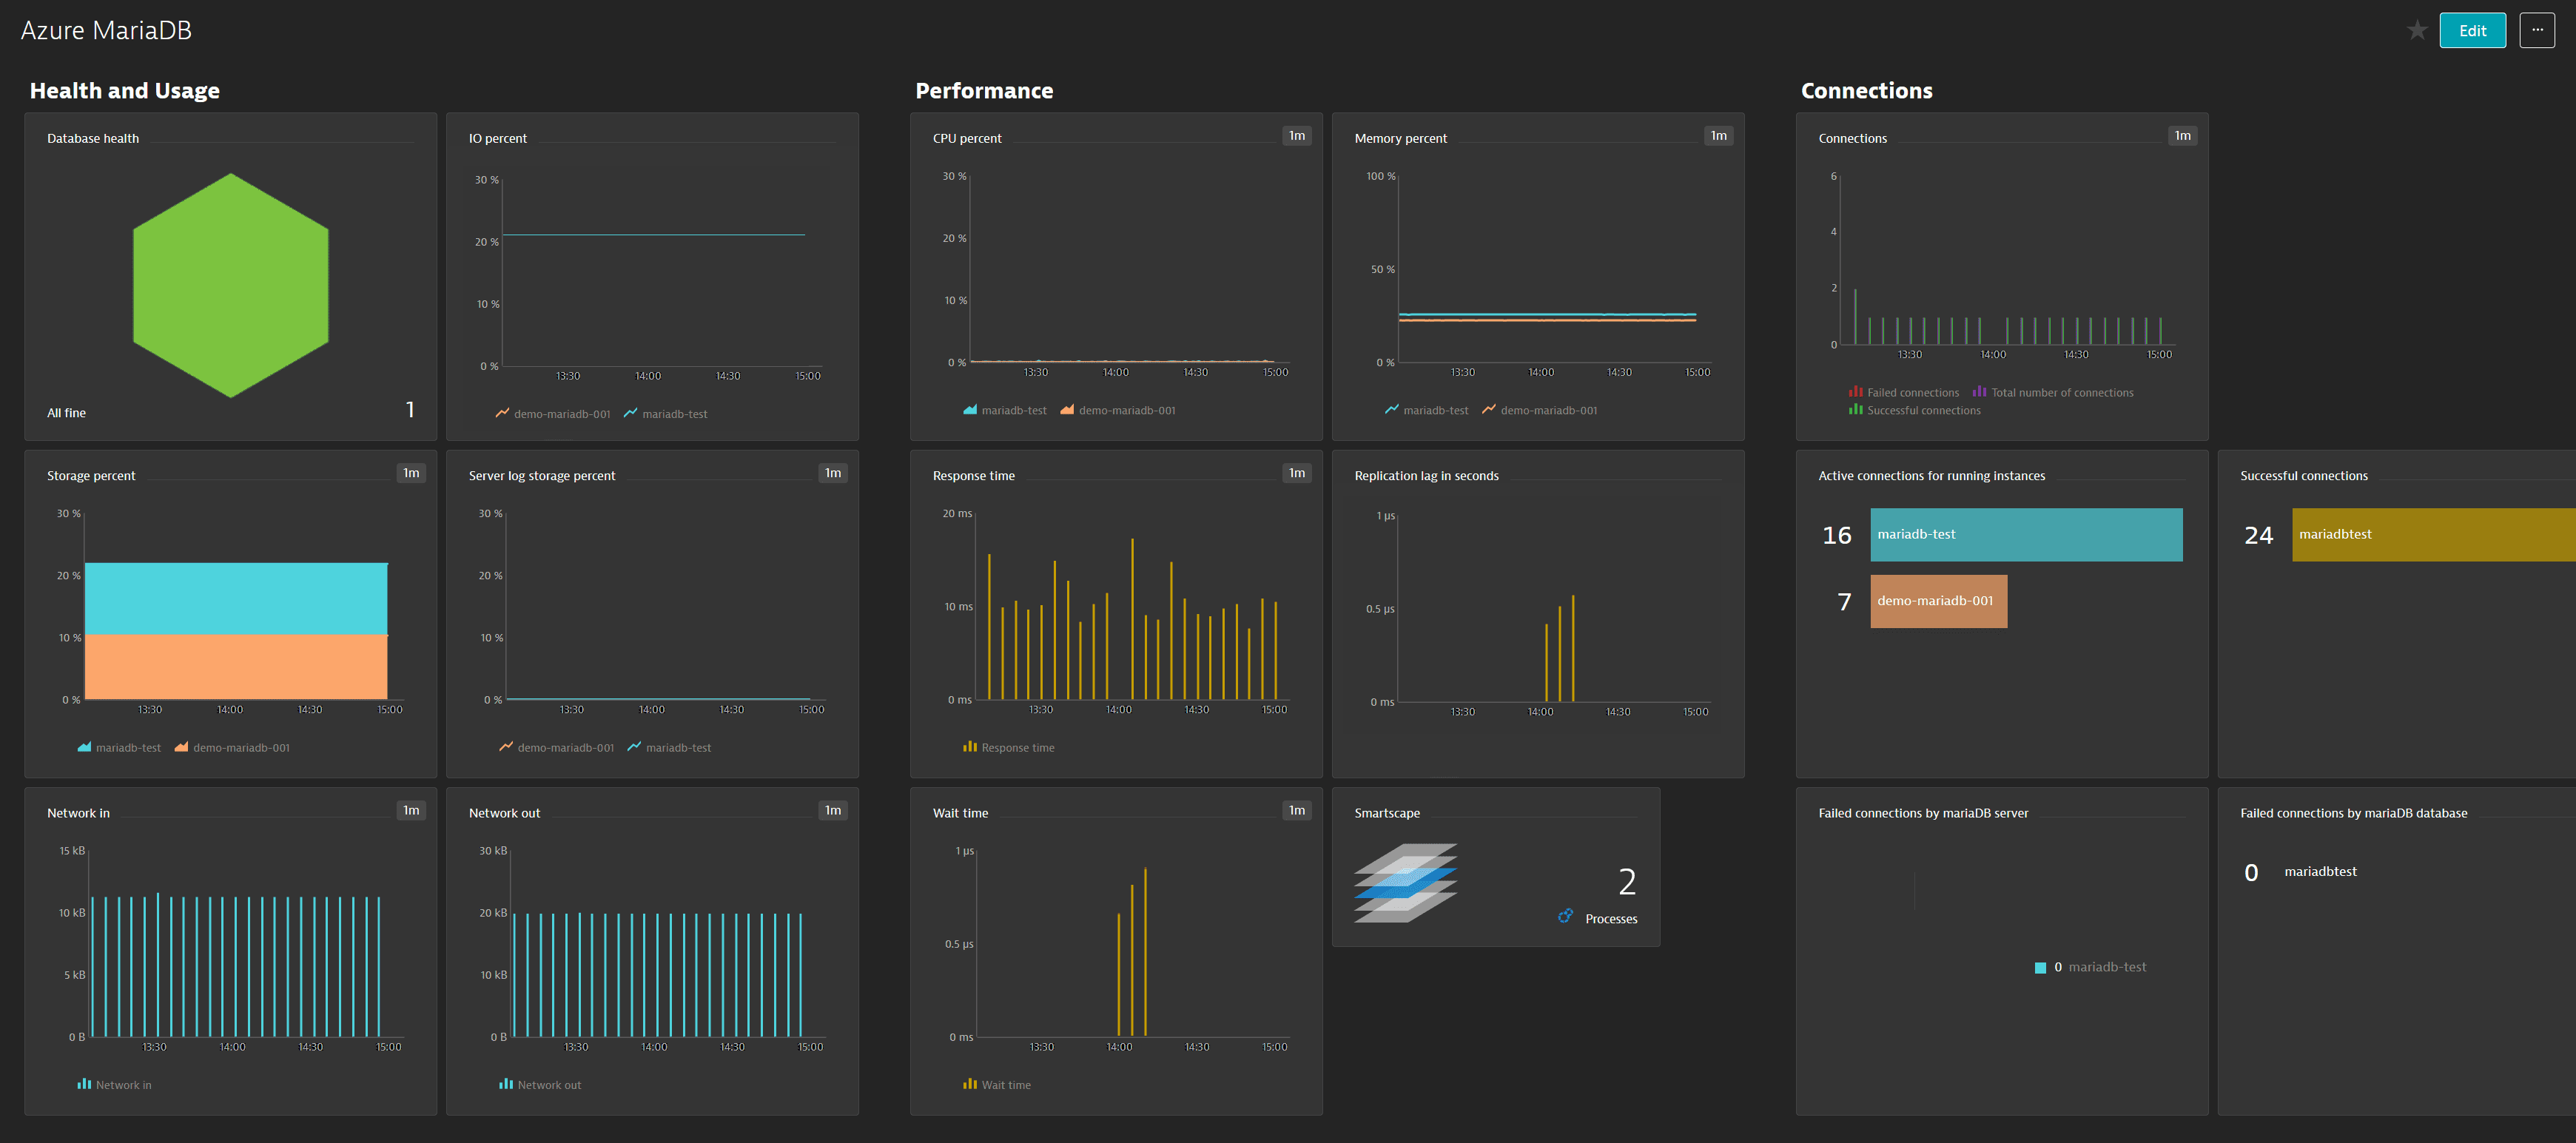
On the Azure Database for MariaDB overview page you can see if you’re running out of CPU or facing a high I/O percentage, so you always know which queries need to be optimized.
Prerequisites
- Dynatrace version 1.196+
- Environment ActiveGate version 1.195+
Enable monitoring
To learn how to enable service monitoring, see Enable service monitoring.
Optionally, for OneAgent integration, see how database activity is monitored.
View service metrics
You can view the service metrics in your Dynatrace environment either on the custom device overview page or on your Dashboards page.
View metrics on the custom device overview page
To access the custom device overview page
- Go to
 Technologies & Processes Classic.
 - Filter by service name and select the relevant custom device group.
- Once you select the custom device group, you're on the custom device group overview page.
- The custom device group overview page lists all instances (custom devices) belonging to the group. Select an instance to view the custom device overview page.
View metrics on your dashboard
If the service has a preset dashboard, you'll get a preset dashboard for the respective service containing all recommended metrics on your Dashboards page. You can look for specific dashboards by filtering by Preset and then by Name.
For existing monitored services, you might need to resave your credentials for the preset dashboard to appear on the Dashboards page. To resave your credentials, go to Settings > Cloud and virtualization > Azure, select the desired Azure instance, then select Save.
You can't make changes on a preset dashboard directly, but you can clone and edit it. To clone a dashboard, open the browse menu (…) and select Clone.
To remove a dashboard from the dashboards list, you can hide it. To hide a dashboard, open the browse menu (…) and select Hide.
Hiding a dashboard doesn't affect other users.

Set up a management zone
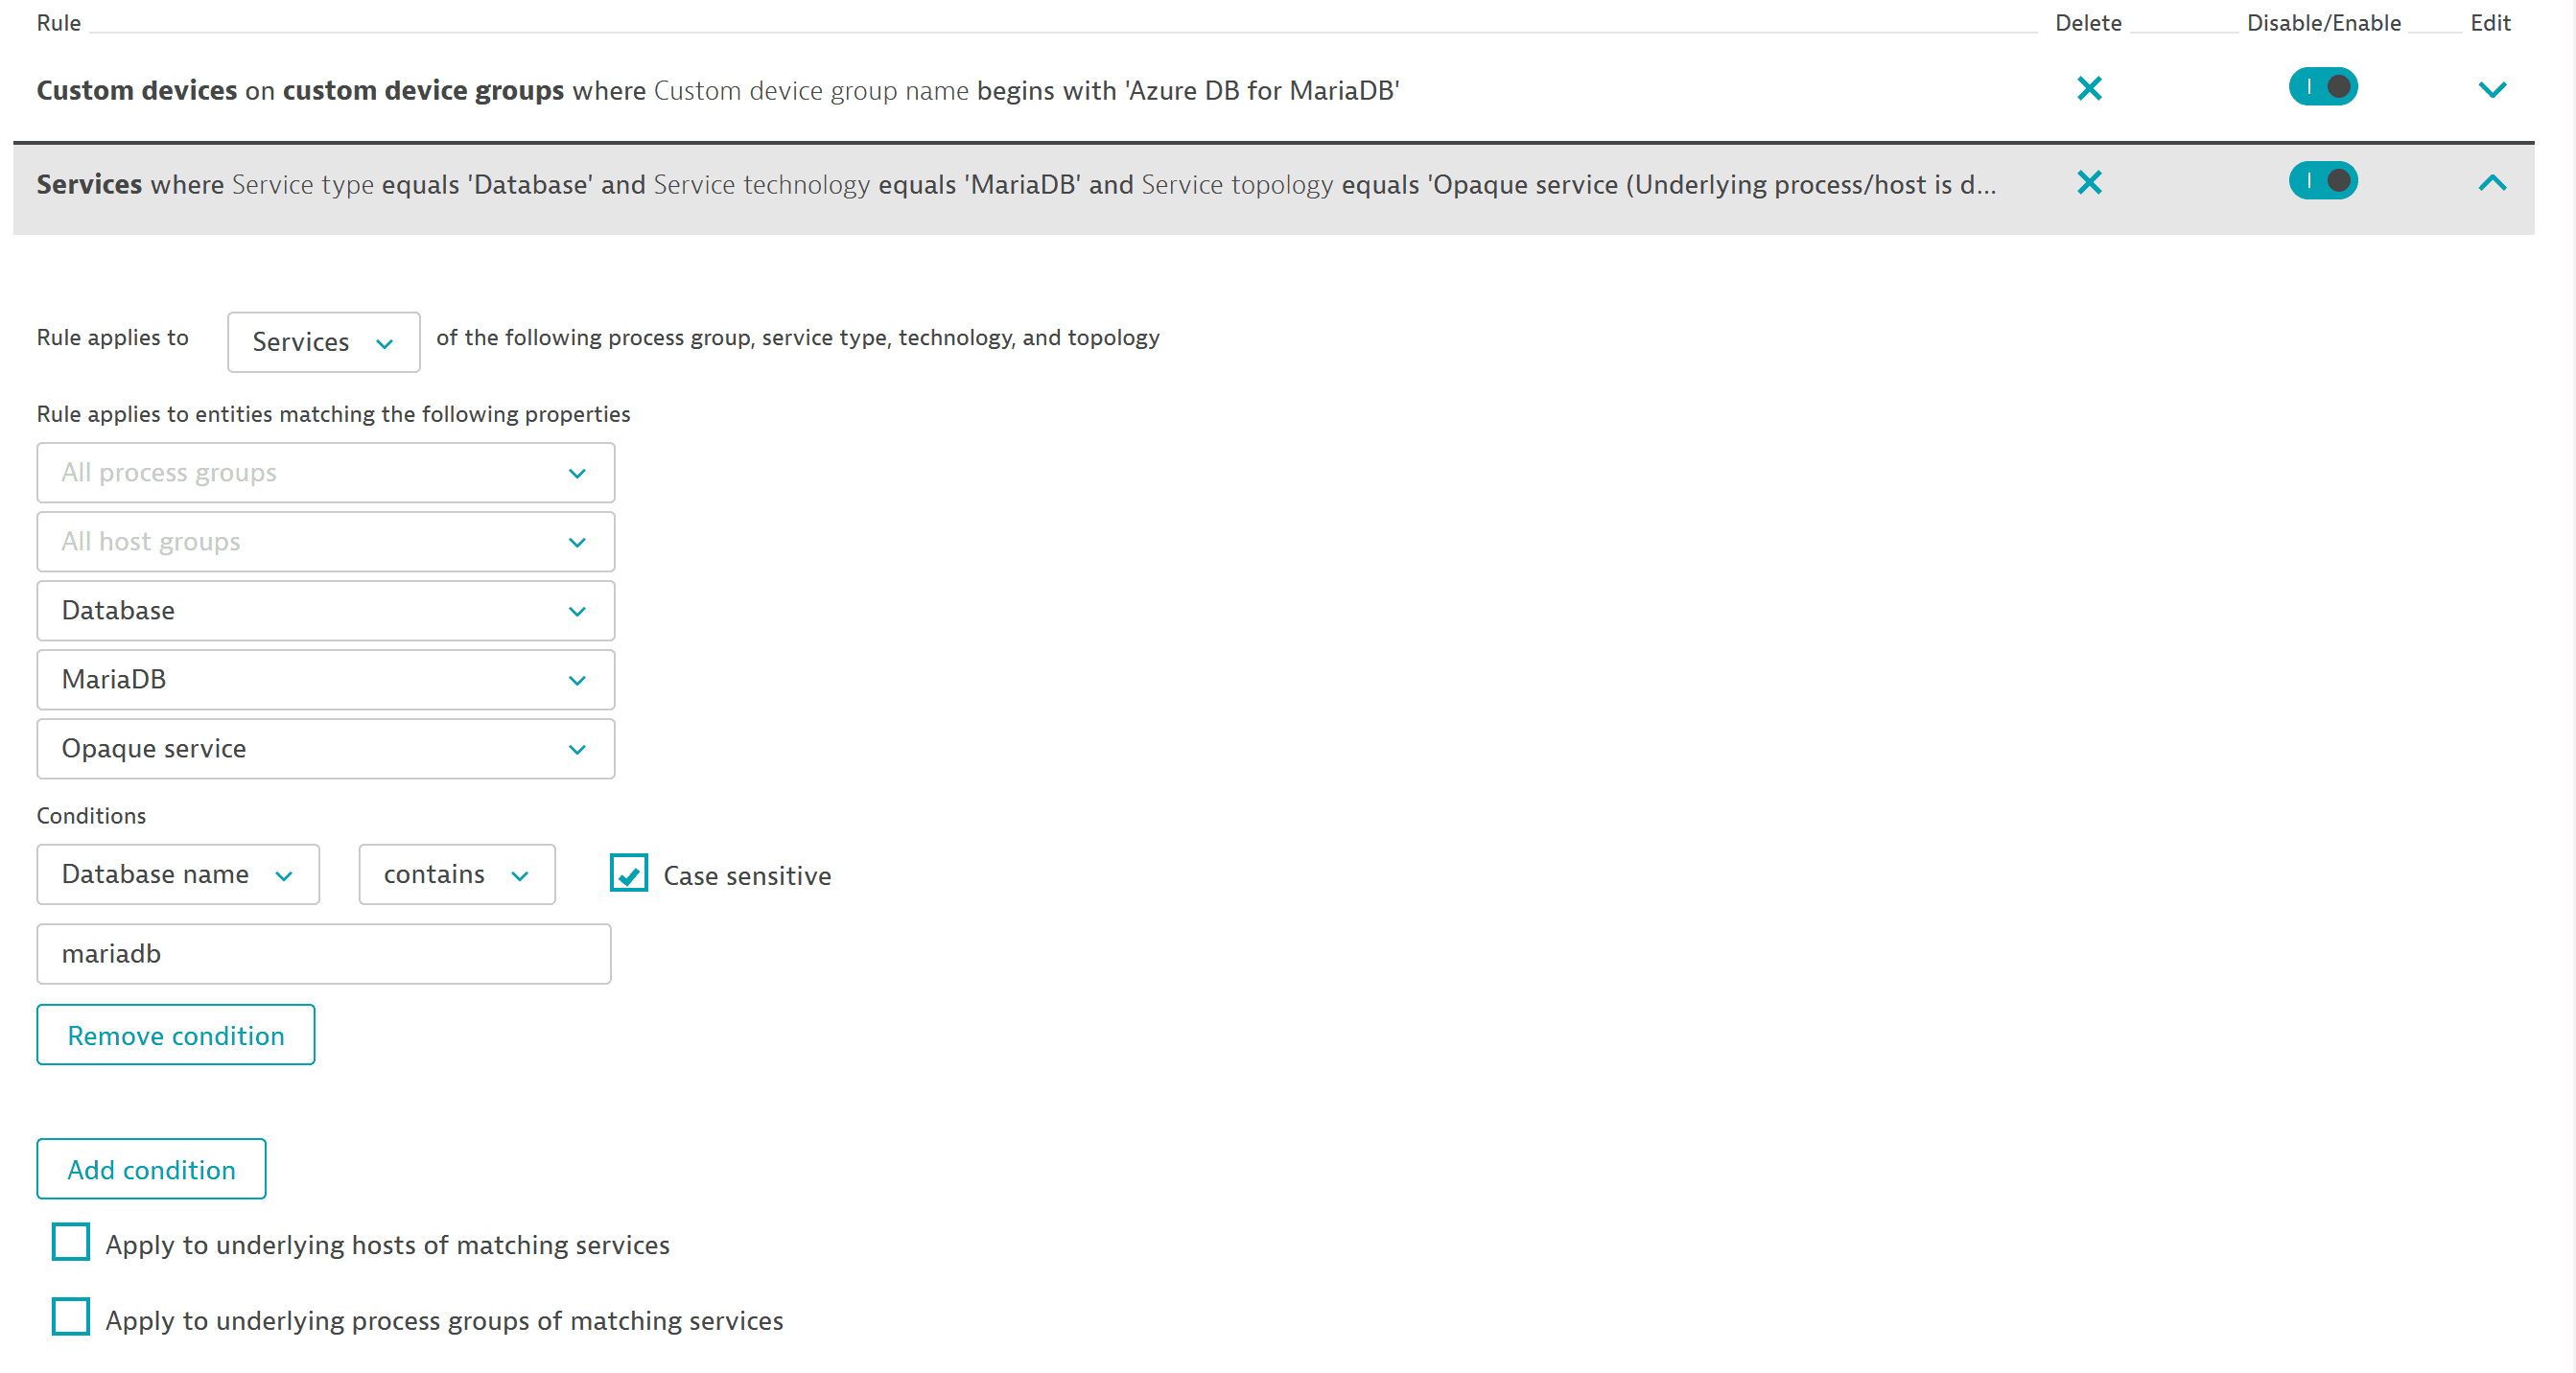
To import a dashboard for Azure Database for MariaDB, you need to set up a management zone to limit the entities displayed on the dashboard to those relevant to this service.
When you create a management zone for this dashboard:
- Create a rule that identifies services based on a common property:
- Service type:
Database - Technology:
MariaDB - Service topology:
Opaque service
- Service type:
- Add a condition for the database name to contain the
mariadbstring (case sensitive.)
Example
After you create the management zone, select it from your dashboard (Edit > Settings > Default management zone). For more information, see Dashboard timeframe and management zone.
Available metrics
| Name | Description | Unit | Recommended |
|---|---|---|---|
| active_connections | Active connections | Count | |
| backup_storage_used | Backup storage used | Bytes | |
| cpu_percent | CPU percent | Percent | |
| connections_failed | Failed connections | Count | |
| io_consumption_percent | IO percent | Percent | |
| memory_percent | Memory percent | Percent | |
| network_bytes_ingress | Network In across active connections | Bytes | |
| network_bytes_egress | Network Out across active connections | Bytes | |
| seconds_behind_master | Replication lag in seconds | Count | |
| serverlog_storage_limit | Server log storage limit | Bytes | |
| serverlog_storage_percent | Server log storage percent | Percent | |
| serverlog_storage_usage | Server log storage used | Bytes | |
| storage_limit | Storage limit | Bytes | |
| storage_percent | Storage percent | Percent | |
| storage_used | Storage used | Bytes |