Azure Data Factory (V1, V2) monitoring
- Latest Dynatrace
- How-to guide
- 3-min read
- Published Jul 27, 2020
Dynatrace ingests metrics from Azure Metrics API for Azure Data Factory (V1, V2). You can view metrics for each service instance, split metrics into multiple dimensions, and create custom charts that you can pin to your dashboards.
Prerequisites
- Dynatrace version 1.199+
- Environment ActiveGate version 1.195+
Enable monitoring
To learn how to enable service monitoring, see Enable service monitoring.
View service metrics
You can view the service metrics in your Dynatrace environment either on the custom device overview page or on your Dashboards page.
View metrics on the custom device overview page
To access the custom device overview page
- Go to
 Technologies & Processes Classic.
 - Filter by service name and select the relevant custom device group.
- Once you select the custom device group, you're on the custom device group overview page.
- The custom device group overview page lists all instances (custom devices) belonging to the group. Select an instance to view the custom device overview page.
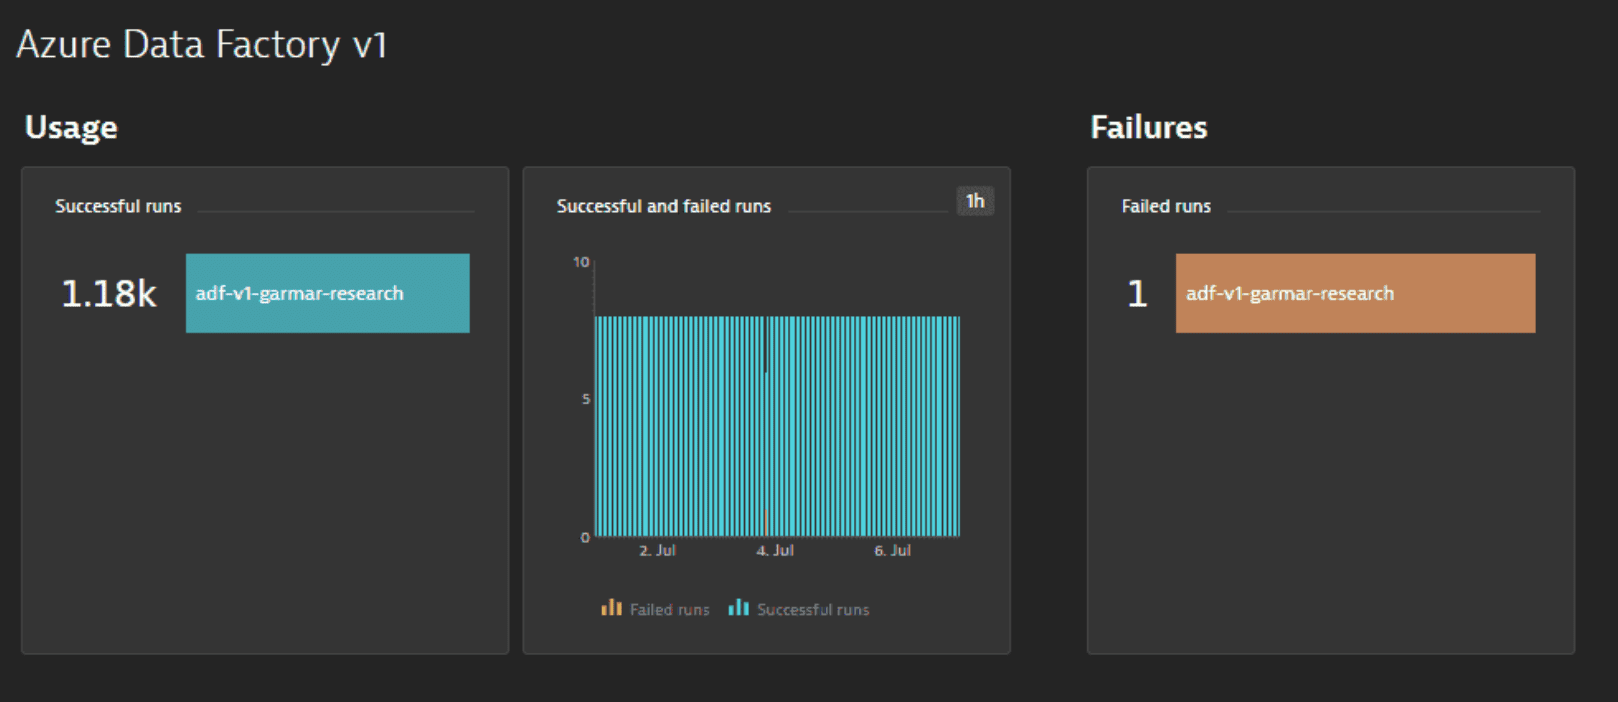
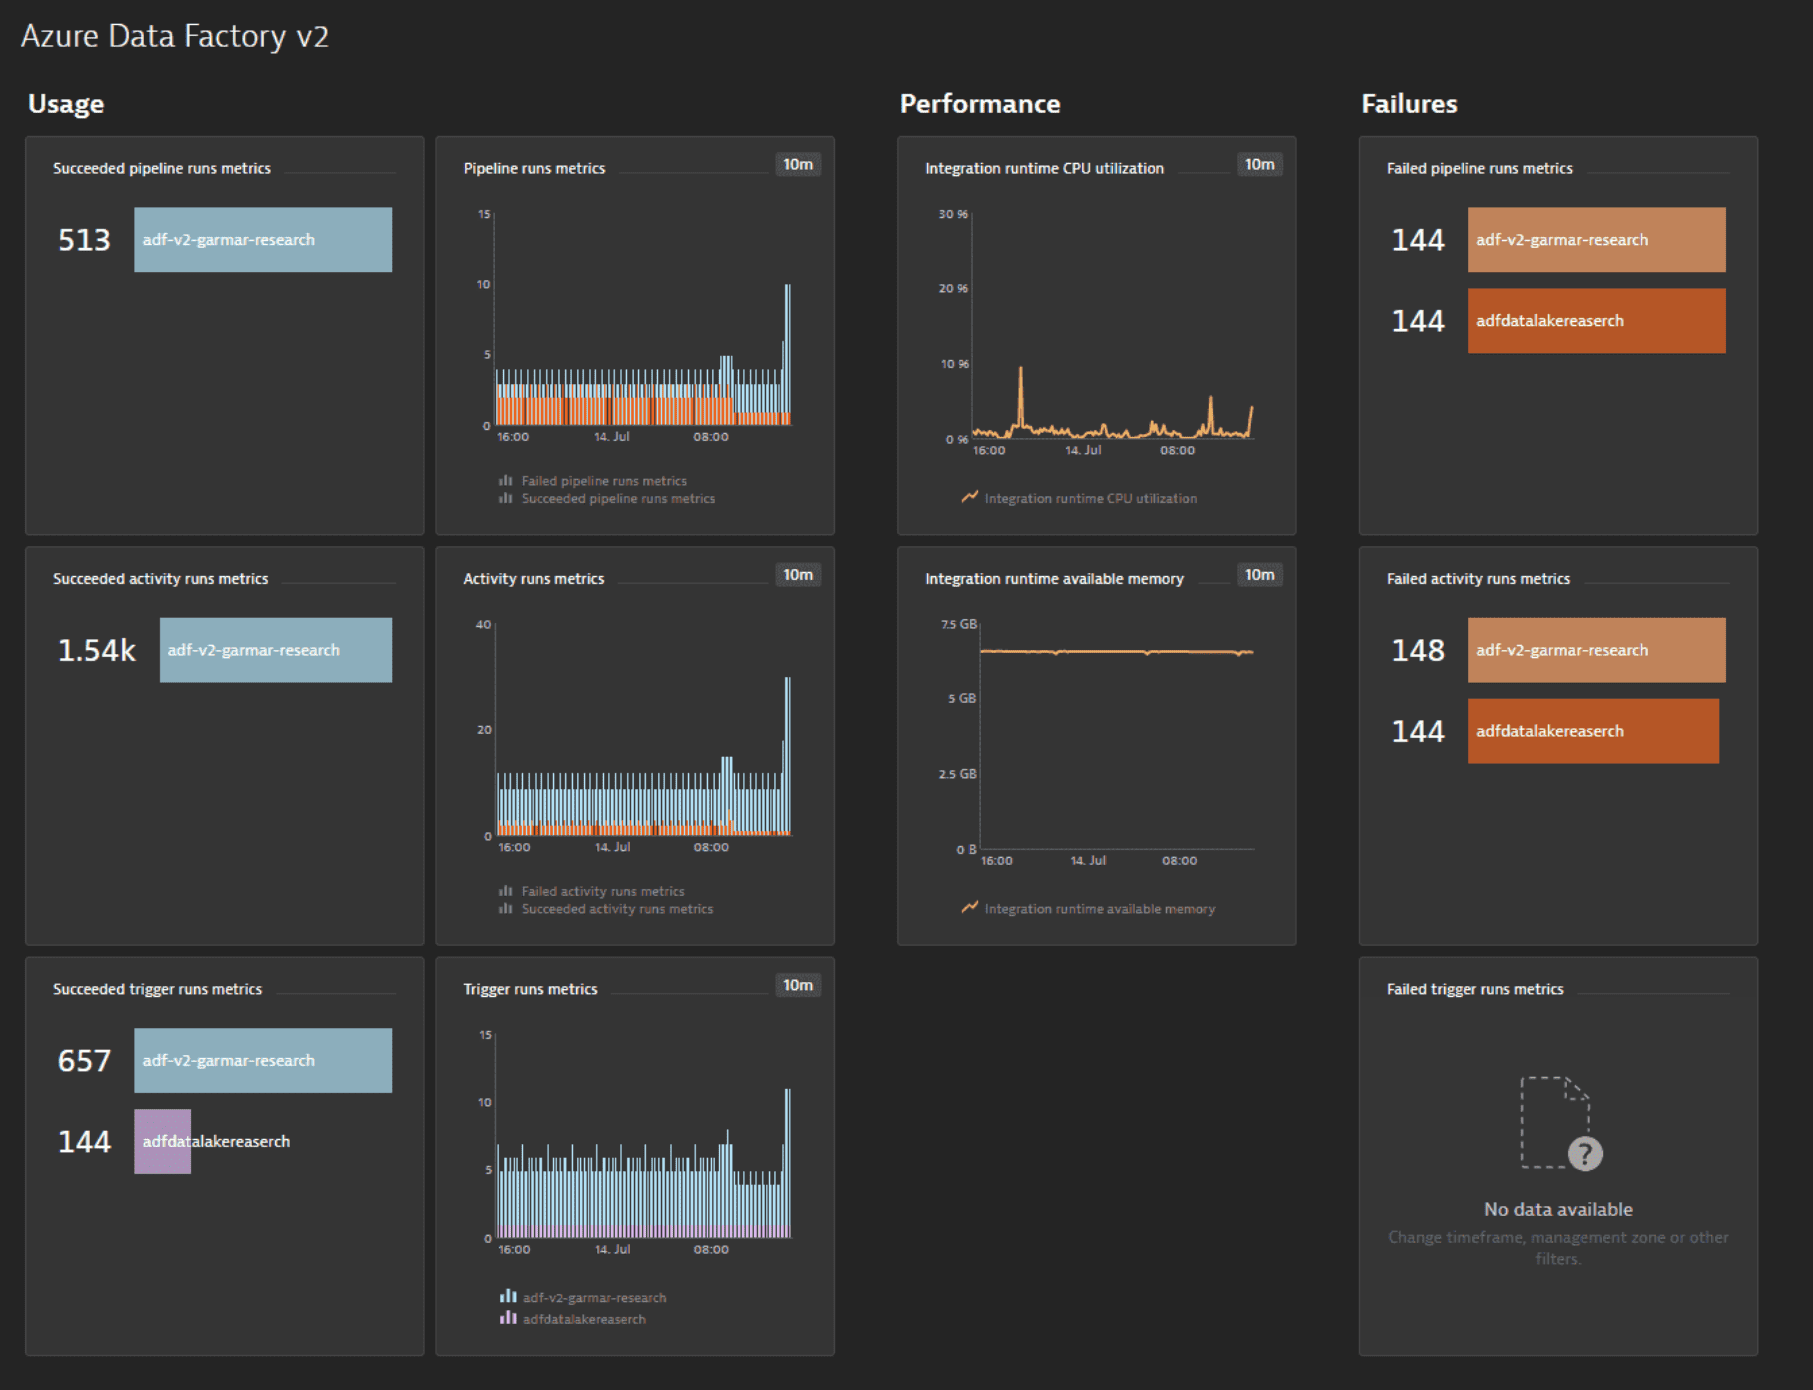
View metrics on your dashboard
If the service has a preset dashboard, you'll get a preset dashboard for the respective service containing all recommended metrics on your Dashboards page. You can look for specific dashboards by filtering by Preset and then by Name.
For existing monitored services, you might need to resave your credentials for the preset dashboard to appear on the Dashboards page. To resave your credentials, go to Settings > Cloud and virtualization > Azure, select the desired Azure instance, then select Save.
You can't make changes on a preset dashboard directly, but you can clone and edit it. To clone a dashboard, open the browse menu (…) and select Clone.
To remove a dashboard from the dashboards list, you can hide it. To hide a dashboard, open the browse menu (…) and select Hide.
Hiding a dashboard doesn't affect other users.

Available metrics
Azure Data Factory V1
| Name | Description | Dimensions | Unit | Recommended |
|---|---|---|---|---|
| FailedRuns | The total number of runs that failed within a minute window | pipelineName, activityName | Count | |
| SuccessfulRuns | The total number of runs that succeeded within a minute window | pipelineName, activityName | Count |
Azure Data Factory V2
| Name | Description | Dimensions | Unit | Recommended |
|---|---|---|---|---|
| ActivityCancelledRuns | The total number of activity runs that were cancelled within a minute window | ActivityType, PipelineName, FailureType, Name | Count | |
| ActivityFailedRuns | The total number of activity runs that failed within a minute window | ActivityType, PipelineName, FailureType, Name | Count | |
| ActivitySucceededRuns | The total number of activity runs that succeeded within a minute window | ActivityType, PipelineName, FailureType, Name | Count | |
| FactorySizeInGbUnits | Total factory size (GB unit) | GigaByte | ||
| IntegrationRuntimeAvailableMemory | Integration runtime available memory | IntegrationRuntimeName, NodeName | Byte | |
| IntegrationRuntimeAvailableNodeNumber | Integration runtime available node count | IntegrationRuntimeName | Count | |
| IntegrationRuntimeAverageTaskPickupDelay | Integration runtime queue duration | IntegrationRuntimeName | Second | |
| IntegrationRuntimeCpuPercentage | Integration runtime CPU utilization | IntegrationRuntimeName, NodeName | Percent | |
| IntegrationRuntimeQueueLength | Integration runtime queue length | IntegrationRuntimeName | Count | |
| MaxAllowedFactorySizeInGbUnits | Maximum allowed factory size (GB unit) | GigaByte | ||
| MaxAllowedResourceCount | Maximum allowed entities count | Count | ||
| PipelineCancelledRuns | Cancelled pipeline runs metrics | FailureType, Name | Count | |
| PipelineFailedRuns | Failed pipeline runs metrics | FailureType, Name | Count | |
| PipelineSucceededRuns | Succeeded pipeline runs metrics | FailureType, Name | Count | |
| ResourceCount | Total entities count | Count | ||
| SSISIntegrationRuntimeStartCancel | The total number of SSIS IR starts that were cancelled within a minute window | IntegrationRuntimeName | Count | |
| SSISIntegrationRuntimeStartFailed | The total number of SSIS IR starts that failed within a minute window | IntegrationRuntimeName | Count | |
| SSISIntegrationRuntimeStartSucceeded | The total number of SSIS IR starts that succeeded within a minute window | IntegrationRuntimeName | Count | |
| SSISIntegrationRuntimeStopStuck | The total number of SSIS IR stops that were stuck within a minute window | IntegrationRuntimeName | Count | |
| SSISIntegrationRuntimeStopSucceeded | The total number of SSIS IR stops that succeeded within a minute window | IntegrationRuntimeName | Count | |
| SSISPackageExecutionCancel | The total number of SSIS package executions that were cancelled within a minute window | IntegrationRuntimeName | Count | |
| SSISPackageExecutionFailed | The total number of SSIS package executions that failed within a minute window | IntegrationRuntimeName | Count | |
| SSISPackageExecutionSucceeded | The total number of SSIS package executions that succeeded within a minute window | IntegrationRuntimeName | Count | |
| TriggerCancelledRuns | The total number of trigger runs that were cancelled within a minute window | Name, FailureType | Count | |
| TriggerFailedRuns | The total number of trigger runs that failed within a minute window | Name, FailureType | Count | |
| TriggerSucceededRuns | The total number of trigger runs that succeeded within a minute window | Name, FailureType | Count |