Azure Batch monitoring
- Latest Dynatrace
- How-to guide
- 3-min read
- Published Jun 25, 2020
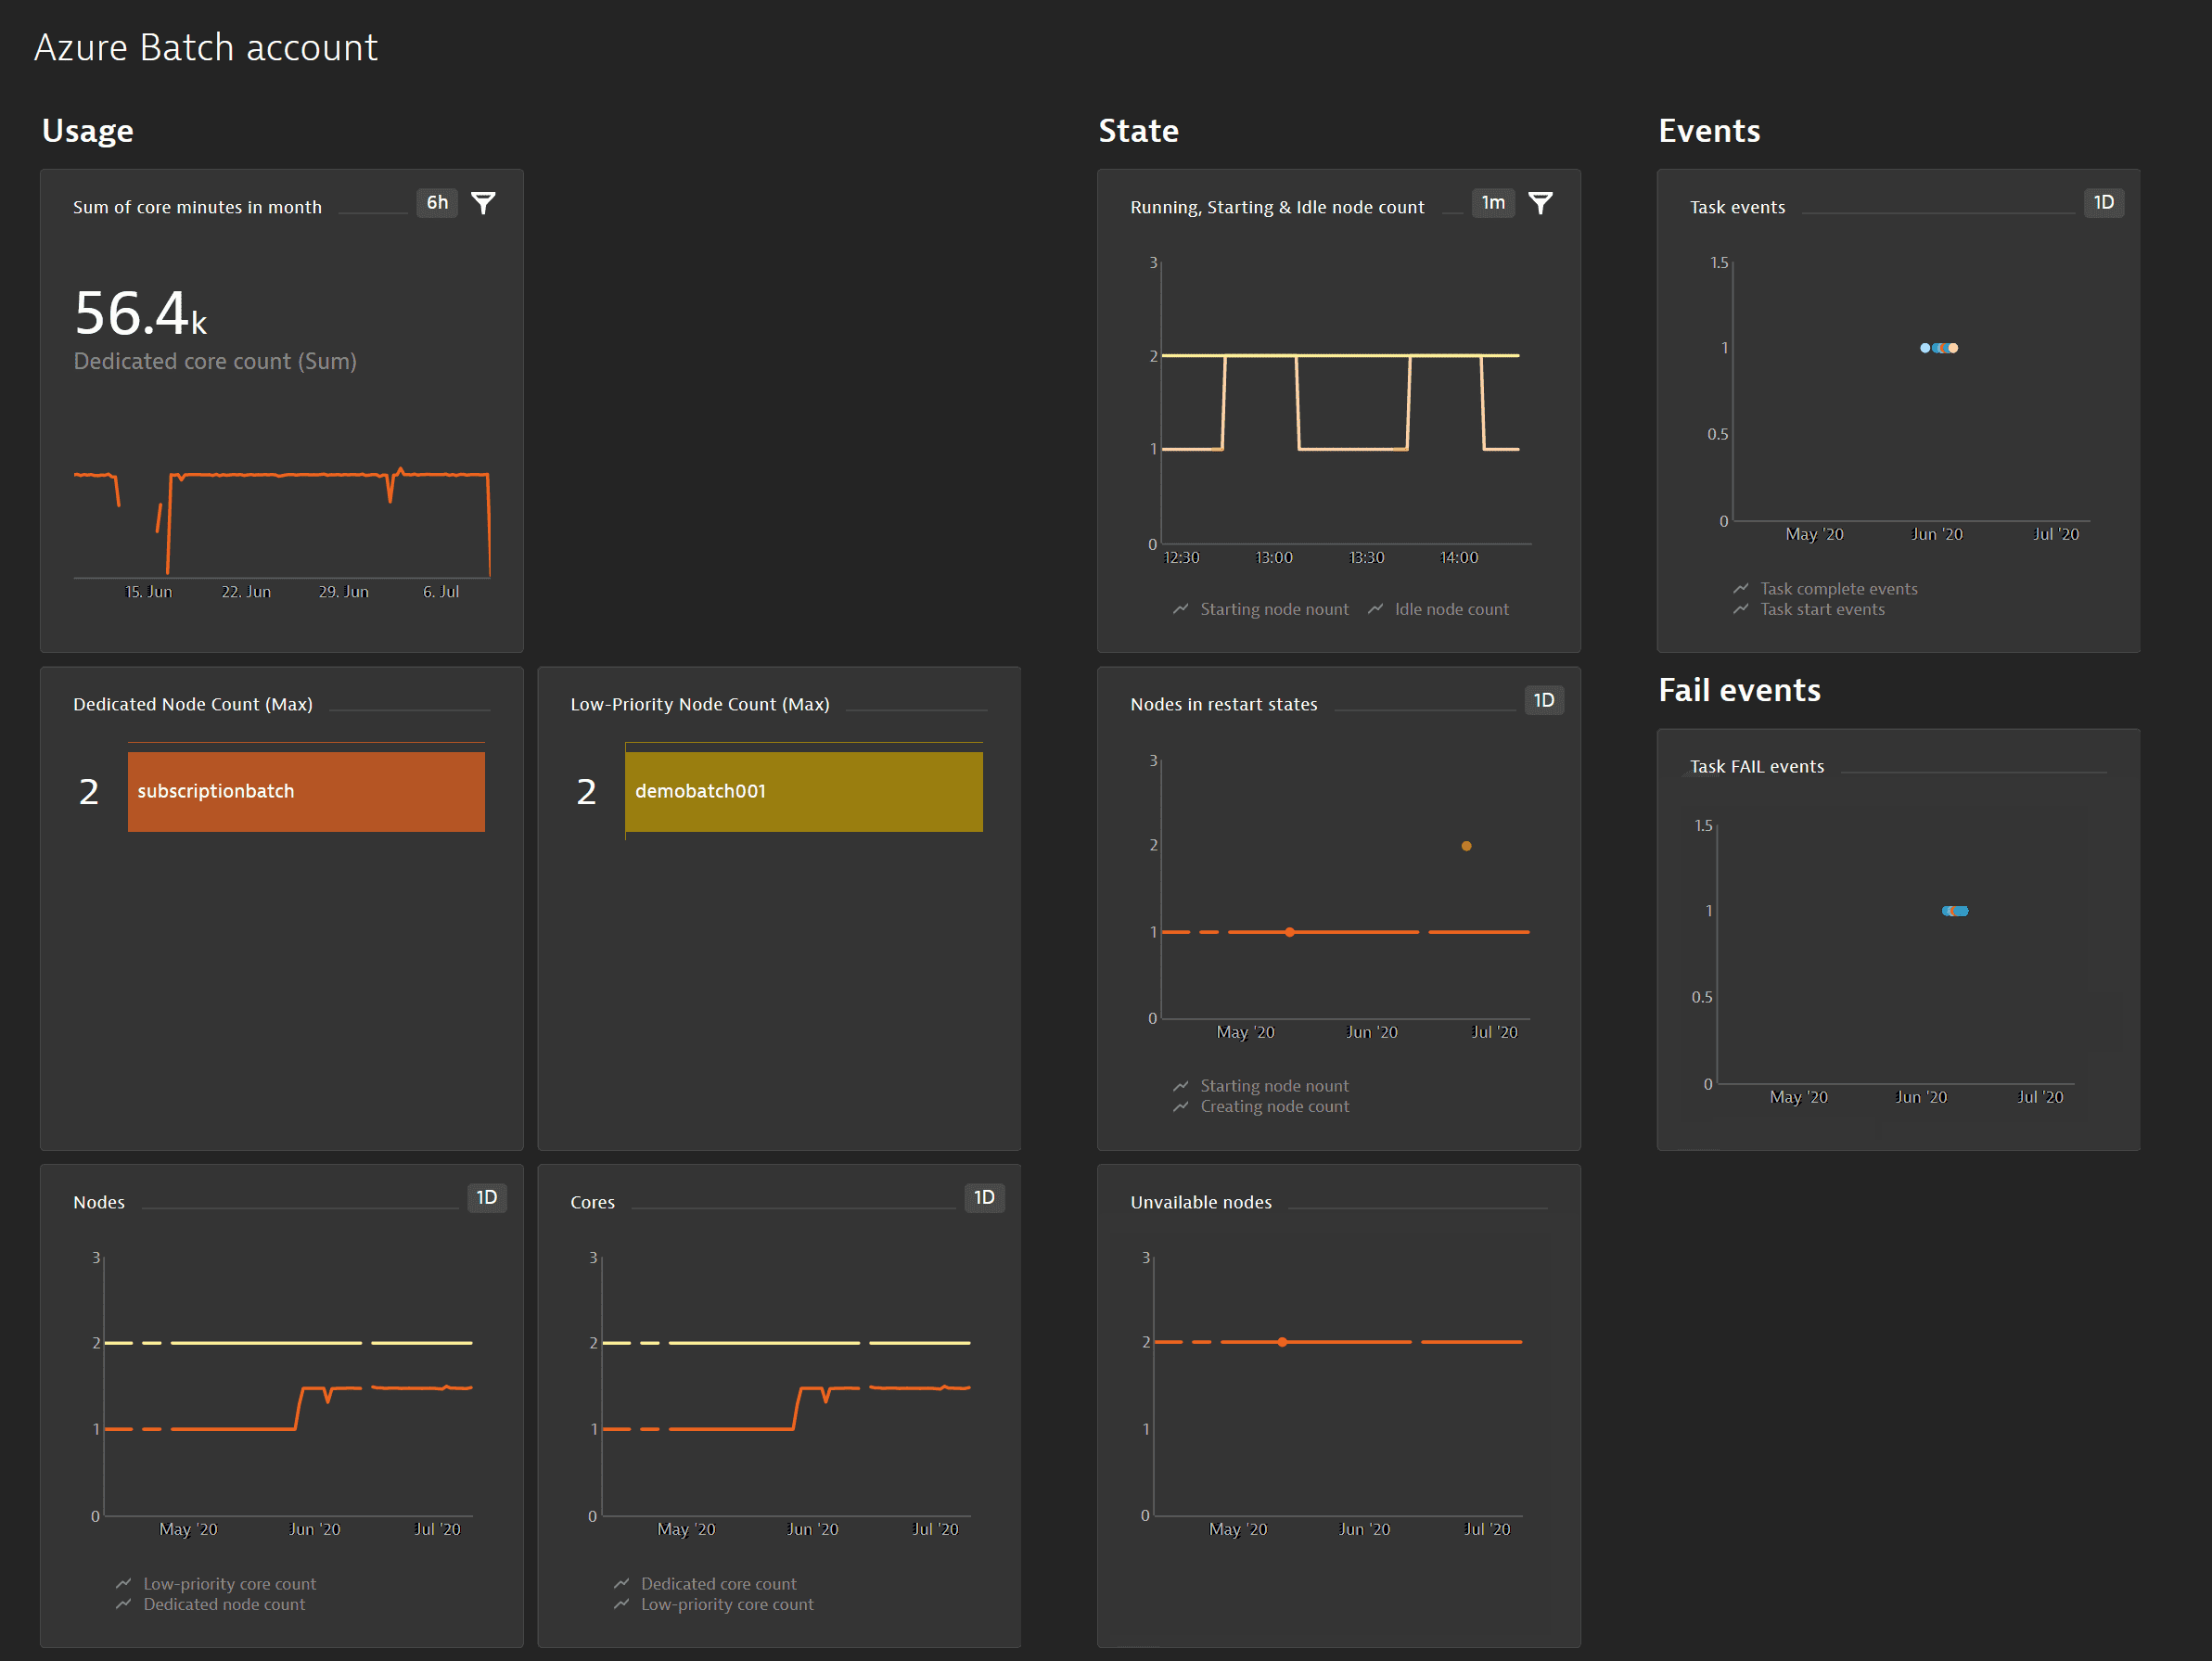
The Azure Batch overview page gives you a comprehensive view of how many jobs and tasks were completed over a period of time. You can also track nodes in different states, such as running, idle, or offline.
Prerequisites
- Dynatrace version 1.196+
- Environment ActiveGate version 1.195+
Enable monitoring
To learn how to enable service monitoring, see Enable service monitoring.
View service metrics
You can view the service metrics in your Dynatrace environment either on the custom device overview page or on your Dashboards page.
View metrics on the custom device overview page
To access the custom device overview page
- Go to
 Technologies & Processes Classic.
 - Filter by service name and select the relevant custom device group.
- Once you select the custom device group, you're on the custom device group overview page.
- The custom device group overview page lists all instances (custom devices) belonging to the group. Select an instance to view the custom device overview page.
View metrics on your dashboard
If the service has a preset dashboard, you'll get a preset dashboard for the respective service containing all recommended metrics on your Dashboards page. You can look for specific dashboards by filtering by Preset and then by Name.
For existing monitored services, you might need to resave your credentials for the preset dashboard to appear on the Dashboards page. To resave your credentials, go to Settings > Cloud and virtualization > Azure, select the desired Azure instance, then select Save.
You can't make changes on a preset dashboard directly, but you can clone and edit it. To clone a dashboard, open the browse menu (…) and select Clone.
To remove a dashboard from the dashboards list, you can hide it. To hide a dashboard, open the browse menu (…) and select Hide.
Hiding a dashboard doesn't affect other users.

Available metrics
| Name | Description | Dimensions | Unit | Recommended |
|---|---|---|---|---|
| CoreCount | Total number of dedicated cores in the batch account | None | Count | |
| CreatingNodeCount | Number of nodes being created | None | Count | |
| IdleNodeCount | Number of idle nodes | None | Count | |
| JobDeleteCompleteEvent | Total number of jobs that have been successfully deleted | jobId | Count | |
| JobDeleteStartEvent | Total number of jobs that have been requested to be deleted | jobId | Count | |
| JobDisableCompleteEvent | Total number of jobs that have been successfully disabled | jobId | Count | |
| JobDisableStartEvent | Total number of jobs that have been requested to be disabled | jobId | Count | |
| JobStartEvent | Total number of jobs that have been successfully started | jobId | Count | |
| JobTerminateCompleteEvent | Total number of jobs that have been successfully terminated | jobId | Count | |
| JobTerminateStartEvent | Total number of jobs that have been requested to be terminated | jobId | Count | |
| LeavingPoolNodeCount | Number of nodes leaving the pool | None | Count | |
| LowPriorityCoreCount | Total number of low-priority cores in the batch account | None | Count | |
| LowPriorityNodeCount | Total number of low-priority nodes in the batch account | None | Count | |
| OfflineNodeCount | Number of offline nodes | None | Count | |
| PoolCreateEvent | Total number of pools that have been created | poolId | Count | |
| PoolDeleteCompleteEvent | Total number of pool deletes that have completed | poolId | Count | |
| PoolDeleteStartEvent | Total number of pool deletes that have started | poolId | Count | |
| PoolResizeCompleteEvent | Total number of pool resizes that have completed | poolId | Count | |
| PoolResizeStartEvent | Total number of pool resizes that have started | poolId | Count | |
| PreemptedNodeCount | Number of preempted nodes | None | Count | |
| RebootingNodeCount | Number of rebooting nodes | None | Count | |
| ReimagingNodeCount | Number of reimaging nodes | None | Count | |
| RunningNodeCount | Number of running nodes | None | Count | |
| StartTaskFailedNodeCount | Number of nodes where the Start Task has failed | None | Count | |
| StartingNodeCount | Number of nodes starting | None | Count | |
| TaskCompleteEvent | Total number of tasks that have completed | poolId,jobId | Count | |
| TaskFailEvent | Total number of tasks that have completed in a failed state | poolId,jobId | Count | |
| TaskStartEvent | Total number of tasks that have started | poolId,jobId | Count | |
| TotalNodeCount | Total number of dedicated nodes in the batch account | None | Count | |
| UnusableNodeCount | Number of unusable nodes | None | Count | |
| WaitingForStartTaskNodeCount | Number of nodes waiting for the Start Task to complete | None | Count |