Azure Application Insights monitoring
- Latest Dynatrace
- How-to guide
- 4-min read
- Published Sep 22, 2020
Dynatrace ingests metrics from Azure Metrics API for Azure Application Insights. You can view metrics for each service instance, split metrics into multiple dimensions, and create custom charts that you can pin to your dashboards.
Prerequisites
- Dynatrace version 1.203+
- Environment ActiveGate version 1.198+
Enable monitoring
To learn how to enable service monitoring, see Enable service monitoring.
View service metrics
You can view the service metrics in your Dynatrace environment either on the custom device overview page or on your Dashboards page.
View metrics on the custom device overview page
To access the custom device overview page
- Go to
 Technologies & Processes Classic.
 - Filter by service name and select the relevant custom device group.
- Once you select the custom device group, you're on the custom device group overview page.
- The custom device group overview page lists all instances (custom devices) belonging to the group. Select an instance to view the custom device overview page.
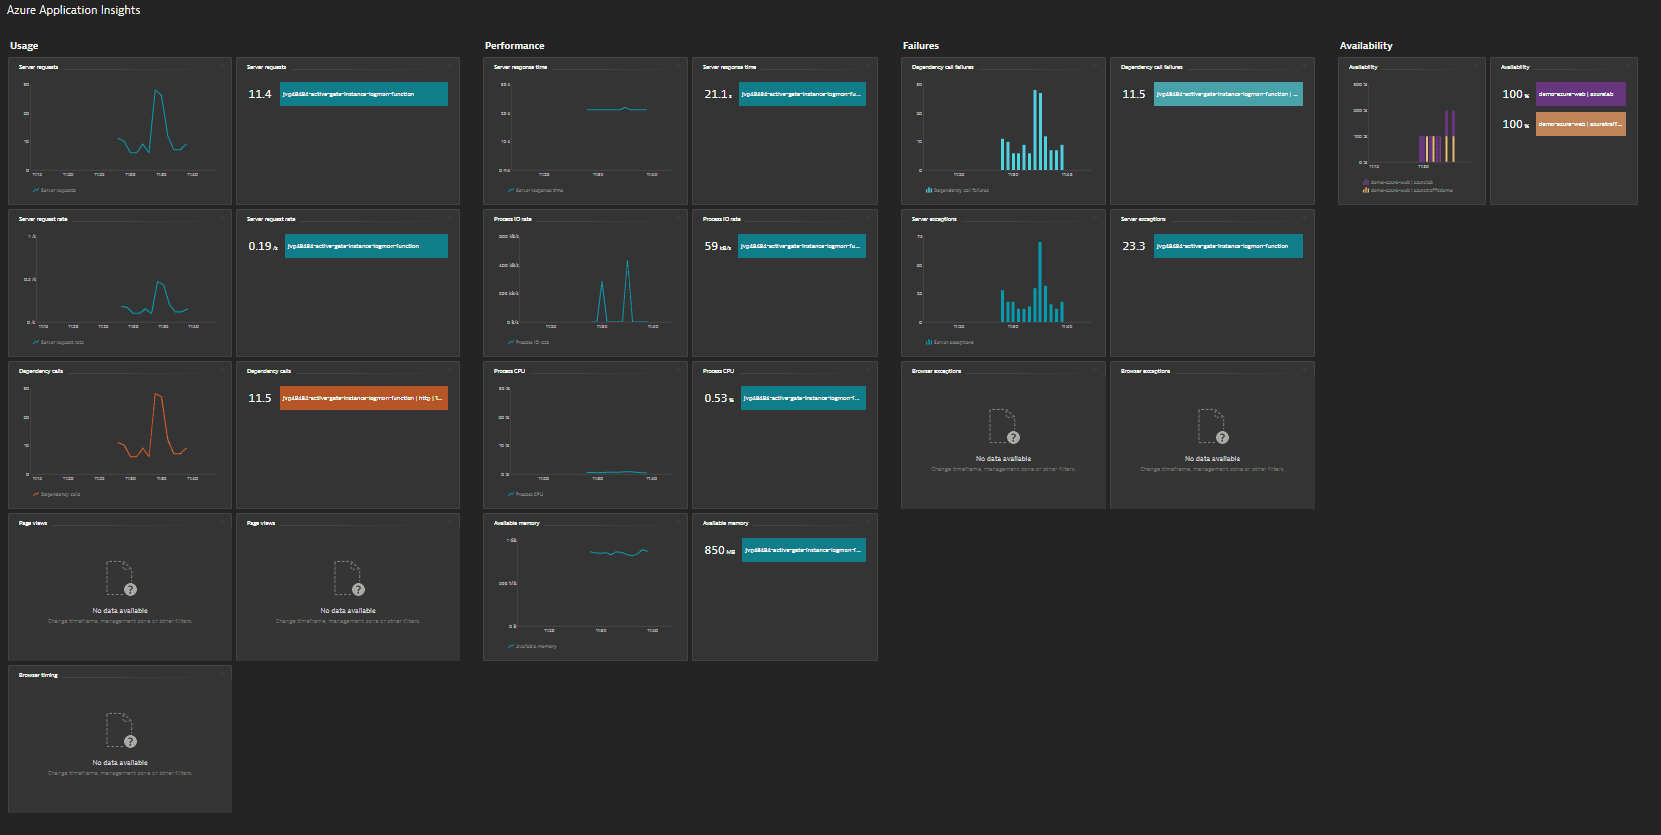
View metrics on your dashboard
If the service has a preset dashboard, you'll get a preset dashboard for the respective service containing all recommended metrics on your Dashboards page. You can look for specific dashboards by filtering by Preset and then by Name.
For existing monitored services, you might need to resave your credentials for the preset dashboard to appear on the Dashboards page. To resave your credentials, go to Settings > Cloud and virtualization > Azure, select the desired Azure instance, then select Save.
You can't make changes on a preset dashboard directly, but you can clone and edit it. To clone a dashboard, open the browse menu (…) and select Clone.
To remove a dashboard from the dashboards list, you can hide it. To hide a dashboard, open the browse menu (…) and select Hide.
Hiding a dashboard doesn't affect other users.

Available metrics
| Name | Description | Dimensions | Unit | Recommended |
|---|---|---|---|---|
| requests/duration | The time between receiving an HTTP request and finishing sending the response | Request performance, Result code, Is traffic synthetic, Cloud role instance, Successful request, Cloud role name | MilliSecond | |
| requests/count | The count of completed HTTP requests | Request performance, Result code, Is traffic synthetic, Cloud role instance, Successful request, Cloud role name | Count | |
| requests/failed | The count of failed HTTP requests | Request performance, Result code, Is traffic synthetic, Cloud role instance, Cloud role name | Count | |
| availabilityResults/availabilityPercentage | The percentage of successfully completed availability tests | Test name, Run location, | Percent | |
| availabilityResults/count | The count of availability tests | Test name, Run location, Test result | Count | |
| availabilityResults/duration | Availability test duration | Test name, Run location, Test result | MilliSecond | |
| browserTimings/networkDuration | The time between user request and network connection | MilliSecond | ||
| browserTimings/processingDuration | The time between receiving the last byte of a document until the DOM is loaded | MilliSecond | ||
| browserTimings/receiveDuration | The receiving response time | MilliSecond | ||
| browserTimings/sendDuration | The send request time | MilliSecond | ||
| browserTimings/totalDuration | The browser page load time | MilliSecond | ||
| dependencies/count | The number of dependency calls | Dependency type, Dependency performance, Successful call, Target of a dependency call, Result code, Is traffic synthetic, Cloud role instance, Cloud role name | Count | |
| dependencies/duration | The dependency duration | Dependency type, Dependency performance, Successful call, Target of a dependency call, Result code, Is traffic synthetic, Cloud role instance, Cloud role name | MilliSecond | |
| dependencies/failed | The number of dependency call failures | Dependency type, Dependency performance, Target of a dependency call, Result code, Is traffic synthetic, Cloud role instance, Cloud role name | Count | |
| pageViews/count | The number of page views | Is traffic synthetic, Cloud role name, | Count | |
| pageViews/duration | The page view load time | Is traffic synthetic, Cloud role name | MilliSecond | |
| performanceCounters/requestExecutionTime | The HTTP request execution time | Cloud role instance | MilliSecond | |
| performanceCounters/requestsInQueue | The HTTP requests in application queue | Cloud role instance | Count | |
| performanceCounters/requestsPerSecond | The HTTP request rate | Cloud role instance | PerSecond | |
| performanceCounters/exceptionsPerSecond | The exception rate | Cloud role instance | PerSecond | |
| performanceCounters/processIOBytesPerSecond | The process IO rate | Cloud role instance | BytePerSecond | |
| performanceCounters/processCpuPercentage | The processor time | Cloud role instance | Percent | |
| performanceCounters/processorCpuPercentage | Cloud role instance | Percent | ||
| performanceCounters/memoryAvailableBytes | The available memory | Cloud role instance | Byte | |
| performanceCounters/processPrivateBytes | The process private bytes | Cloud role instance | Byte | |
| requests/rate | The server request rate | Request performance, Result code, Is traffic synthetic, Cloud role instance, Successful request, Cloud role name | PerSecond | |
| exceptions/count | The number of exceptions | Cloud role name, Cloud role instance, Device type | Count | |
| exceptions/browser | The browser exceptions | Cloud role name | Count | |
| exceptions/server | The server exceptions | Cloud role name, Cloud role instance | Count | |
| traces/count | The number of traces | Severity level, Is traffic synthetic, Cloud role name, Cloud role instance | Count |
Limitations
Running the Azure App Service extension at the same time with Azure Application Insights is not supported.