WMI tutorial - dashboards and alerts
With Extensions 2.0, you can package the expertise required to monitor a new technology in the form of dashboards and custom alerts. These are made available within the Dynatrace tenant as soon as the extension is deployed.
Dashboards and alerts need to be packaged as JSON files (the content is the same as an API export) as part of your extension.zip archive and are referenced in YAML within the dashboards and alerts sections. Items in these lists map to paths relative to the extension archive.
Example:
dashboards:- path: dashboards/dashboard.jsonalerts:- path: alerts/alert.json
Tasks
- Download the assets folder provided with this exercise.
- Save it next to the
extension.yaml. - Add the
dashboardsandalertssections toextension.yaml. - Package and upload a new version of your extension.
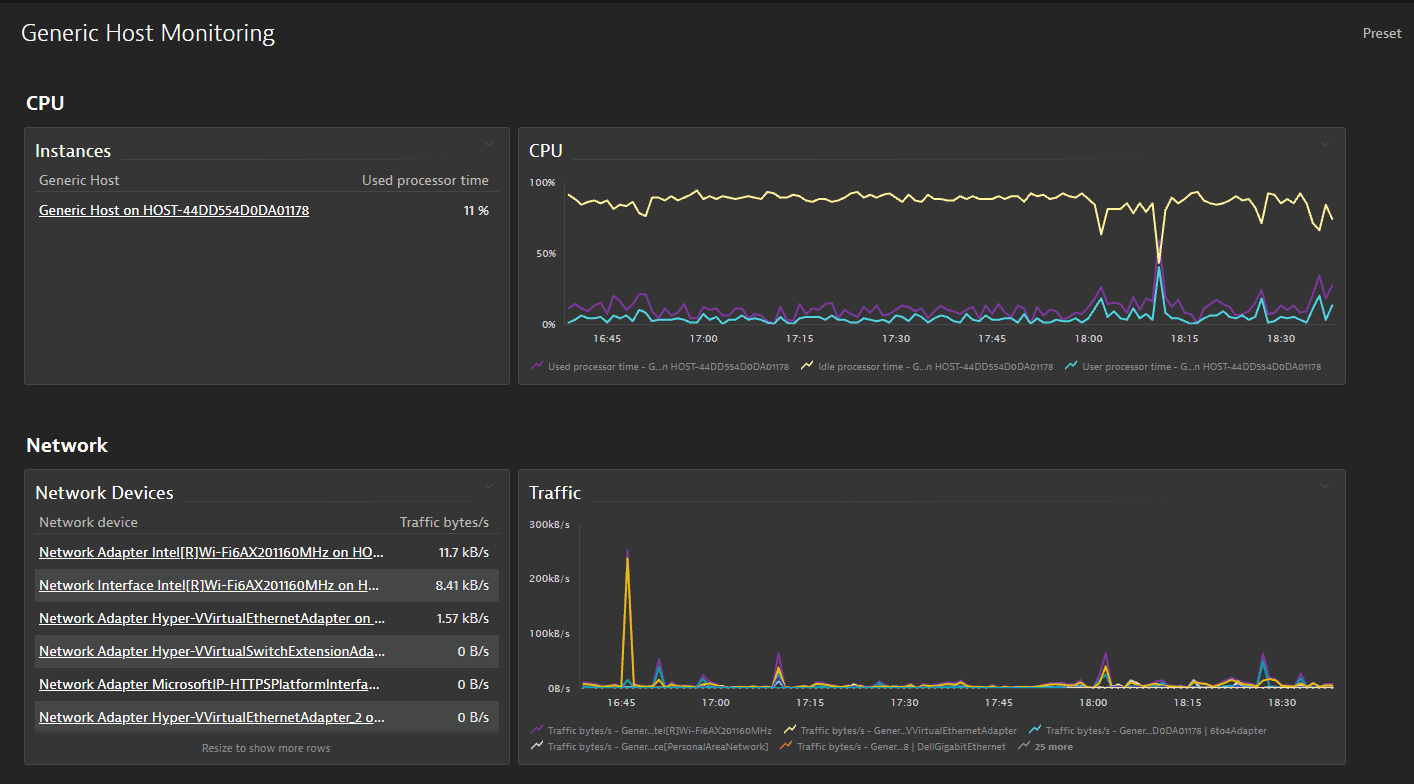
- Validate the Dashboard and Alert have appeared in your tenant.
Results
You have completed this exercise when you can verify a dashboard called Generic Host Monitoring and an alert called CPU Saturation have appeared in your environment.
