Trace transactions end-to-end
- Latest Dynatrace
- 2-min read
Traditional mainframe monitoring tools can provide deep insights into programs and transactions executed on the mainframe but struggle to identify their calling services from open systems. On the other hand, open systems developers have no visibility into the mainframe, which makes troubleshooting challenging for all involved parties.
Dynatrace can solve this problem by automatically discovering the calling services and mapping them to the mainframe on the transaction level. The result is an end-to-end trace from the mobile application or cloud-native function down to the mainframe transaction, and everything in between.
Who is calling the mainframe?
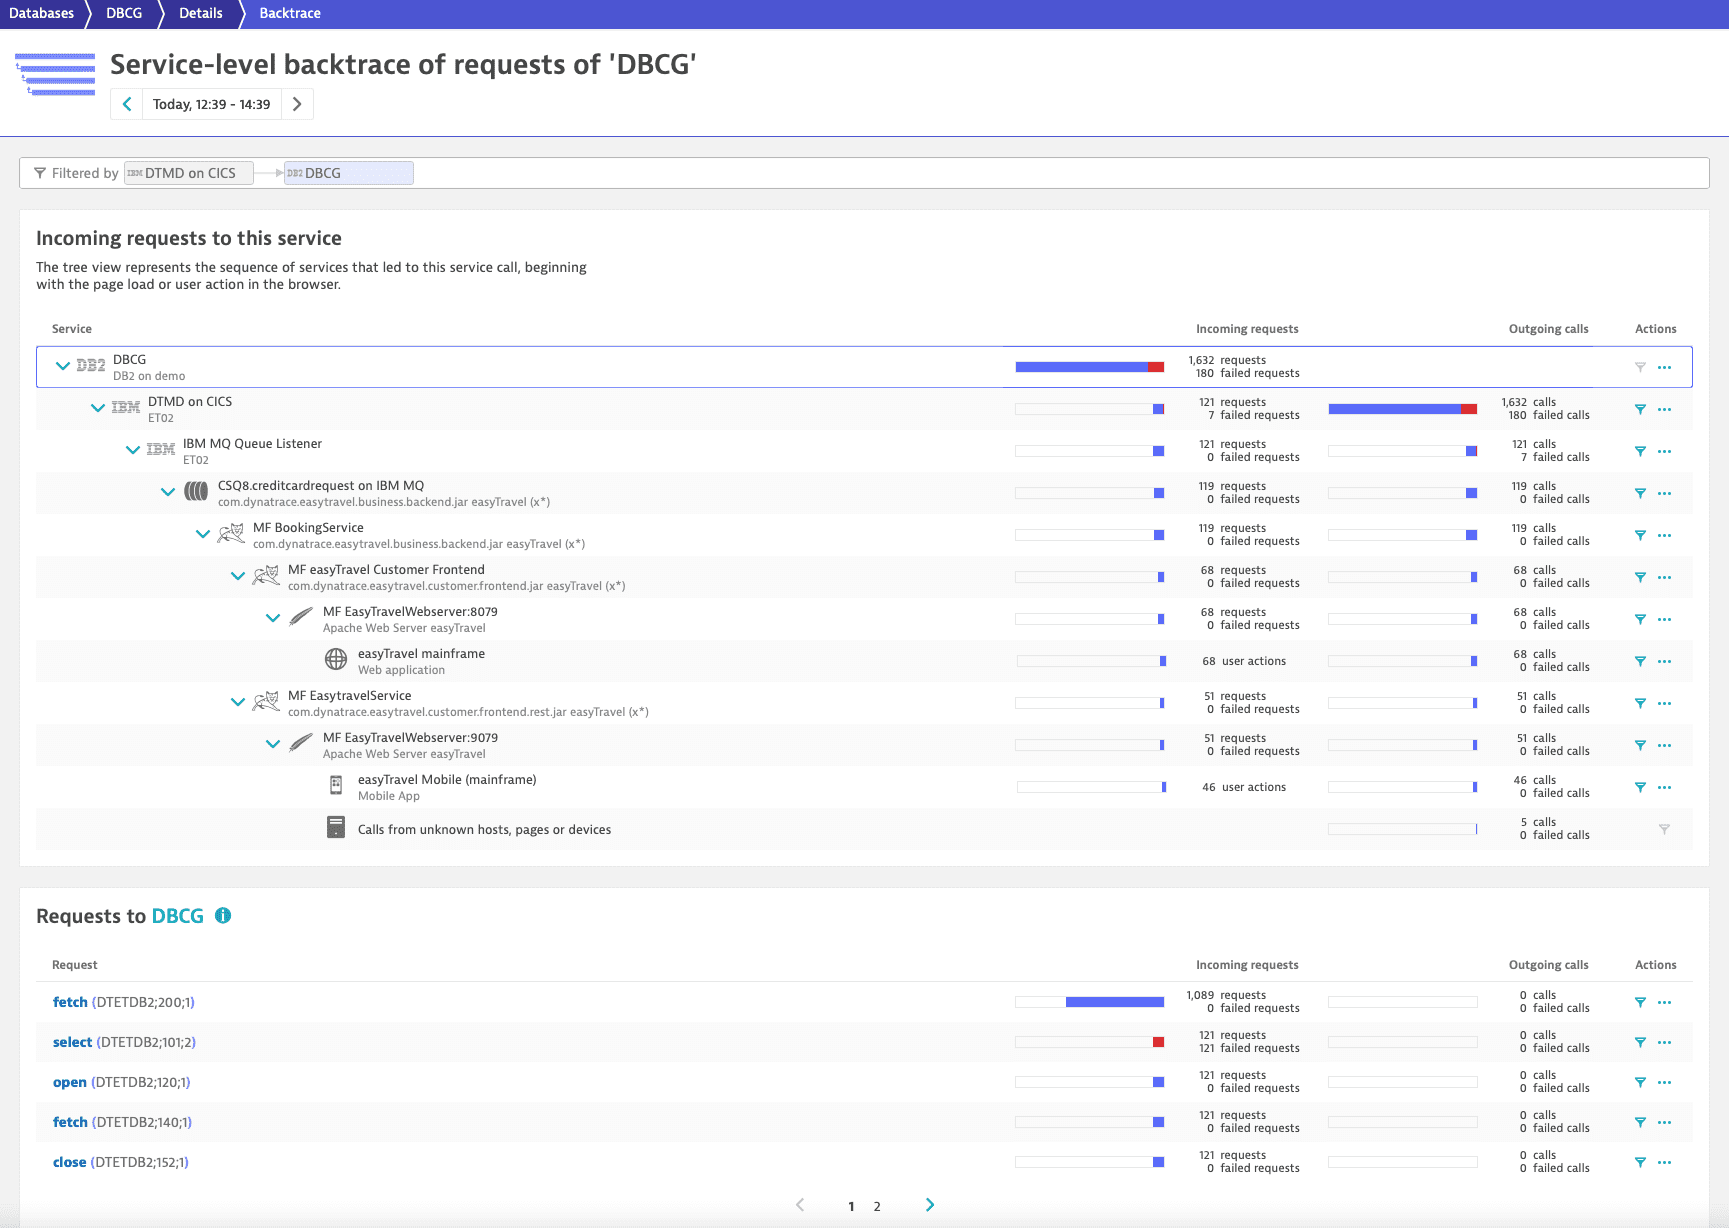
The Service backtrace allows you to backtrace any monitored transaction. The example below shows how a CICS transaction (DTMD) interacts with both a mobile application and a web application via IBM MQ asynchronously.
- You can see how often the CICS transaction is called by these applications.
- You can see which requests failed. In this example, many Db2 select statements failed.
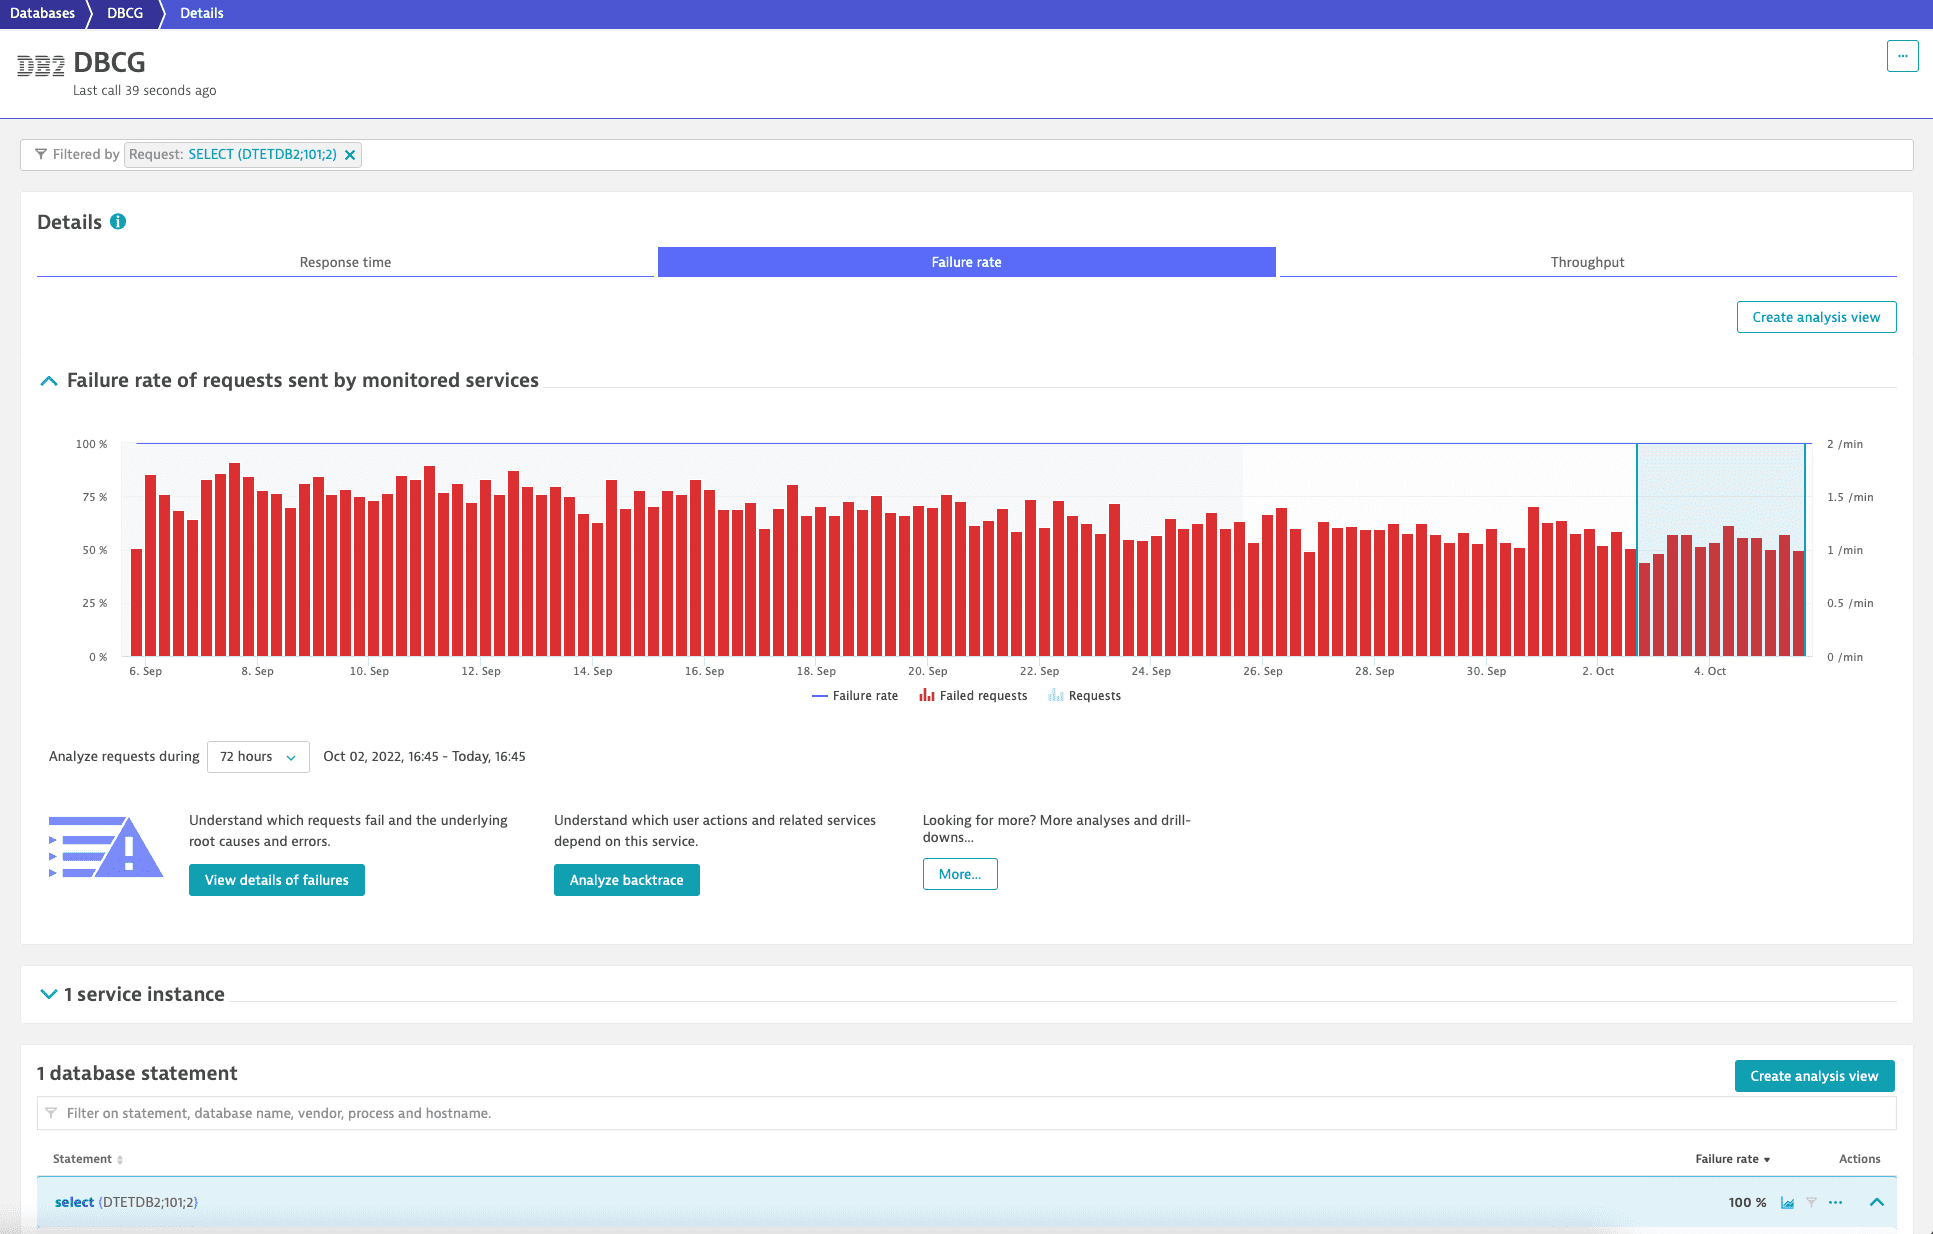
With Dynatrace you can dive into every single transaction and database statement. In this example, we want to understand why the select statements failed. To do so, select More > Distributed traces to open the Context-specific drill-down for distributed traces.
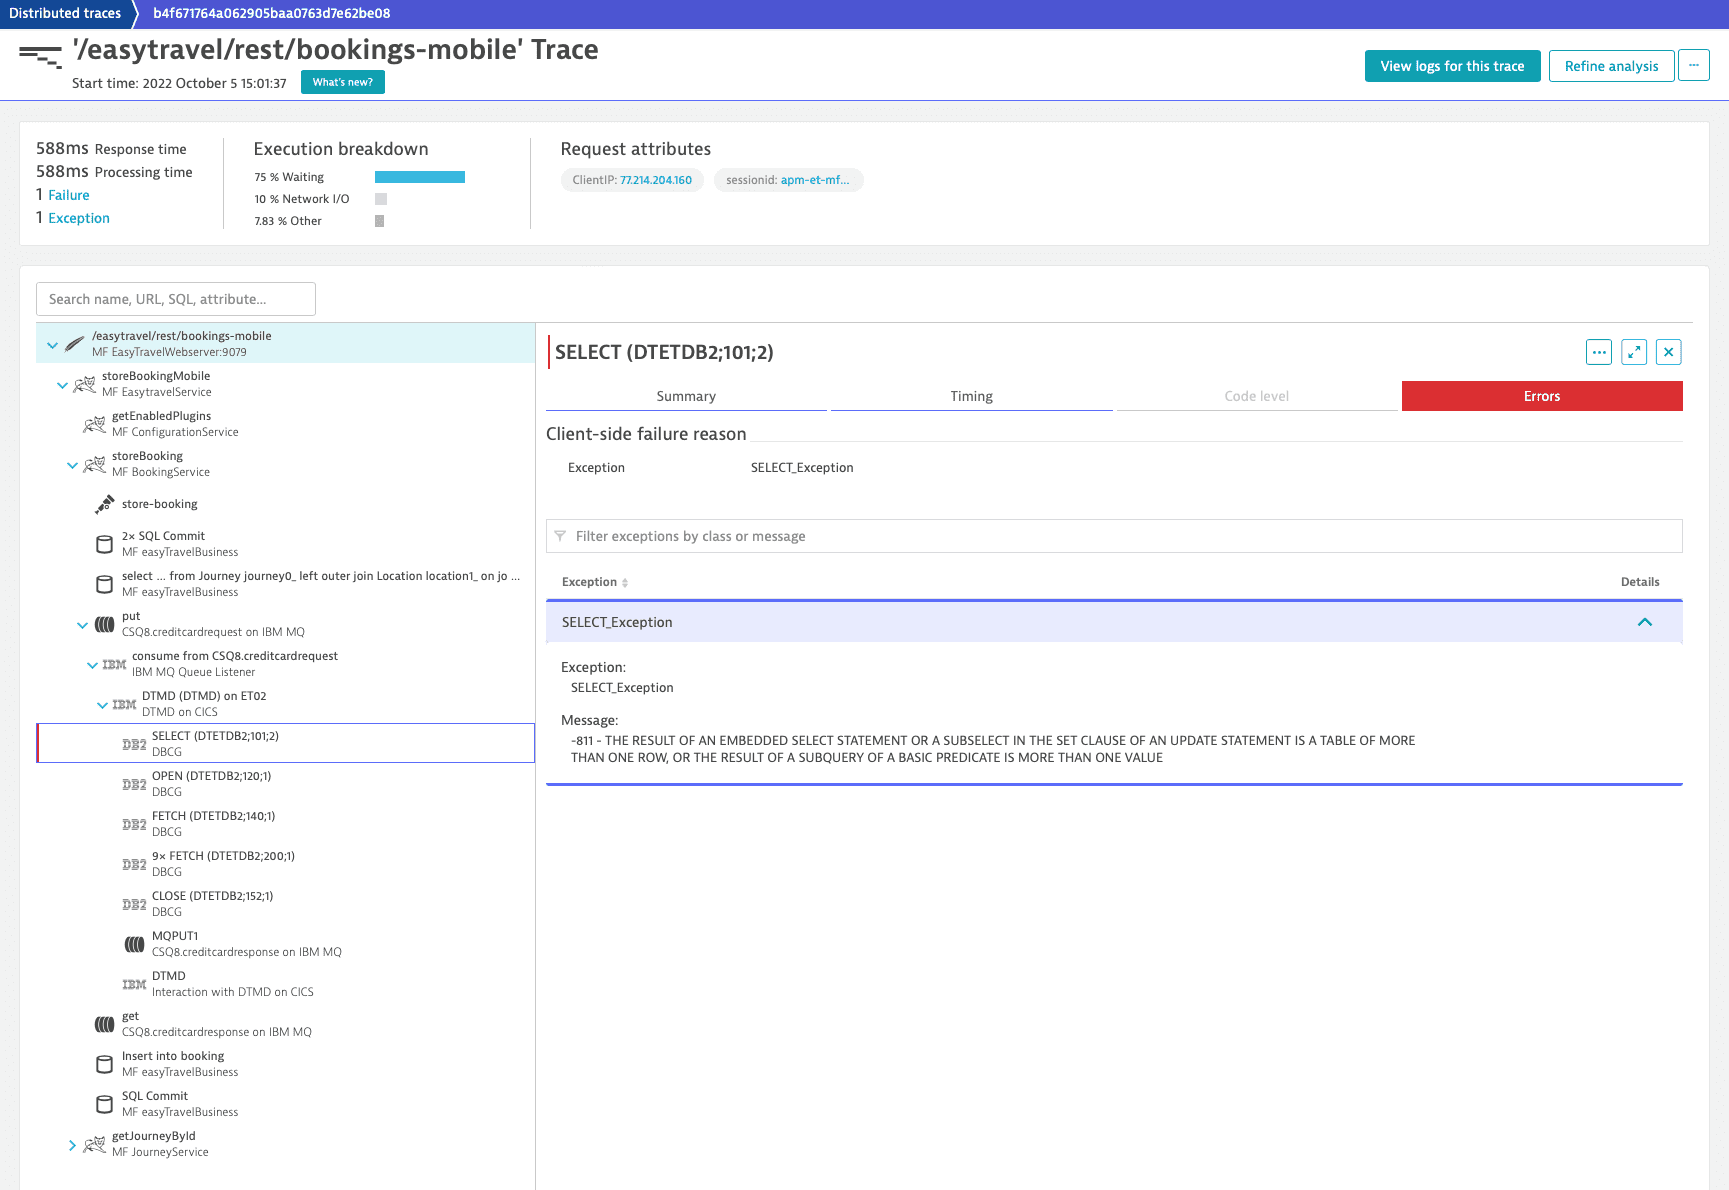
To explore the distributed trace for database calls, select it from the list or select Trace from the button menu. In the left panel, select a distributed trace name to get a more detailed view with tabs. It defaults to the Summary tab. Select the Errors tab to see the captured exceptions. In this example, there is a -811 exception.
To analyze this exception in the context of the implementation, select the Code level tab.
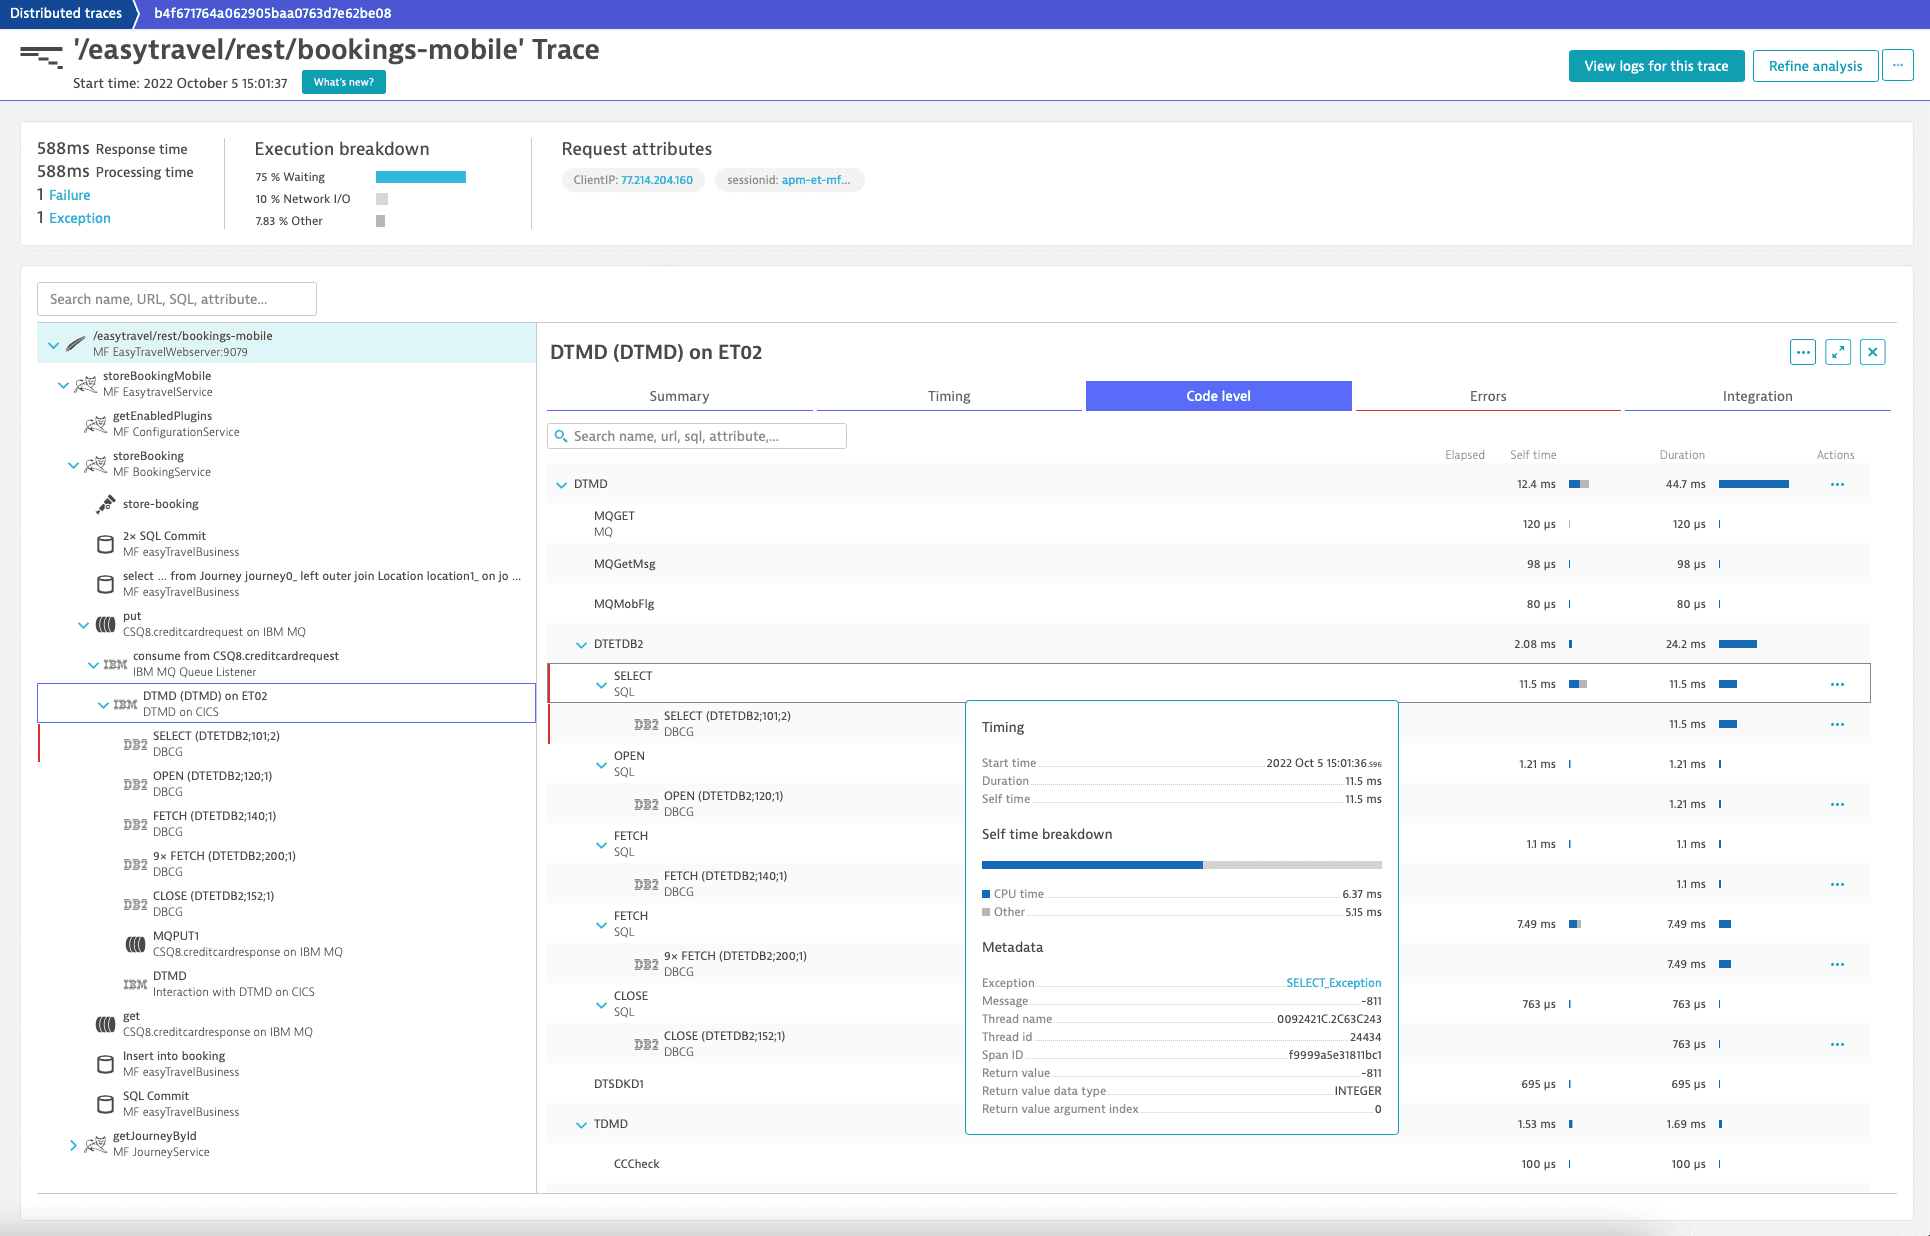
Trace transactions end-to-end
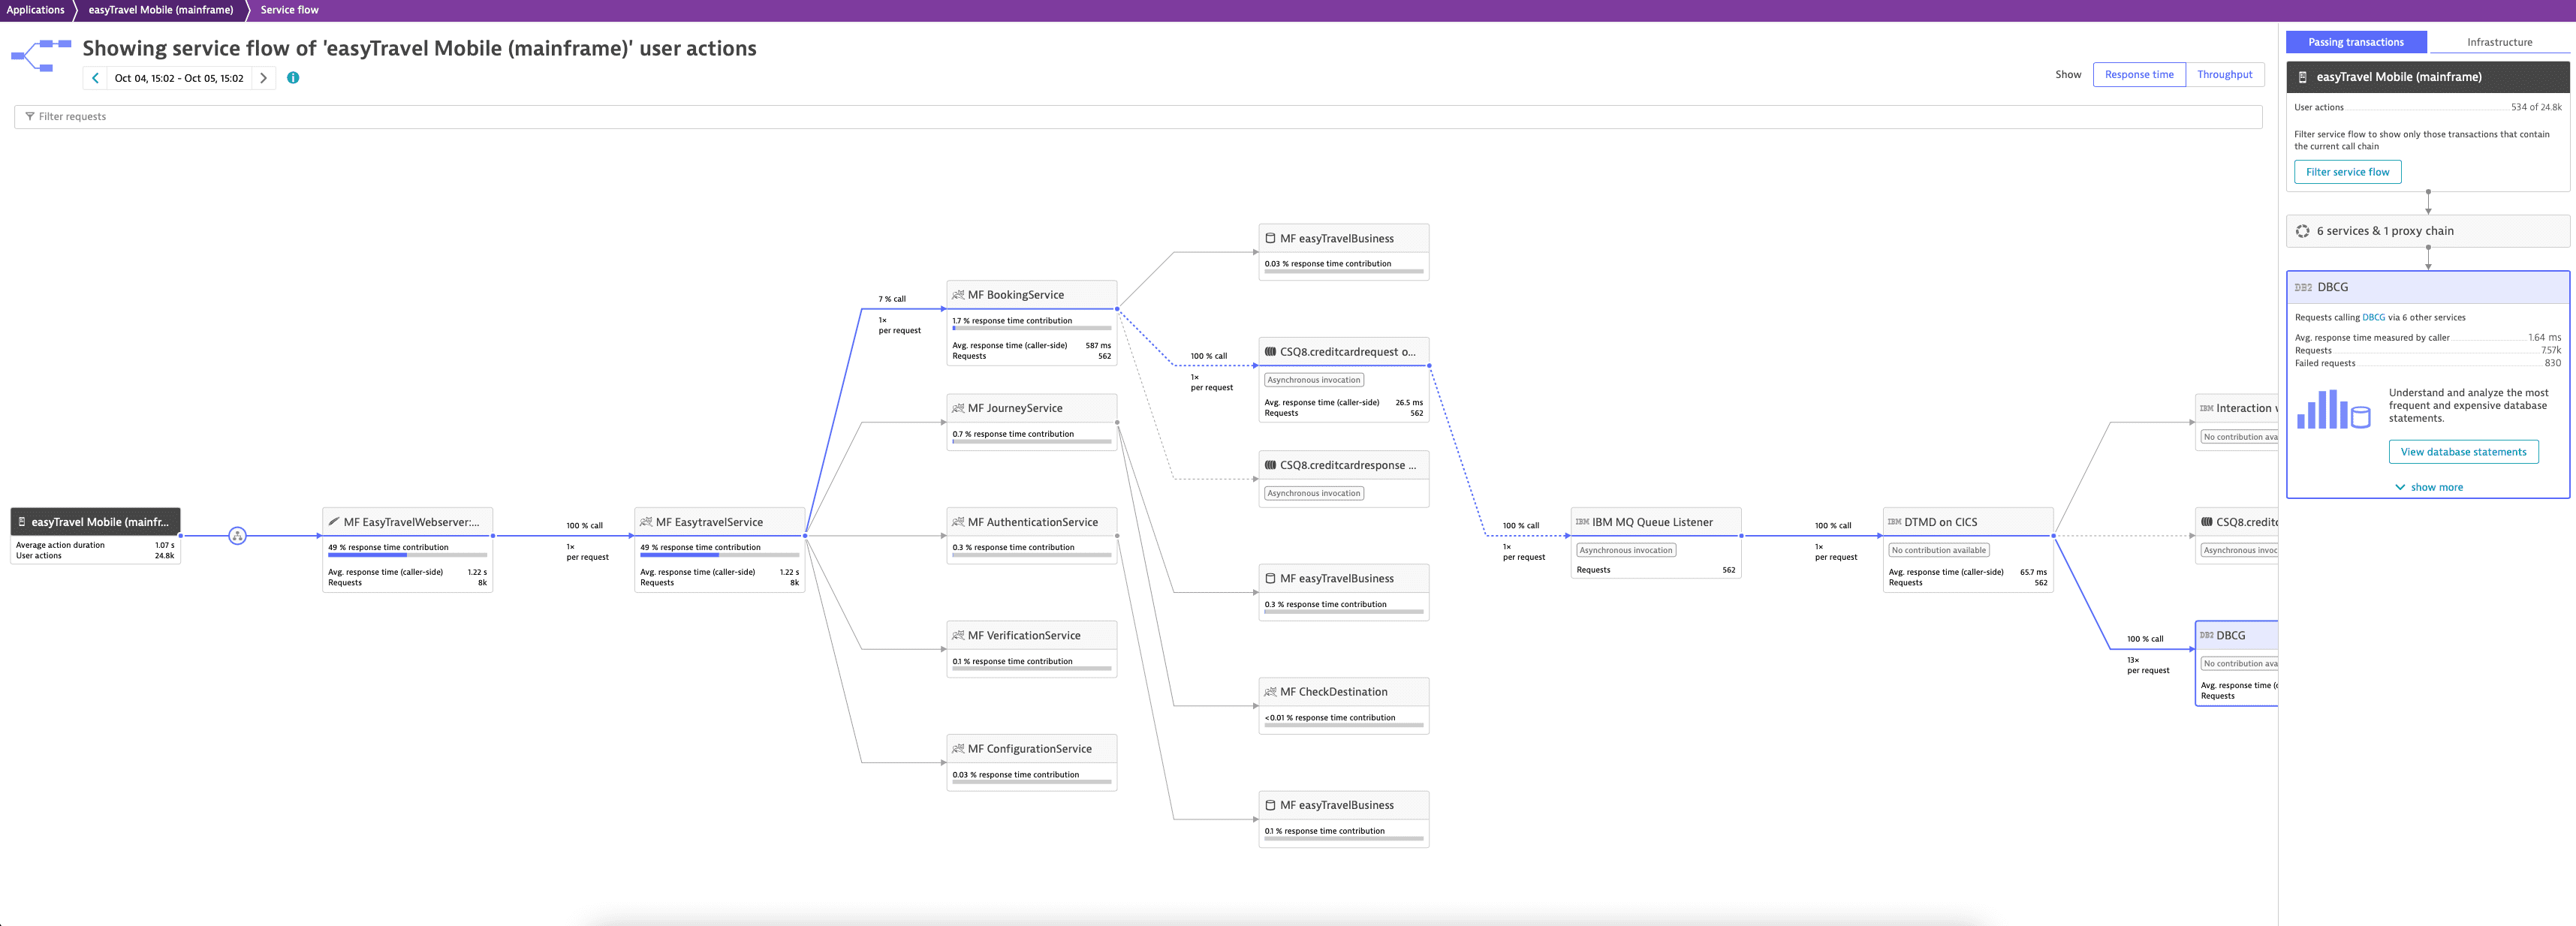
The service flow allows you to understand the performance and health of your transactions end-to-end. The example below shows how the mobile application interacts with the CICS transaction via IBM MQ and thereby breaks down the silos in mainframe monitoring for all involved parties.
