Monitor process-specific network connections
For network monitoring, Dynatrace provides technology-specific counters and comprehensive network insights. Dynatrace measures many valuable metrics and alerts you when problems are detected within processes.
Particularly when working with network metrics like retransmissions and traffic, it’s important that you know the volume and quality of communication between processes. Only then can you properly diagnose and troubleshoot problems that occur within the connections between vital application-infrastructure components. When Dynatrace detects a network problem, for example TCP retransmissions, you can precisely pinpoint the affected network links by analyzing the process connections within which the problem occurred.
Dynatrace traces crucial performance counters on the process-connections level, so you can easily identify process pairs that have high traffic and connectivity problems. Volume and network quality metrics for process pairs are visualized in the context of the selected host as well as in the context of connections to other processes on other hosts.
To analyze process connections between hosts:
-
Go to Hosts or Hosts Classic (latest Dynatrace).
-
Select the host you want to analyze.
-
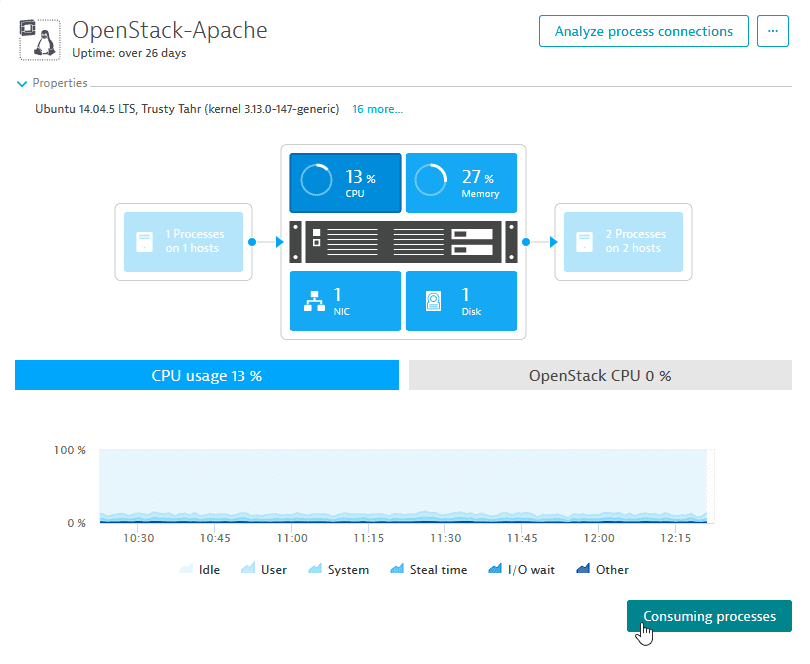
Select one of the Processes boxes (incoming or outgoing) on either side of the Hosts info-graphic to view:
- Number of processes involved in each communication
- Transfer rate
- Number of newly established connections per minute
-
Select Analyze process connections to get more information about process connections and related metrics.
You can view all TCP connections—that last longer than 10 seconds—made and received by the host. Connections are displayed in a way that’s similar to the Smartscape topology view. The middle column represents the analyzed host. The left-hand side represents the hosts and processes that connect to the analyzed host. The right-hand side shows the outbound communications of the analyzed host.
Select any process node (the middle column) to view relevant network metrics for that process’ connections (displayed in the right-hand pane). For each connection you’ll see network Transfer, Connectivity, and Retransmissions rates.