How to monitor network communications
Dynatrace infrastructure monitoring offers more than visibility into hosts and processes. With network communication monitoring, Dynatrace also gives you insight into the quality of the communications between your hosts and the processes that run on them. It isn't enough to know that a process has sufficient server resources and responds in a timely manner. You also need assurance that your processes are clearly communicating their responses to calling parties and have uninterrupted access to all required resources. You also need to know which processes are consuming your network resources. Such network communication insight can be gained by monitoring the data packets that are exchanged between processes and the hosts they run on.
Overhead generated by network monitoring is negligible and varies based on the analyzed traffic volume. Dynatrace monitors the overhead generated by network monitoring. If overhead increases above 5% of available CPU, throttling occurs. The network module is then paused for slightly less than 3 minutes. After this time, the network is re-enabled. If the threshold is still exceeded, network throttling occurs again, with the network module paused for twice as long. This continues until the threshold is no longer exceeded. The timing of the pauses doubles each time that the network is re-enabled and the threshold remains exceeded, up to a maximum pause time of 45 minutes.
Enable network monitoring
Network monitoring of all hosts in your environment is enabled by default. You can however disable and re-enable monitoring of individual hosts by going to Settings > Monitoring > Monitoring overview > Hosts. Select ![]() next to the host you want to configure and turn on Monitor this host switch.
next to the host you want to configure and turn on Monitor this host switch.
Analyzing network health
To monitor your network health, you can create a custom dashboard and add the Network status.
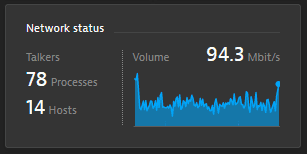
Select the Network status tile to go to your Host networking page.
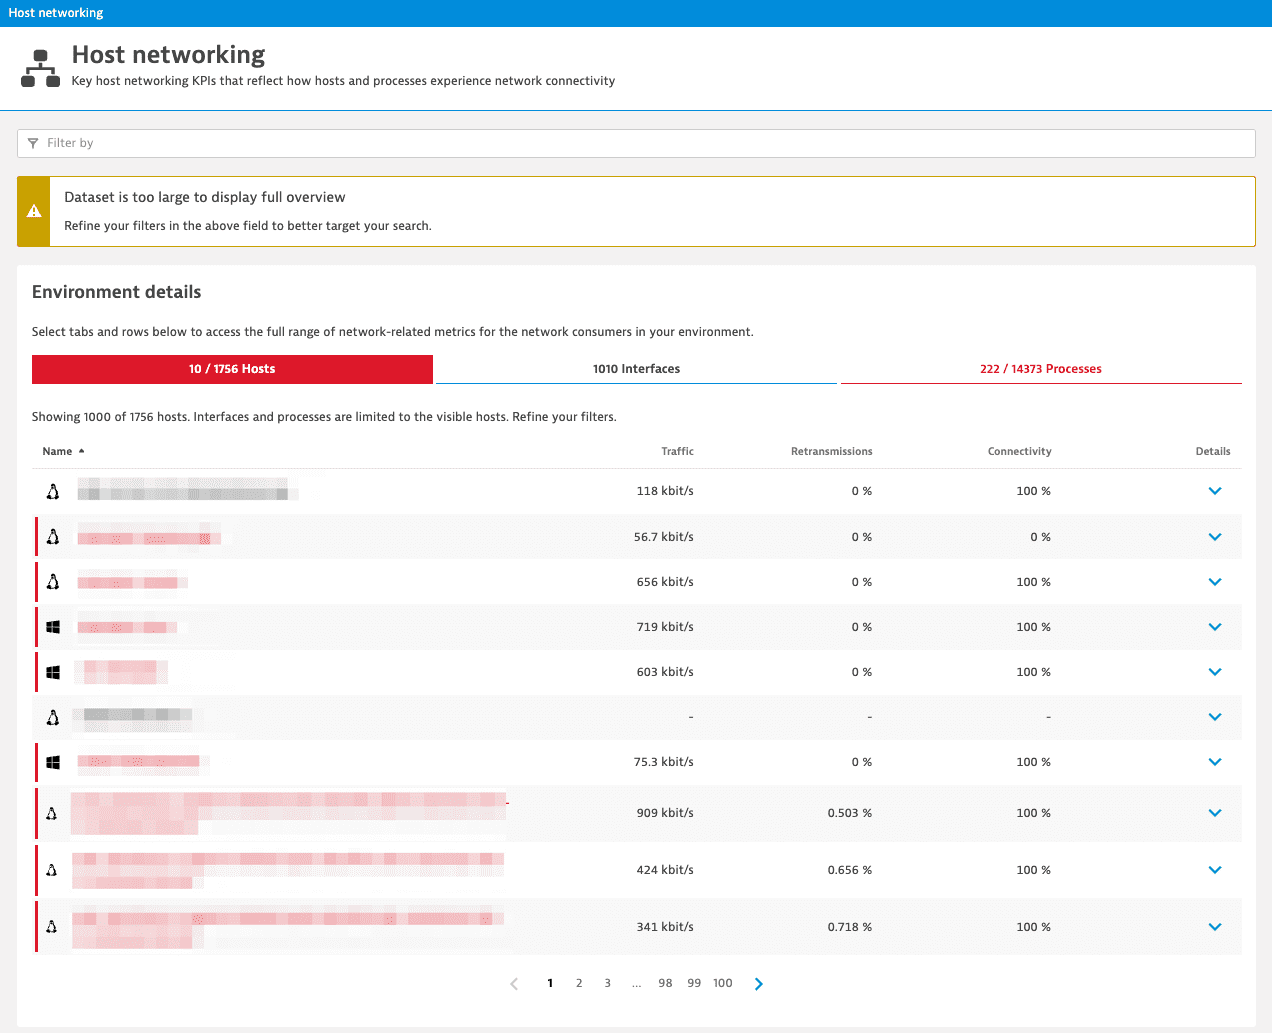
The Environment detail section of the Host networking page consists of three tabs: Hosts, Interfaces, and Processes.
Select a host listed on the Hosts tab to view a quick chart for Traffic in and Traffic out for that host.
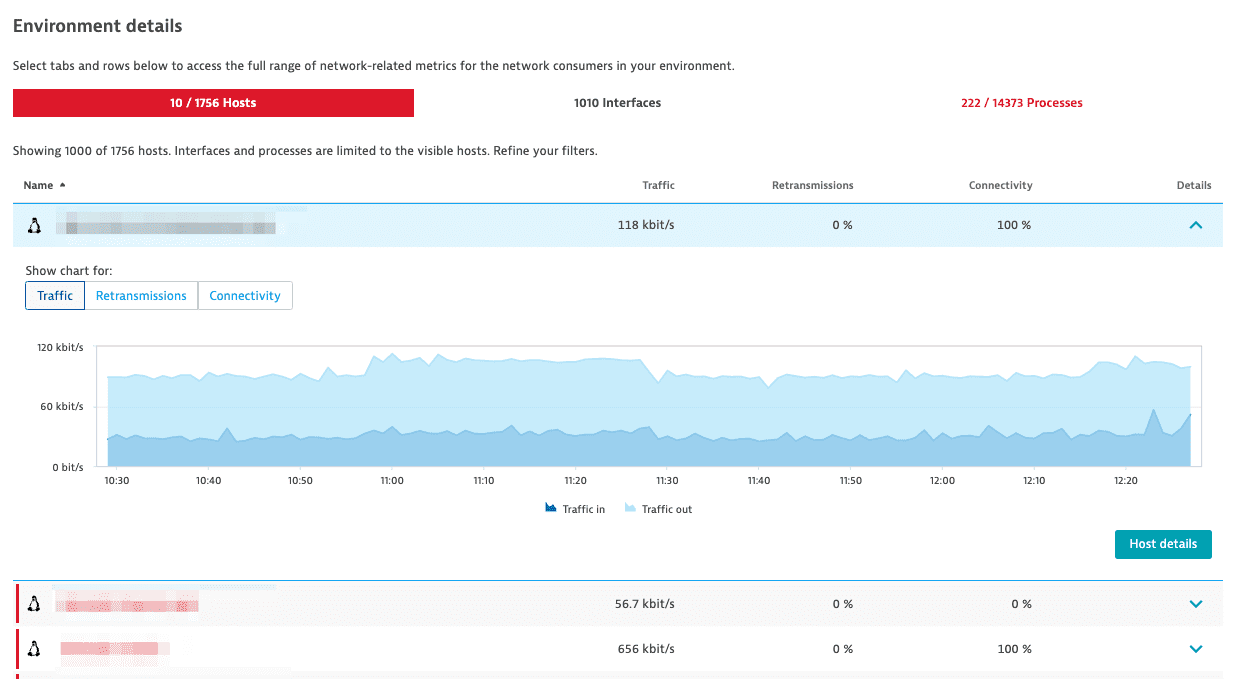
Select Analyze process connections to get more information about process connections and related metrics, or select Host details to get more information about host connections and related metrics.
Analyze process connections
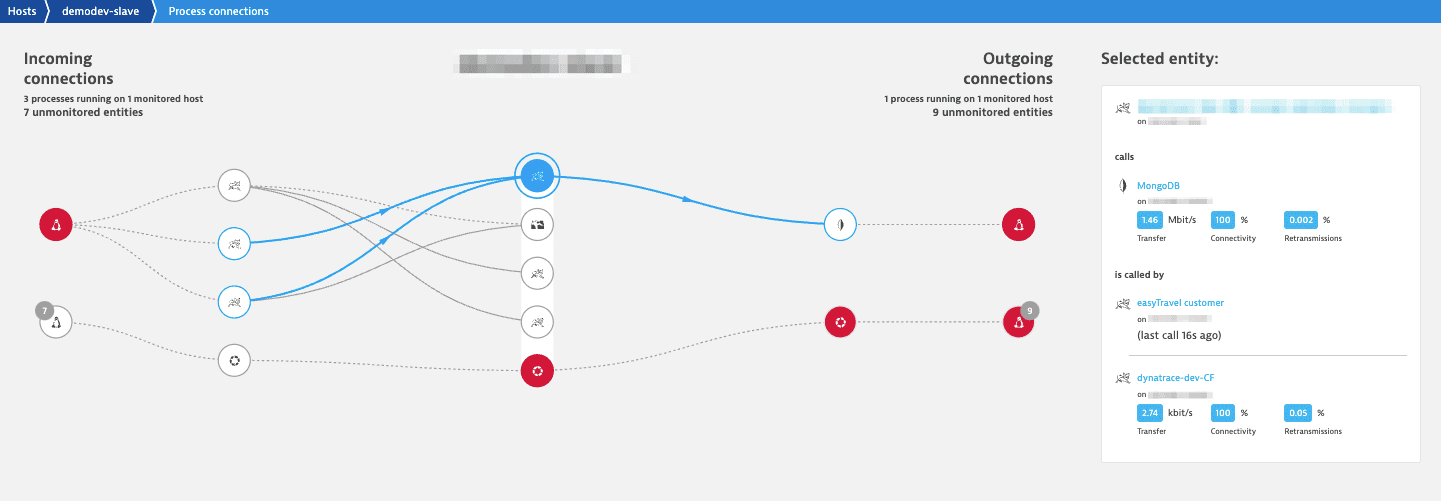
You can view all connections made and received by the host. Connections are displayed in a way that’s similar to Smartscape topology view. The middle column represents the analyzed host. The left-hand side represents the hosts and processes that connect to the analyzed host. The right-hand side shows the outbound communications of the analyzed host.
Select any process node (the middle column) to view relevant network metrics for that process' connections (displayed in the right-hand pane). For each connection, you’ll see network Transfer, Connectivity, and Retransmissions rates.
Host details
You can also select one of the four health statistics (CPU, Memory, Disk, or NIC) to view details of the metrics that contribute to each measurement.
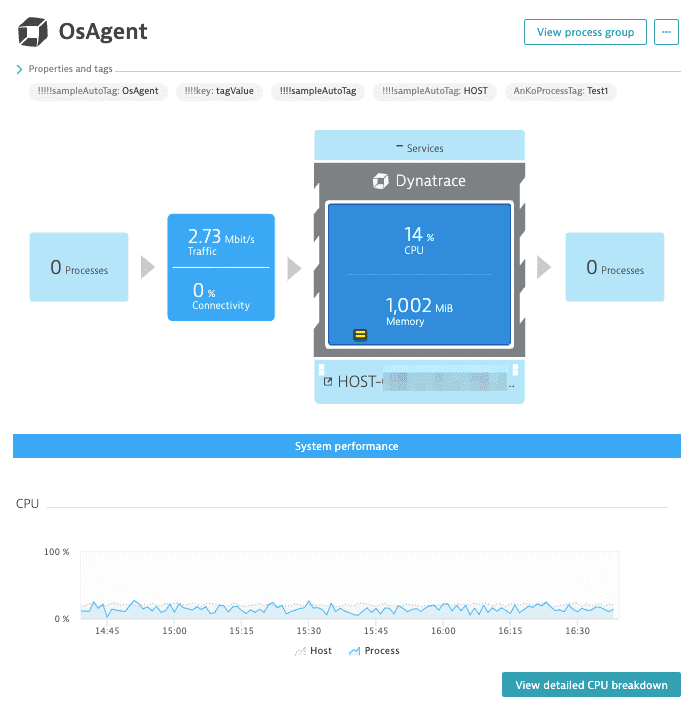
Traffic The average rate at which data was transmitted during the interval.
Packets The number of received and sent packets over the host network interface during the interval.
Quality An assessment of the number of dropped packets and errors.
Connectivity Percentage of properly established TCP connections compared to TCP connections that were refused or timed out.
The Connectivity measure can be used as an indicator of whether there's network traffic on a host. Note, however, that 0% connectivity doesn't necessarily indicate that there is a problem with a host. Assuming no TCP errors are present, it may simply mean that no users have attempted to connect to the host process during the selected timeframe.
Select View detailed CPU breakdown to go to the Detailed CPU consumption page for a detailed view of CPU consumption.
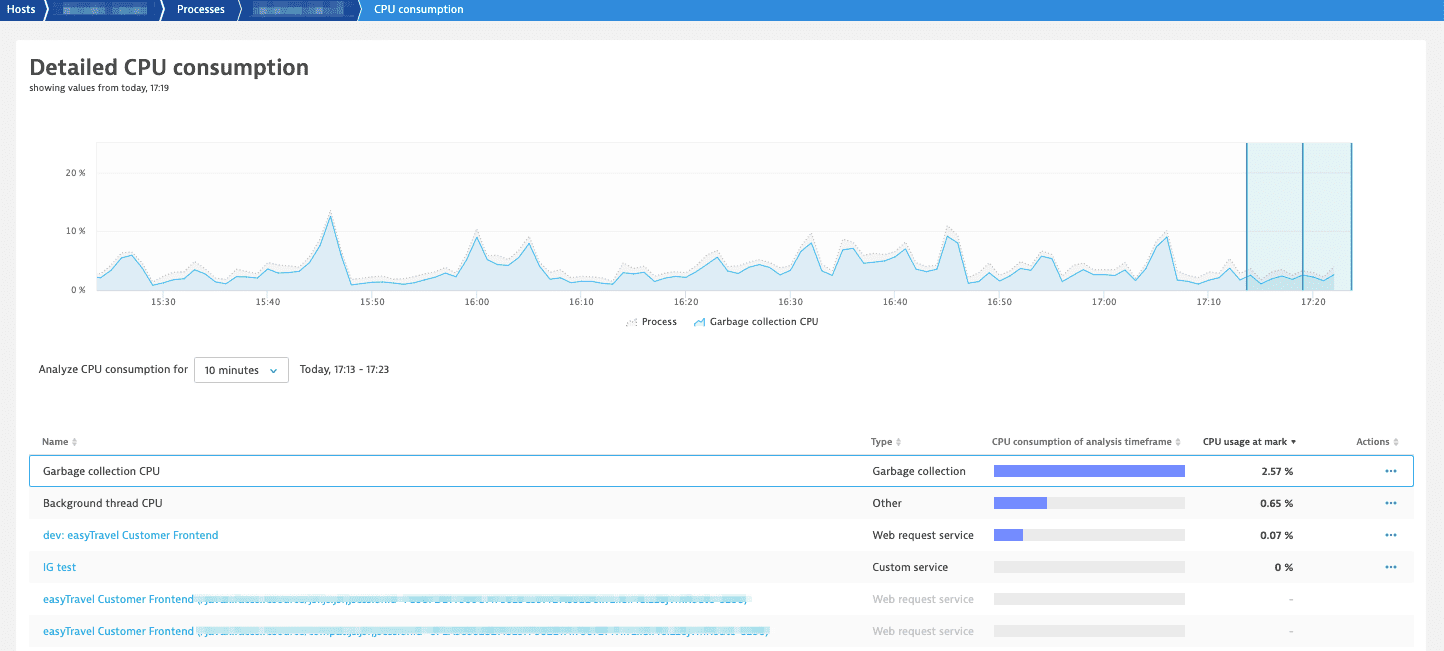
It provides metrics like the percentage of CPU consumed by each activity during a selected analysis timeframe and the CPU usage at a specific point in time.
Connectivity
Select the Connectivity panel in the process overview to view the Traffic, Connectivity and Quality details for this process.
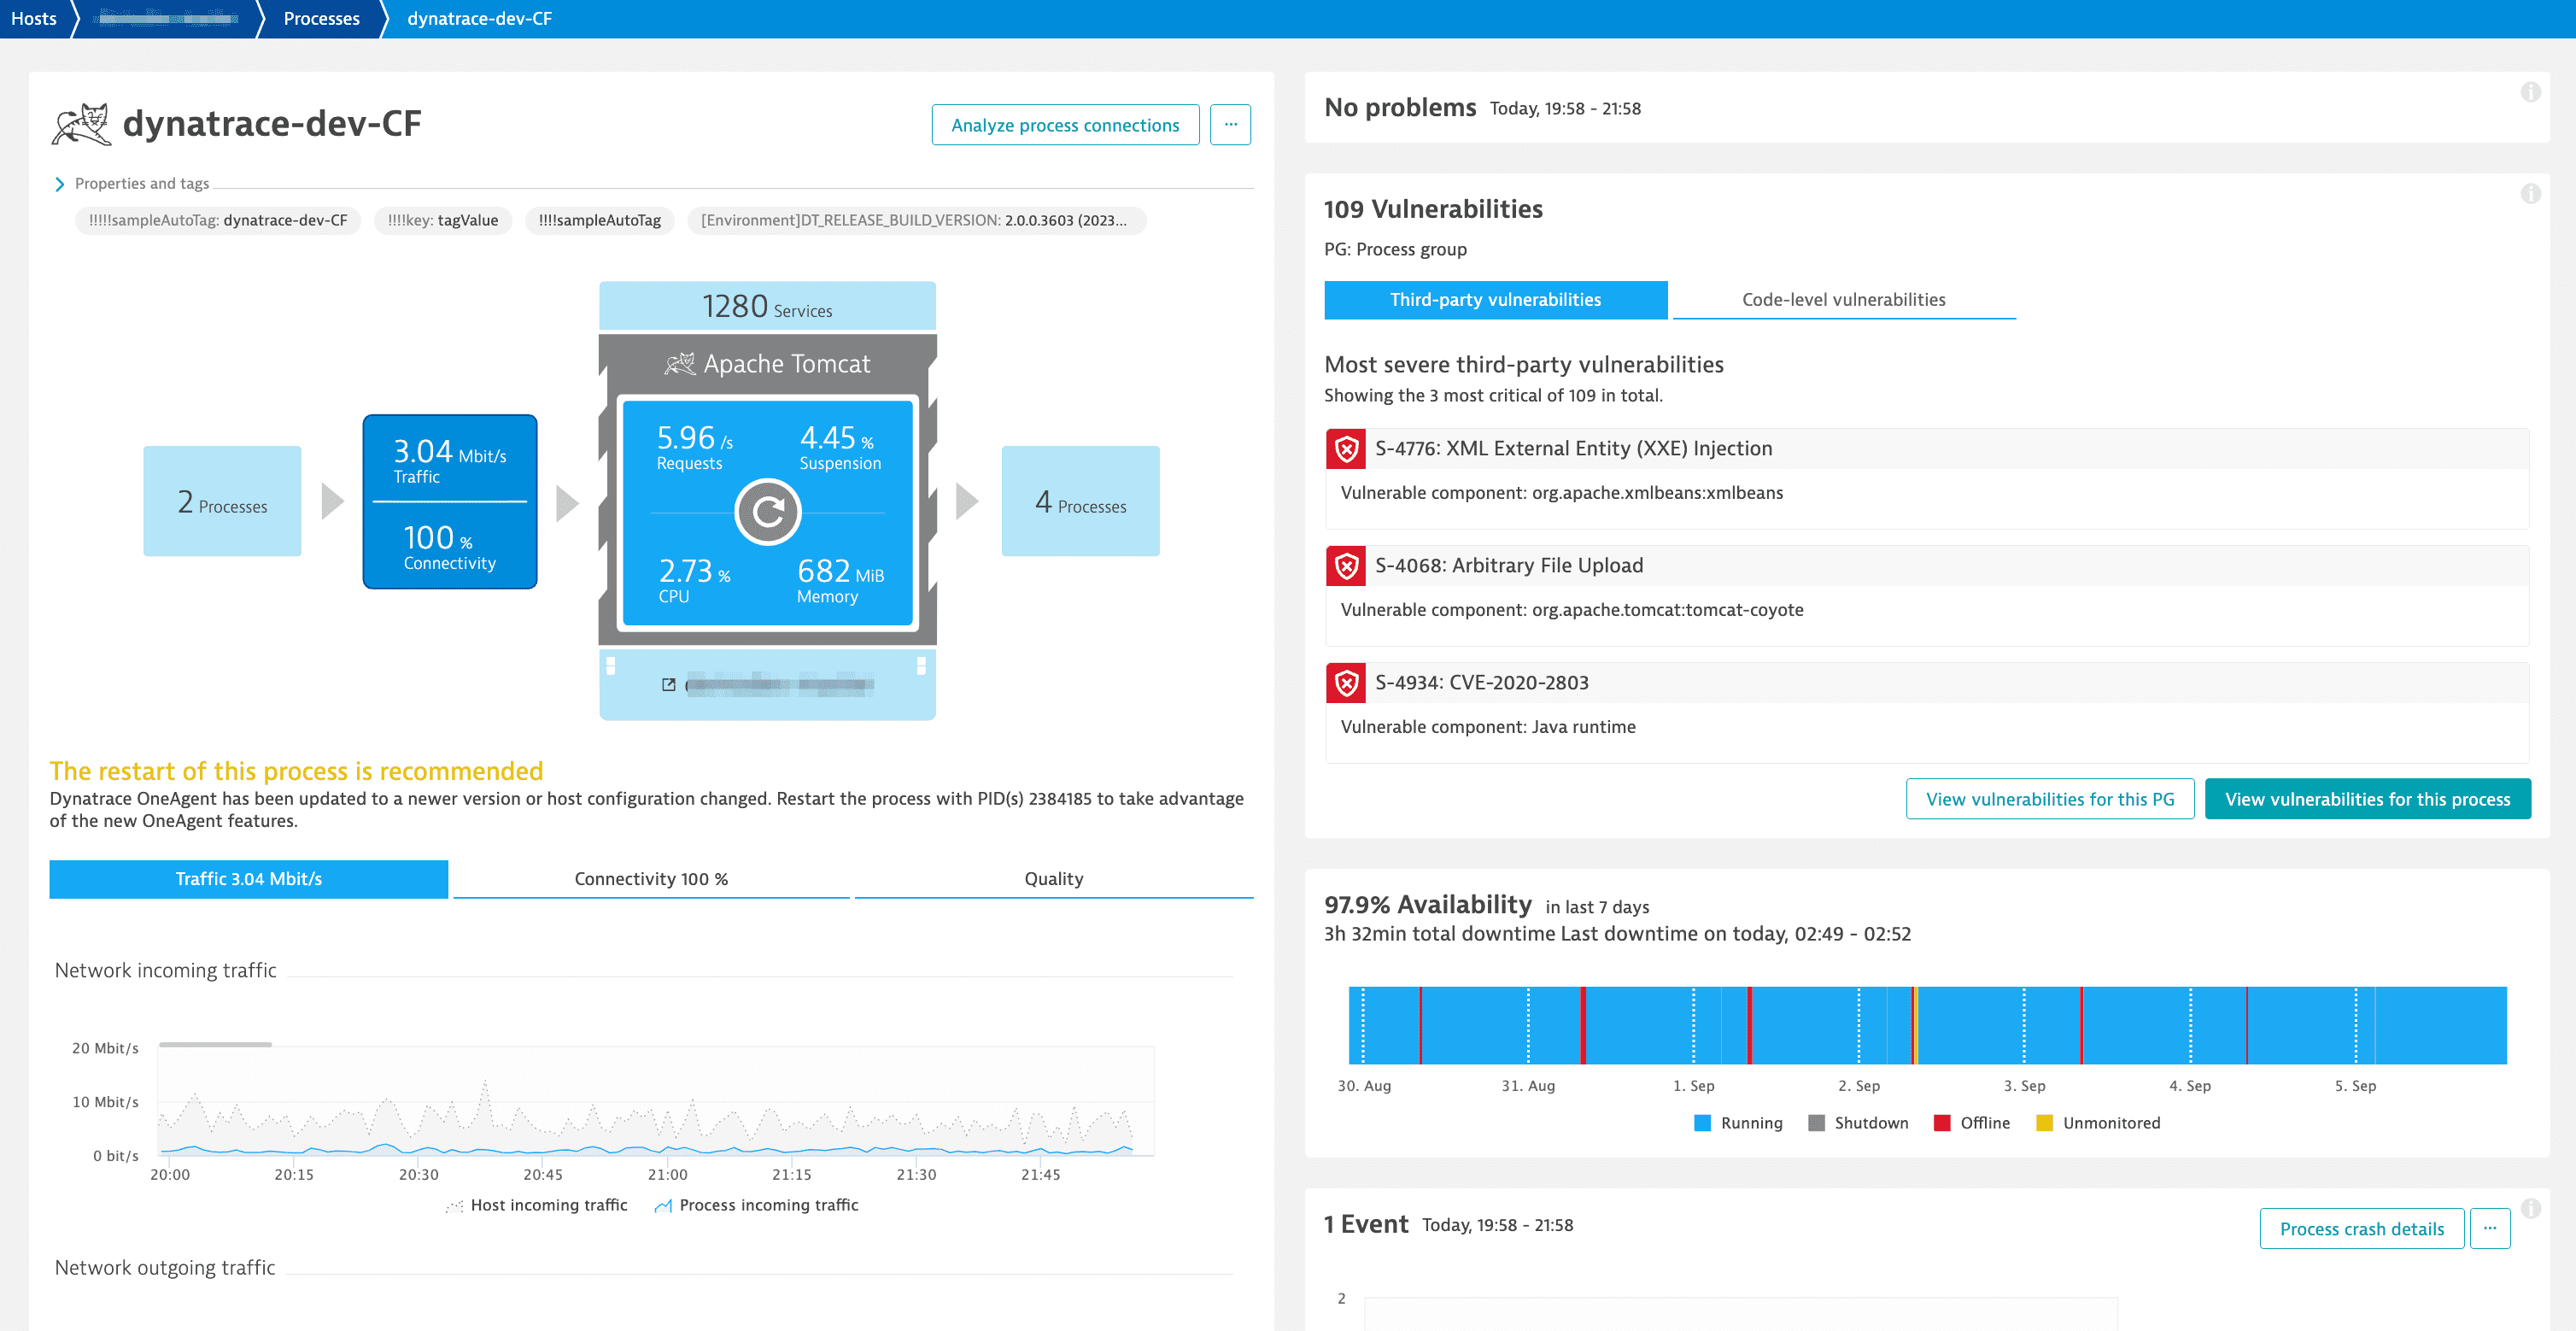
Connectivity is presented as two separately calculated metrics:
-
Connectivity Percentage of properly established TCP connections compared to TCP connections that were refused or timed out. Refused connections is a ratio comparing session resets to new network sessions.
-
Local connectivity Percentage of processes that establish TCP connections in other processes on the same host. Such connections don't generate network traffic. To keep the Connectivity value accurate, Local connectivity is treated as a separate connectivity metric.
Overloaded or poorly configured processes can have trouble accepting new network connections. This results in timeouts or resets of TCP handshakes. Such issues are tracked as TCP connection refused and TCP connection timeout errors.
Dynatrace also compares the number of such errors with the total number of connection attempts to calculate Connectivity metrics: the percentage of connections that have been successfully established. Ideally, Connection metrics are never lower than 100%. Anything less suggests failed user actions that will be obvious to your customers. Note, however, that 0% connectivity doesn't necessarily indicate that there is a problem with a host. Assuming no TCP errors are present, it may simply mean that no users have attempted to connect to the host process during the selected timeframe. To summarize, the connectivity metrics can be used as an indicator of whether there's network traffic on a host or not, but they refer more to the process-level network connection rather than simply host network performance.
Quality
When a network link or segment is overloaded or underperforming, it drops data packets. This is because overloaded network equipment queues are purged during periods of excessive traffic or limited hardware resources. In response, TCP protocol mechanisms attempt to fix the situation by retransmitting the dropped packets. Such retransmissions are detected by Dynatrace and displayed on all relevant Host and Process pages and Quality tabs.
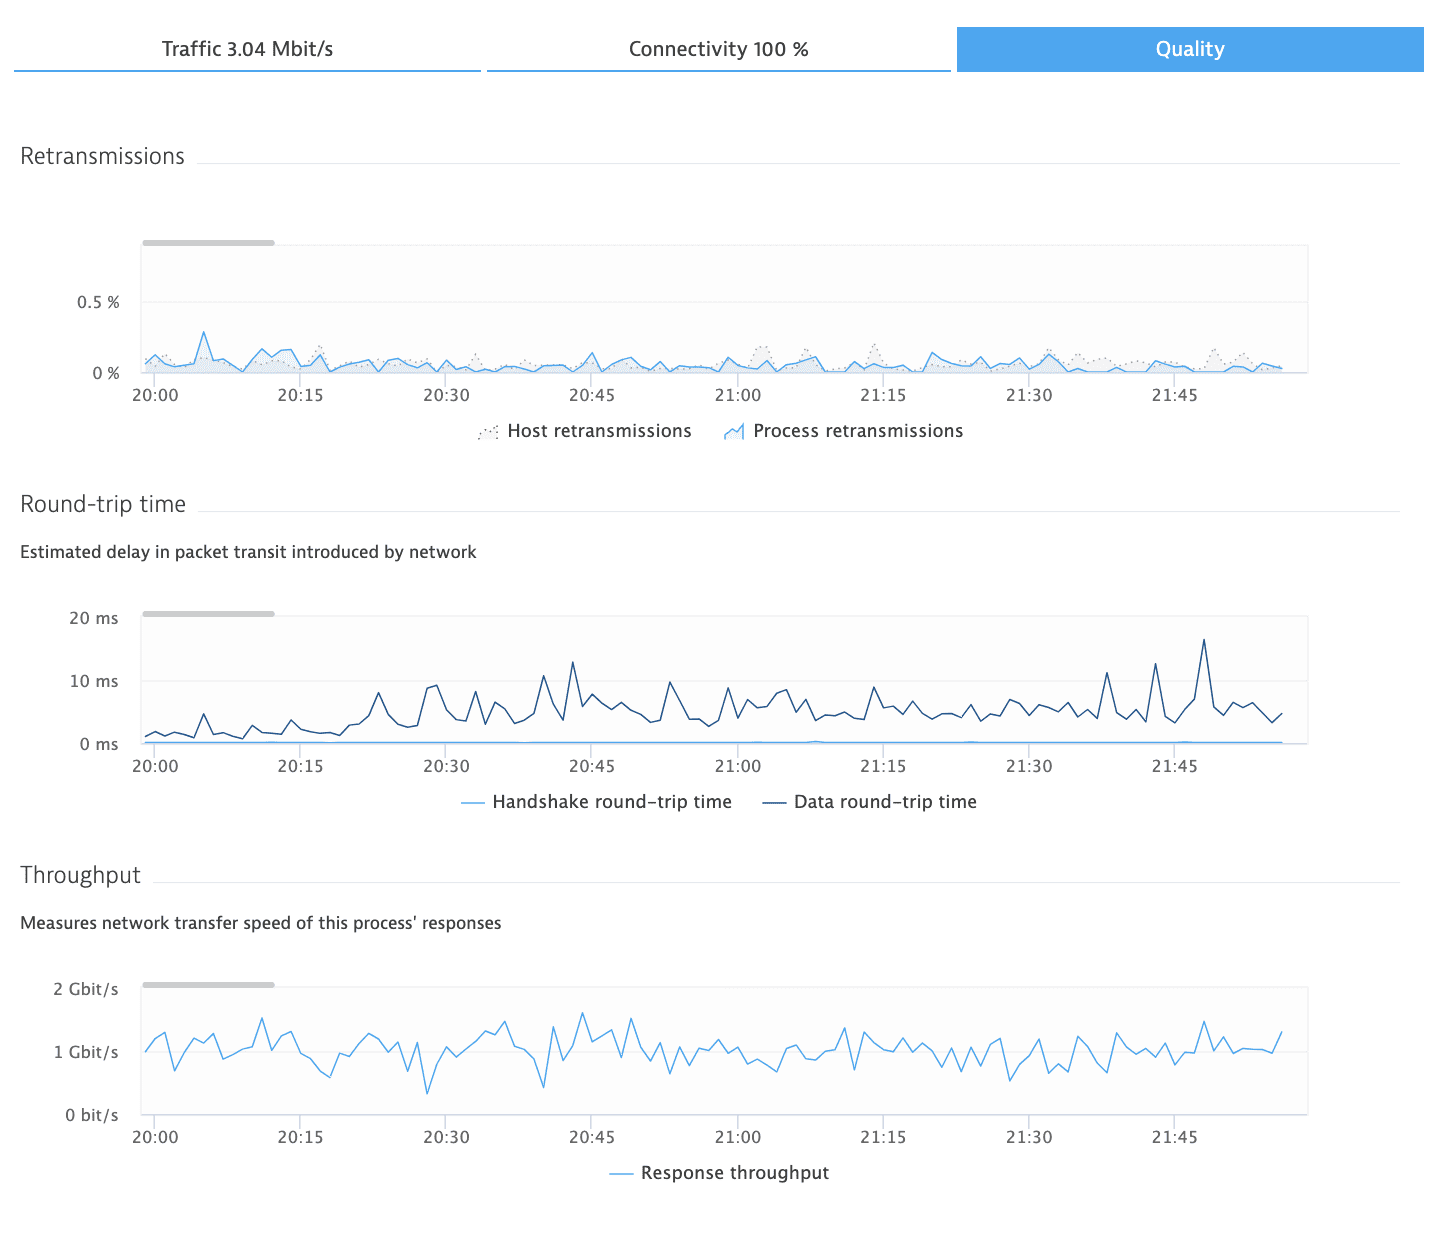
Ideally, retransmission rates should not exceed 0.5% on local area networks and 2% in Internet- or cloud-based networks. Retransmission rates above 3% negatively affect user experience in most modern applications. Retransmission issues are especially noticeable by customers using mobile devices in poor network coverage areas.