Detect network errors
Some network errors are mitigated and compensated for by network protocols and active networking components, such as network interfaces. Meanwhile, other network errors lead to performance problems that can negatively affect your services.
This topic lists and discusses common network errors, their root causes, and ways of detecting such errors.
Common network errors
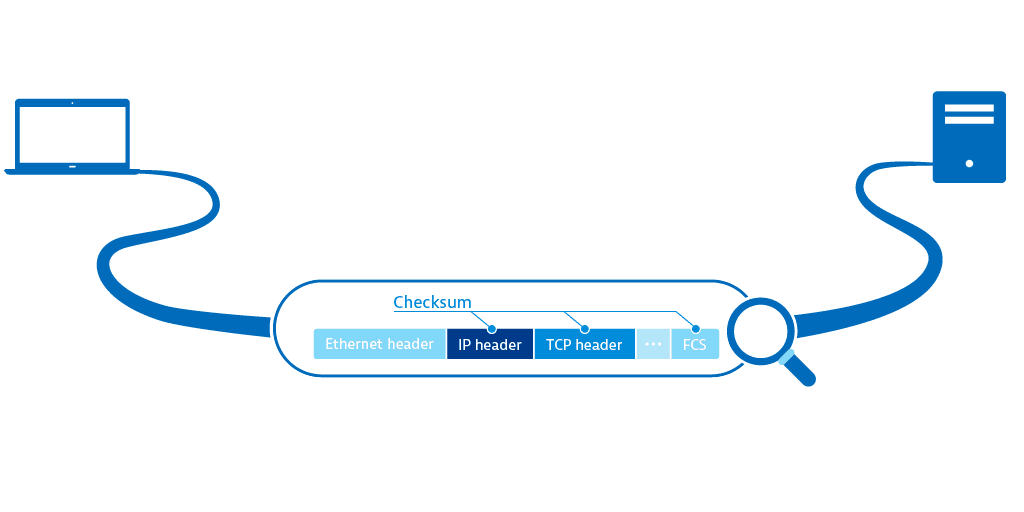
Packets with incorrect checksums aren't processed by the receiving host. If the Ethernet checksum (CRC) is wrong, the Ethernet frame is silently dropped by the network interface and can't be recovered even with packet capturing tools. Checksum errors often go undetected, despite the application of checksumming efforts.
When the processing queue on a switch or router is overloaded or when the queue for incoming packets on the host is full, packets are dropped.
Usually, when the TTL value hits 0, the time to live exceeded ICMP message is sent to the dispatcher of the package. However, some network components silently drop packets when TTL is equal to 0.
Common reasons for retransmissions include:
- network congestion where packets are dropped; either a TCP segment is lost on its way to the destination or the associated ACK is lost on the way back to the sender
- tight router QoS rules that give preferential treatment to certain protocols
- TCP segments that arrive out of order at their destination, usually because the segments are not in order. If the retransmission rate of traffic to and from the Internet is higher than 2%, it can impact the user experience.
Commands to troubleshoot network errors
Besides MAC address and IP address information, ifconfig provides detailed statistics about received and transmitted packets. The RX lines contain information about received packets, and the TX lines contain information about transmitted packets.

To view detailed network statistics for TCP, UDP, IP, and ICMP protocols, use netstat -s.

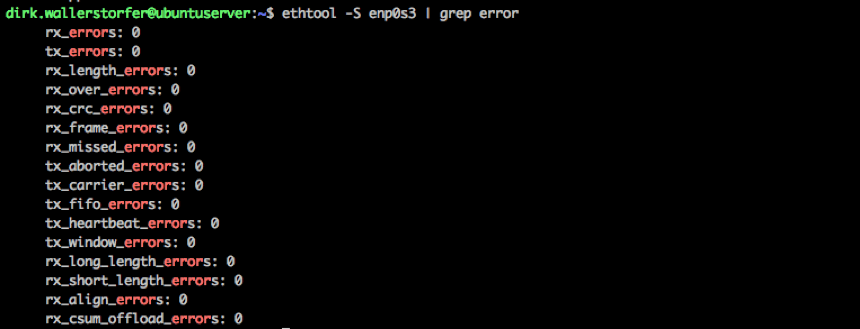
Use this tool to query and control the settings of the network interface and the network driver. It gives a detailed list of all errors that can occur on the network interface level, such as CRC and carrier errors. If there are no retransmissions on the TCP layer but ifconfig still returns a lot of erroneous packets, ethtool can help dig into the specifics. If ethtool returns a large number of errors, there is usually something wrong with the NIC, cable, switchport, or other hardware.
Use Dynatrace to monitor
When there are several hosts in a network, it's not efficient to ssh each computer and perform extensive procedures on them. Within complex environments, tool support is required.
As a monitoring tool, Dynatrace monitors all the hosts that are part of your infrastructure and sends notifications when performance anomalies are detected. Dynatrace creates performance baselines for all running services, incoming and outgoing network traffic, average response times to service calls, and the availability of each service from the point of view of the network. When any of these measurements degrade in comparison to the baseline, Dynatrace sends a notification.
You can use Dynatrace to measure and evaluate a number of networking and service-related metrics. Start with the following:
-
Network traffic provides a good overview of the overall usage and performance of your service. It's also a good indicator of whether you need to upscale your infrastructure.
-
Responsiveness measures the time from the last request packet that the service receives to the first response packet that the service sends. It measures the time a process needs to produce a response to a given request and must be watched in correlation with hardware resources.
-
Connectivity shows the percentage of properly established TCP connections compared to TCP connections that were refused or timed out. It shows when services were available to clients and when they were not, over time.