TensorFlow Keras observability
- Latest Dynatrace
- Tutorial
- 4-min read
- Published Jun 06, 2023
TensorFlow and its user-friendly Keras sequential interface represent state-of-the-art technology for training and running deep learning models.
TensorFlow represents a general-purpose machine learning framework that allows data scientists to build, train and run all kinds of AI models on top.
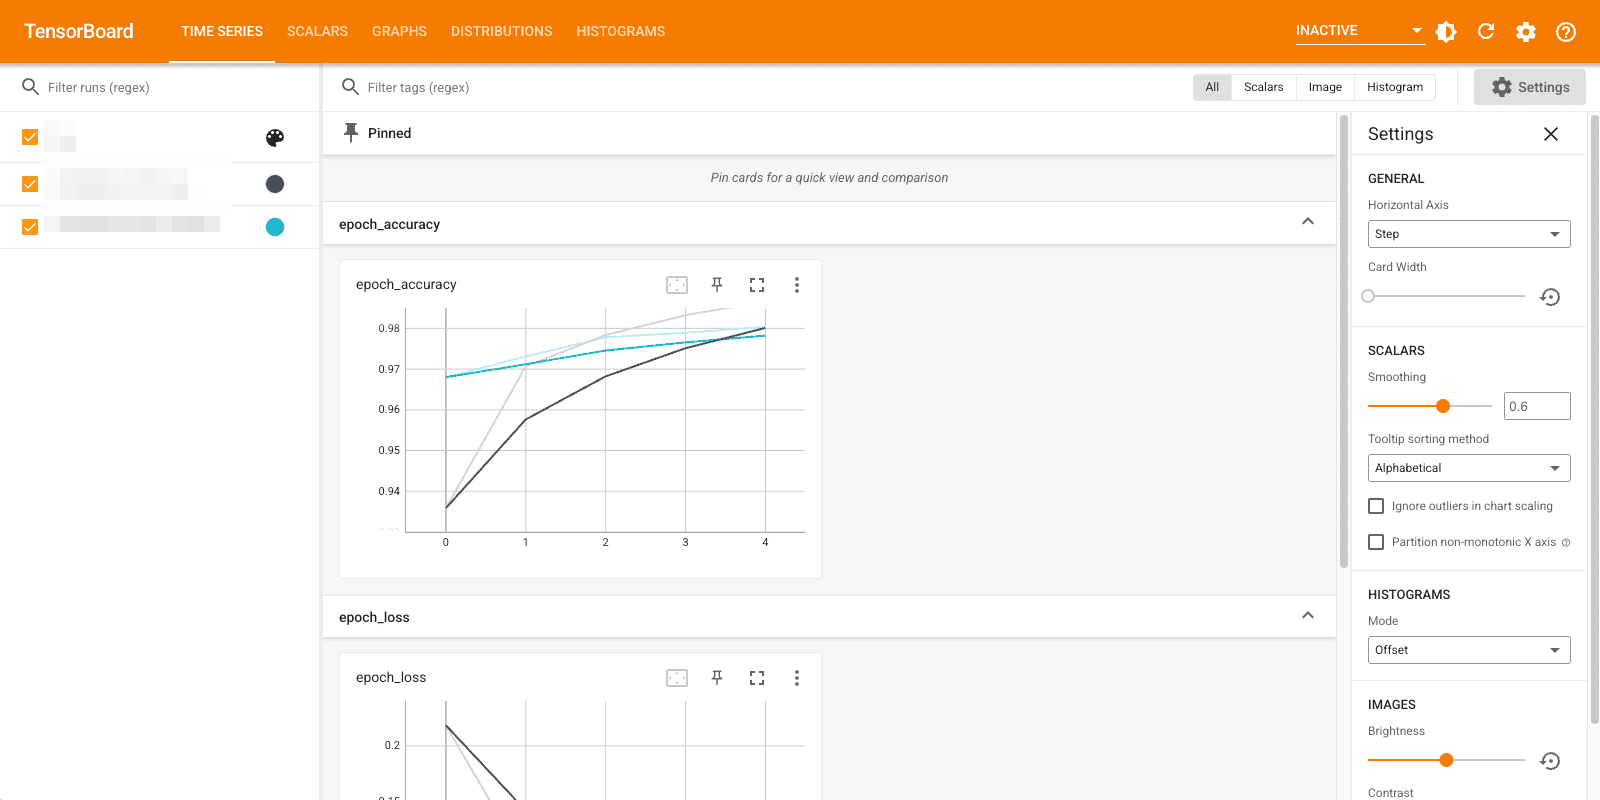
TensorFlow also ships together with a convenient debugging server called TensorBoard that allows data scientists to collect and visualize all relevant training information such as logs, events, and metrics within a Web dashboard.
See below an example screenshot of TensorBoard and how it visualizes the progress of model training:
While TensorBoard is a great tool for local debugging of your AI model, it is not applicable for long-term observability of your running AI model in production.
As TensorBoard data collection is built on top of a flexible TensorFlow callback receiver interface, it is easy to directly send observability information about your running AI model to Dynatrace.
All that is necessary is a dedicated TensorFlow callback implementation that collects the data and forwards to a Dynatrace monitoring environment.
Dynatrace TensorFlow callback receiver
A TensorFlow callback receiver implementation does receive important information updates during training and evaluation phase of a model.
See below the implementation of a Dynatrace TensorFlow callback receiver that forwards metric data during training and evaluation of a model.
import tensorflow as tffrom tensorflow import kerasimport requests# Custom TensorFlow Keras callback receiver that sends the logged metrics# to a Dynatrace monitoring environment.# Read more about writing your own callback receiver here:# https://www.tensorflow.org/guide/keras/custom_callbackclass DynatraceKerasCallback(keras.callbacks.Callback):metricprefix = ''modelname = ''url = ''apitoken = ''batch = ''# Constructor that takes a metric prefix, the name of the current model that is used,# the Dynatrace metric ingest API endpoint (e.g.: https://your.live.dynatrace.com/api/v2/metrics/ingest)# and the Dynatrace API token (with metric ingest scope enabled)def __init__(self, metricprefix='tensorflow.', modelname='', url='', apitoken=''):self.metricprefix = metricprefixself.modelname = modelnameself.url = urlself.apitoken = apitokendef send_metric(self, name, value, tags):tags_str = ''for tag_key in tags:tags_str = tags_str + ',{key}={value}'.format(key=tag_key, value=tags[tag_key])line = '{prefix}.{name}{tags} {value}\n'.format(prefix=self.metricprefix, tags=tags_str, model=self.modelname, name=name, value=value)self.batch = self.batch + linedef flush(self):print(self.batch)r = requests.post(self.url, headers={'Content-Type': 'text/plain', 'Authorization' : 'Api-Token ' + self.apitoken}, data=self.batch)self.batch = ''def on_train_end(self, logs=None):keys = list(logs.keys())for m in keys:self.send_metric(m, logs[m], { 'model' : self.modelname, 'stage' : 'train' })self.flush()def on_epoch_end(self, epoch, logs=None):keys = list(logs.keys())for m in keys:self.send_metric(m, logs[m], { 'model' : self.modelname, 'stage' : 'train' })self.flush()def on_test_end(self, logs=None):keys = list(logs.keys())for m in keys:self.send_metric(m, logs[m], { 'model' : self.modelname, 'stage' : 'test' })self.flush()def on_predict_end(self, logs=None):keys = list(logs.keys())for m in keys:self.send_metric(m, logs[m], { 'model' : self.modelname, 'stage' : 'predict' })self.flush()
Example Keras model training and evaluation
In the following example, a Keras model loads a well-known sample data set (MNIST) and trains a Keras sequential model.
A Dynatrace TensorFlow callback receiver is configured that automatically receives and forwards the accuracy and loss metric to the configured monitoring environment.
In a production deployment of the model (the evaluation step) the same Dynatrace callback receiver is used to continuously receive observability data about the running model.
import tensorflow as tfprint("TensorFlow version:", tf.__version__)import time# load the Dynatrace callback receiverfrom dynatrace import DynatraceKerasCallback# Load a sample data setmnist = tf.keras.datasets.mnist(x_train, y_train), (x_test, y_test) = mnist.load_data()x_train, x_test = x_train / 255.0, x_test / 255.0# Define a modelmodel = tf.keras.models.Sequential([tf.keras.layers.Flatten(input_shape=(28, 28)),tf.keras.layers.Dense(128, activation='relu'),tf.keras.layers.Dropout(0.2),tf.keras.layers.Dense(10)])# Define a loss functionloss_fn = tf.keras.losses.SparseCategoricalCrossentropy(from_logits=True)# Compile the modelmodel.compile(optimizer='adam',loss=loss_fn,metrics=['accuracy'])# Define the tensor board callbacksdt_callback = DynatraceKerasCallback(metricprefix='tensorflow', modelname='mnist-classifier', url='https://<YOUR_ENV>.live.dynatrace.com/api/v2/metrics/ingest', apitoken='<YOUR_TOKEN>')# Train the modelmodel.fit(x_train, y_train, epochs=5, callbacks=[dt_callback])# Use the model in productionwhile True:model.evaluate(x_test, y_test, verbose=2, callbacks=[dt_callback])time.sleep(60)
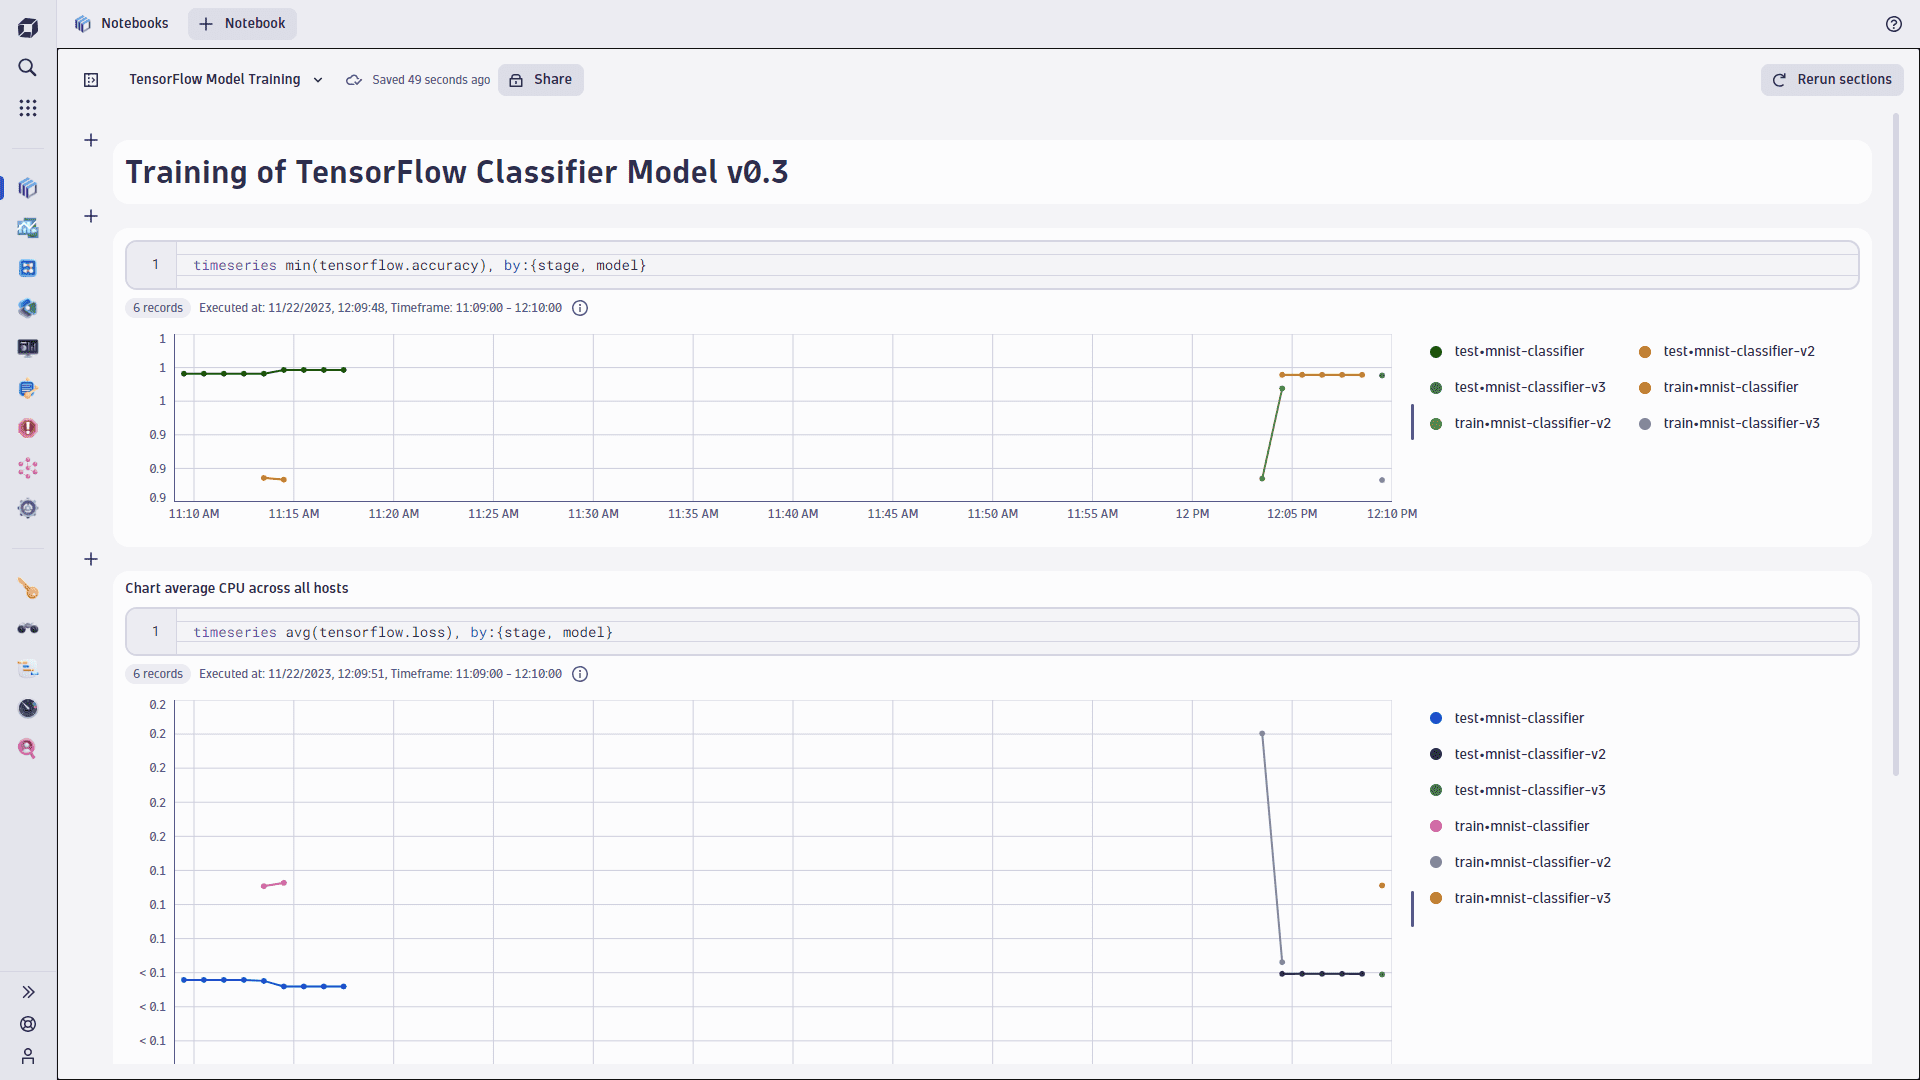
Visualize TensorFlow model metrics in Dynatrace
Once the Dynatrace TensorFlow callback receiver is registered within your own AI model, all the collected metrics are forwarded to your monitoring environment.
The screenshot below shows a Data Explorer visualization of the accuracy metric that was collected from the TensorFlow callback receiver: