WMI tutorial - data source
- Latest Dynatrace
- How-to guide
- 3-min read
- Published Mar 30, 2022
To enable your extension to collect metrics and have those metrics ingested into Dynatrace, you must define a data source. In this tutorial we're using the WMI data source. This must be a section called wmi in your extension.
The purpose of the wmi section is to define the WMI queries that retrieve your metrics, how often they should run, and how to map their results to metrics and dimensions that Dynatrace can ingest. Groups and subgroups are used to organize data and define shared properties like dimensions and running frequency.
For our extension, we're using 3 WMI Queries. We'll add them to our extension.yaml and ingest their result as Dynatrace metrics:
-
Extract CPU Usage, User CPU, and Idle CPU for each of the host's processors (split by CPU ID).
SELECT Name, PercentProcessorTime, PercentIdleTime, PercentUserTime FROM Win32_PerfFormattedData_PerfOS_Processor WHERE Name LIKE '_Total' -
Extract the Total, Sent, and Received Bytes per second for each network adapter running on the host
SELECT Name, BytesTotalPersec, BytesReceivedPersec, BytesSentPersec FROM Win32_PerfFormattedData_Tcpip_NetworkAdapter -
Extract the Total, Sent, and Received Bytes per second for each network interface running on the host
SELECT Name, BytesTotalPersec, BytesReceivedPersec, BytesSentPersec FROM Win32_PerfFormattedData_Tcpip_NetworkInterface
Tips
Metric best practices
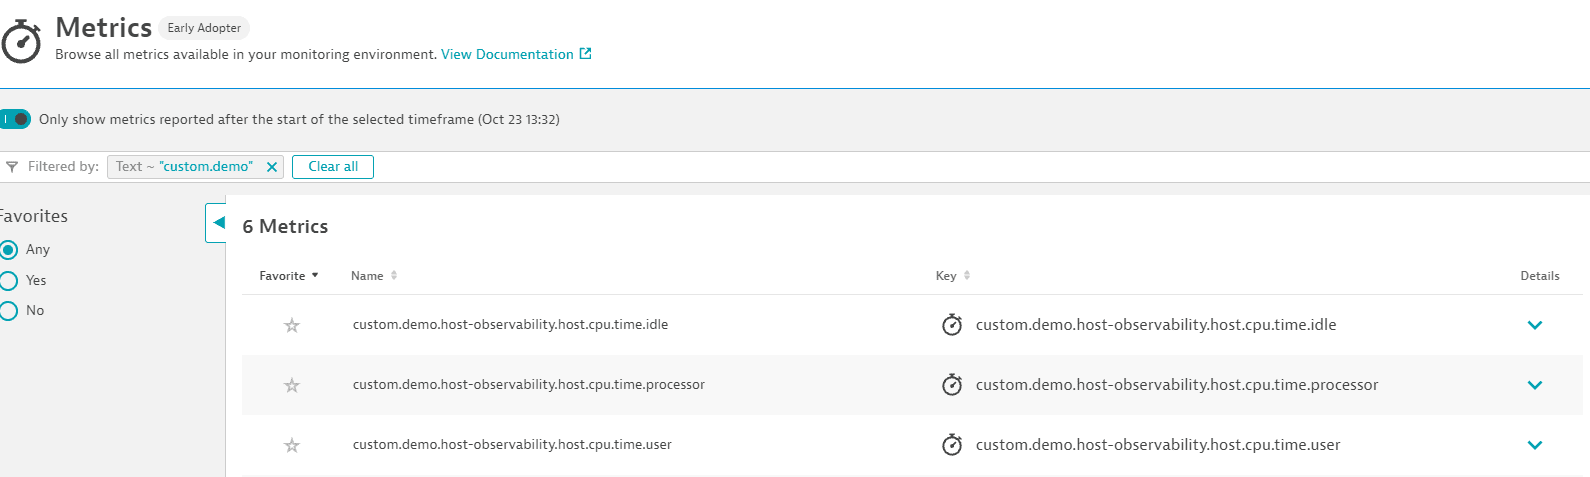
Prefix your metric keys with the name of the extension to avoid clashes with other metrics in Dynatrace. For this exercise, we prefix each metric key with custom.demo.host-observability.
Host dimension
You can identify the host running the extension through the this:device.host passed as a dimension value.
Static dimensions
You can add dimensions that are fixed strings using the prefix const:.
Define your data source
Add the wmi section to your extension.yaml using the template below.
- Create two groups called
HostandNetworkthat run every 1 min. Both groups should have a dimension that identifies the host running the extension. - Create a subgroup for each WMI query given above and map the columns retrieved to metrics and dimensions.
- Add a dimension called
network.typethat takes the valueAdapterorInterface, depending on the WMI query. - Package a new version of your extension and upload it.
- Configure it to monitor your Windows host. You can do it during extension activation in Dynatrace Hub.
- Give it a minute, and then validate metric collection.
For more information on the WMI data source syntax, see WMI data source reference.
wmi:- group: Hostinterval:minutes: 1dimensions:- key: hostvalue: this:device.hostsubgroups:- subgroup: CPUquery: SELECT Name, PercentProcessorTime, PercentIdleTime, PercentUserTime FROM Win32_PerfFormattedData_PerfOS_Processor WHERE Name LIKE '_Total'metrics:- key: custom.demo.host-observability.host.cpu.time.processorvalue: column:PercentProcessorTime- key: custom.demo.host-observability.host.cpu.time.idlevalue: column:PercentIdleTime- key: custom.demo.host-observability.host.cpu.time.uservalue: column:PercentUserTimedimensions:- key: host.cpu.idvalue: column:Name- group: Networkinterval:minutes: 1dimensions:- key: hostvalue: this:device.hostsubgroups:- subgroup: Adaptersquery: SELECT Name, BytesTotalPersec, BytesReceivedPersec, BytesSentPersec FROM Win32_PerfFormattedData_Tcpip_NetworkAdaptermetrics:- key: custom.demo.host-observability.network.bytes.persecvalue: column:BytesTotalPersec- key: custom.demo.host-observability.network.bytes.received.persecvalue: column:BytesReceivedPersec- key: custom.demo.host-observability.network.bytes.sent.persecvalue: column:BytesSentPersecdimensions:- key: network.typevalue: const:Adapter- key: network.namevalue: column:Name- subgroup: Interfacesquery: SELECT Name, BytesTotalPersec, BytesReceivedPersec, BytesSentPersec FROM Win32_PerfFormattedData_Tcpip_NetworkInterfacemetrics:- key: custom.demo.host-observability.network.bytes.persecvalue: column:BytesTotalPersec- key: custom.demo.host-observability.network.bytes.received.persecvalue: column:BytesReceivedPersec- key: custom.demo.host-observability.network.bytes.sent.persecvalue: column:BytesSentPersecdimensions:- key: network.typevalue: const:Interface- key: network.namevalue: column:Name
Results
Your six metrics should show up in the Metrics browser. To find them, filter by text custom.demo.
Next step: Metric metadata
 ExtensionsInfrastructure Observability