Unified analysis tutorial
- 5-min read
- Published Apr 19, 2023
This is a step-by-step tutorial on how to upload the custom topology to your Dynatrace environment and build an extension to define the topology types and relationships between them.
You can then define your unified analysis screens to analyze data from multiple sources, including logs, metrics, and traces in a unified view. You can also include various data sources and dimensions, apply filters, and drill down into specific details.
Prerequisites
- Dynatrace CLI
- Python 3.8 or 3.9
- Access to pip package installer for Python
- Install dt-cli
For more information, see Sign extensions.pip install dt-cli
- Token with the following permissions:
- Read credential vault entries (
credentialVault.read) - Write credential vault entries (
credentialVault.write) - Read entities (
entities.read) - Write entities (
entities.write) - Ingest events (
events.ingest) - Ingest metrics (
metrics.ingest) - Ingest logs (
logs.ingest) - Read extensions (
extensions.read) - Write extensions (
extensions.write)
- Read credential vault entries (
Upload sample observability data to your environment
In this example, we use Easy Taxis Fleet Simulator—an interactive CLI app that simulates a fleet of smart taxis sending observability data to the Dynatrace environment.
-
Based on your operating system, download the appropriate file from the list of EasyTaxis executables and run it.
-
Type
helpto list all available commands. -
Use the command below to start up the fleet simulation.
start -e <your-environment-url> -t <your-api-token>Be sure to replace
<your-environment-url>and<your-api-token>with the actual values.For more information about the arguments and flags, use
start helpcommand.
The simulation ingests metrics, logs, and events to your Dynatrace environment.
Build and upload the extension
-
Go to the GitHub page and download the Observability Clinic Materials.
-
Open the
extensions-project-starterfolder in your preferred code environment. -
Go to the
scriptsfolder and open theconfig.yamlfile. You need to complete three mandatory fields with your environment URL, token, and schema version.tenant_url: <your-environment-url>api_token: <your-api-token>schema_version: 1.265 -
From the
scriptsdirectory, execute the following command to generate certificates.python initialize.pyThe generated certificates now can be found in the
certsfolder. -
Execute the following command to download the schemas for version 1.265.
python download_schemas.py -
Go to the
extensionfolder and create theextension.yamlfile. For more information about extension scope, see Extension YAML file. -
Use the following extension example of the defined topology. For more information about topology scope, see WMI tutorial - custom topology.
name: custom:ua.exampleversion: 1.0.0minDynatraceVersion: "1.238"author:name: Joe Doetopology:types:- enabled: truename: easytaxis:smart_fleetdisplayName: Smart Fleetrules:- idPattern: fleet_{fleet.id}instanceNamePattern: Smart Fleet ({fleet.id})iconPattern: clustersources:- sourceType: Metricscondition: $prefix(custom.easytaxis.fleet)attributes:- key: FleetIDpattern: "{fleet.id}"- key: Locationpattern: "{fleet.location}"role: default- idPattern: fleet_{fleet.id}instanceNamePattern: Smart Fleet ({fleet.id})iconPattern: clustersources:- sourceType: Metricscondition: $prefix(custom.easytaxis.taxi)- sourceType: Logsrole: default- enabled: truename: easytaxis:smart_taxidisplayName: Smart Taxirules:- idPattern: taxi_{fleet.id}_{taxi.id}instanceNamePattern: Smart Taxi ({taxi.id})sources:- sourceType: Metricscondition: $prefix(custom.easytaxis.taxi)attributes:- key: TaxiIDpattern: "{taxi.id}"- key: RegistrationNumberpattern: "{taxi.registration}"- key: Classpattern: "{taxi.class}"role: defaultrelationships:- enabled: truesources:- sourceType: Metricscondition: $prefix(custom.easytaxis)fromType: easytaxis:smart_taxitypeOfRelation: CHILD_OFtoType: easytaxis:smart_fleet -
Execute the following command to sign the extension and upload it to the environment.
python build_and_upload.py
Verify your progress
If you now go to Settings > Topology model > Generic types, you'll see that the Smart Fleet and Smart taxi types have been created. You can also see the defined relationship between them in the Generic relationships section.
-
For a list of Smart Fleet instances, go to
<your-environment>/ui/entity/list/easytaxis:smart_fleet.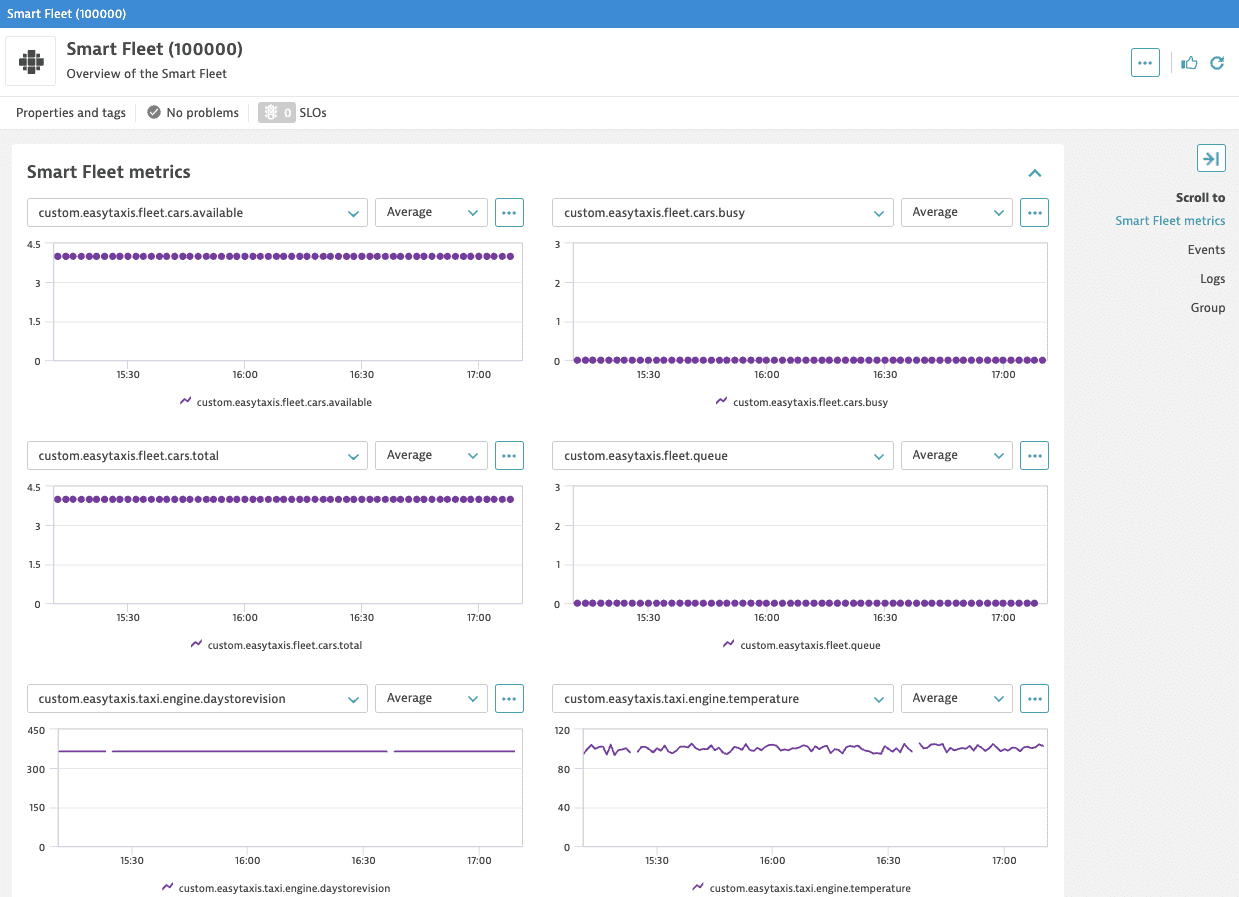
-
For a list of Smart Taxi instances, go to
<your-environment>/ui/entity/list/easytaxis:smart_taxi.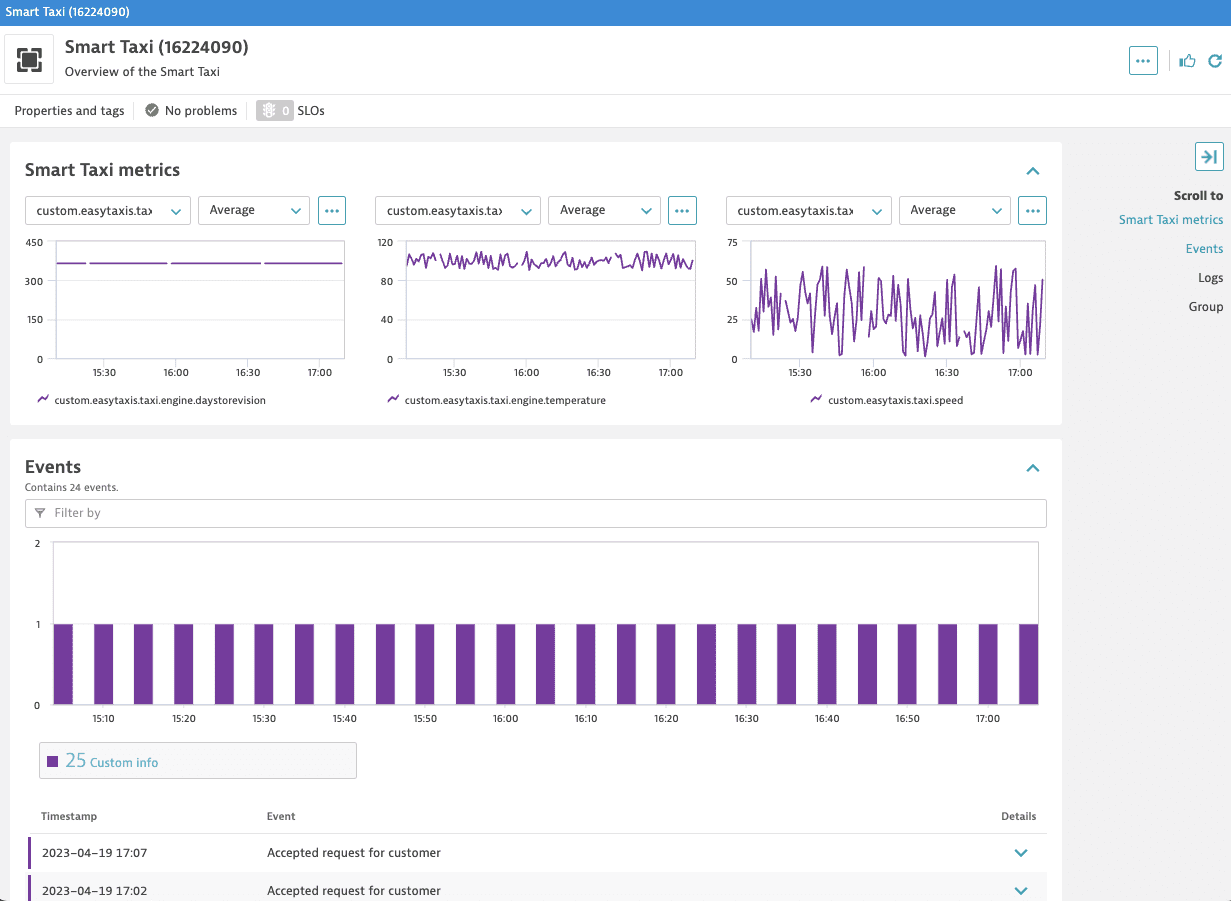
Configure unified analysis screens
You can now customize your entity screens by creating a screen definition in the extension.yaml file.
screens:- entityType: easytaxis:smart_fleetdetailsSettings:staticContent:showProblems: trueshowProperties: trueshowTags: trueshowGlobalFilter: trueshowAddTag: truelayout:autoGenerate: falsecards:- type: ENTITIES_LISTkey: fleet-list-taxisentitiesListCards:- key: fleet-list-taxisdisplayName: Taxis part of this fleetpageSize: 5entitiesLimit: 500displayCharts: falseenableDetailsExpandability: truenumberOfVisibleCharts: 2displayIcons: trueentitySelectorTemplate: type(easytaxis:smart_taxi),fromRelationships.isChildOf($(entityConditions))columns:- type: ATTRIBUTEattribute:key: ClassdisplayName: Class- type: ATTRIBUTEattribute:key: RegistrationNumberdisplayName: Registrationcharts:- displayName: Engine TemperaturegraphChartConfig:visualization:themeColor: DEFAULTseriesType: LINEmetrics:- metricSelector: custom.easytaxis.taxi.engine.temperaturevisualizationType: GRAPH_CHART- displayName: SpeedgraphChartConfig:visualization:themeColor: DEFAULTseriesType: LINEmetrics:- metricSelector: custom.easytaxis.taxi.speedvisualizationType: GRAPH_CHART- entityType: easytaxis:smart_taxipropertiesCard:properties:- type: RELATIONrelation:entitySelectorTemplate: type(easytaxis:smart_fleet),toRelationships.isChildOf($(entityConditions))displayName: Mother FleetdetailsSettings:staticContent:showTags: trueshowProperties: trueshowProblems: trueshowAddTag: trueshowGlobalFilter: truelayout:autoGenerate: falsecards:- type: CHART_GROUPkey: taxi-metricschartsCards:- key: taxi-metricsdisplayName: Smart Taxi MetricsnumberOfVisibleCharts: 3charts:- displayName: Engine TemperaturegraphChartConfig:visualization:themeColor: DEFAULTseriesType: LINEmetrics:- metricSelector: custom.easytaxis.taxi.engine.temperaturevisualizationType: GRAPH_CHART- displayName: SpeedgraphChartConfig:visualization:themeColor: DEFAULTseriesType: LINEmetrics:- metricSelector: custom.easytaxis.taxi.speedvisualizationType: GRAPH_CHART- displayName: Days to revisiongraphChartConfig:visualization:themeColor: DEFAULTseriesType: LINEmetrics:- metricSelector: custom.easytaxis.taxi.engine.daystorevisionvisualizationType: GRAPH_CHARTlistSettings:staticContent:showGlobalFilter: truelayout:autoGenerate: true
-
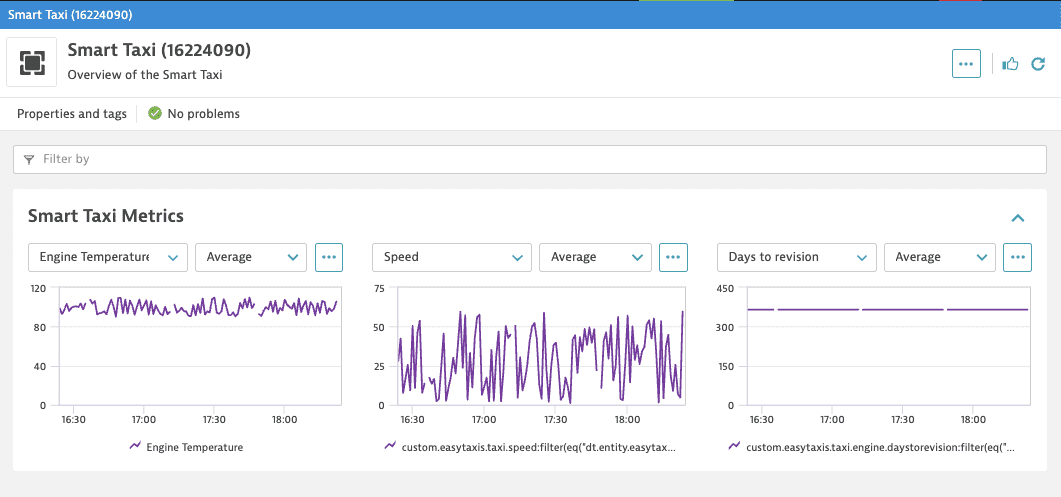
For the Smart Taxi entity, this definition includes three charts with data on speed, engine temperature and days to revision.
Smart Taxi entity screen
-
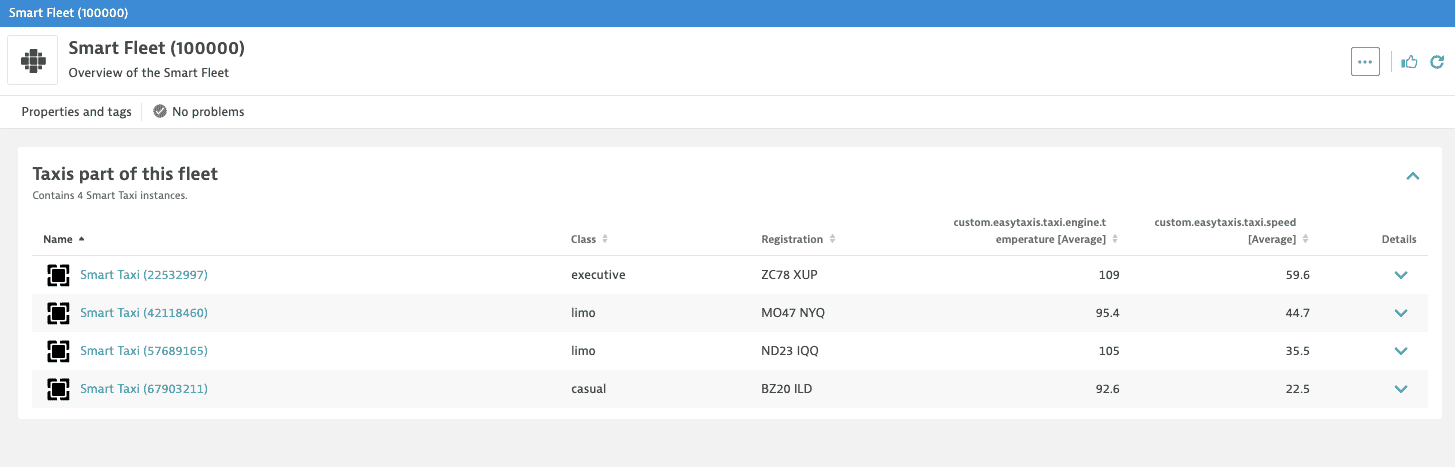
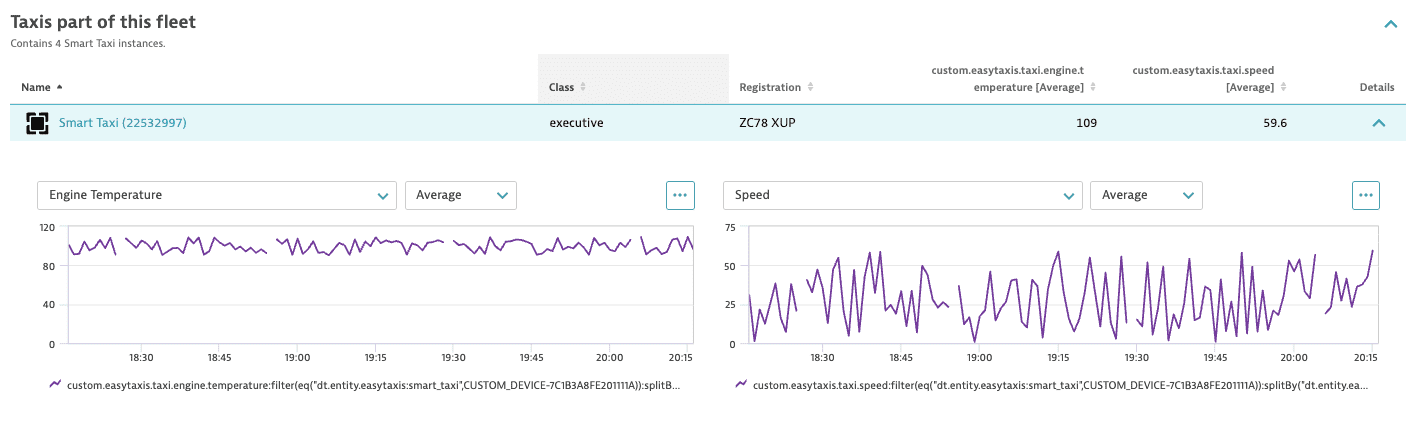
For the Smart Fleet entity, this definition includes the list of the taxis that are a part of this fleet. You can expand each taxi entity and see two graphs with speed and engine temperature data.
Smart Fleet entity screen